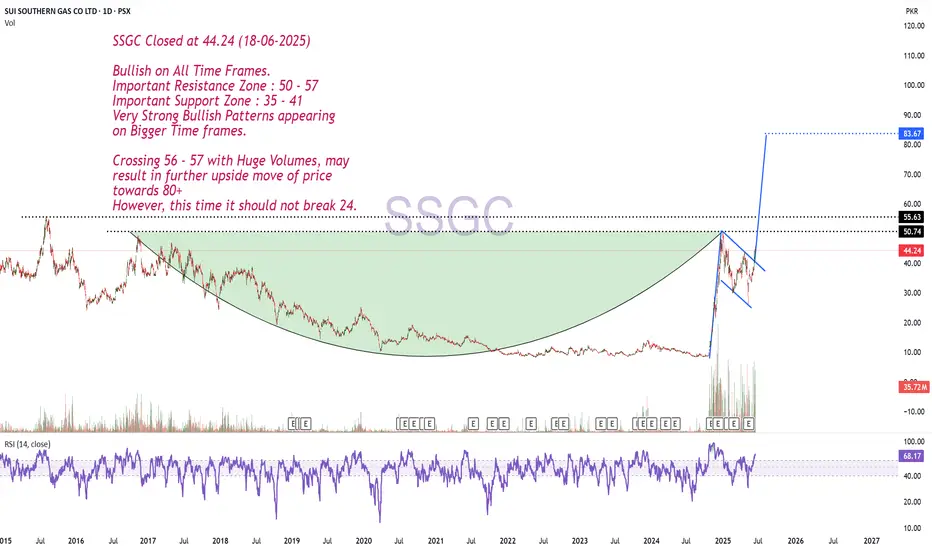
Bullish on All Time Frames.SSGC Closed at 44.24 (18-06-2025)
Bullish on All Time Frames.
Important Resistance Zone : 50 - 57
Important Support Zone : 35 - 41
Very Strong Bullish Patterns appearing
on Bigger Time frames.
Crossing 56 - 57 with Huge Volumes, may
result in further upside move of price
towards 80+
However, this time it should not break 24.
#continuationpattern
GU Bulls Raise "Flag" Eyeing Higher PricesFX:GBPUSD has formed a Bull Flag and we could be getting ready to see the Bulls take the spotlight!
After Price broke through the Previous Level of Structure, Price retraces the High of 1.35589 to the 50% Fibonacci Level @ 1.35022 and is supported pushing Price back up from the Previous Level of Structure.
-The 50% retracement signals the end of the Consolidation Phase of the Pattern.
Now with a Bull Flag being a Continuation Pattern, we can suspect that Price will give us a Bullish Breakout of the Descending Channel and Retest before moving higher Confirming the Pattern and once the Breakout is Validated!
Based off the "Flagpole" of the Pattern, if a Bullish Breakout is Validated and the Retest is Successful, the extension of the Set-up would place the Price Target @ 1.3640 which is at the next big level of Resistance.


How High Can BITCOIN go versus GOLD (sorry uncle Peter Schiff)One of the frequent topics of discussion revolves around the legitimacy of this pattern. There’s a widespread misunderstanding about the continuation type of the Head and Shoulders (H&S) pattern.
Indeed, it is a valid and dependable chart pattern.
Let’s explore this often-recognized chart pattern in more detail.
The Head and Shoulders chart pattern can manifest as a continuation on price charts. In an uptrend, a continuation H&S will closely resemble a H&S bottom, while in a downtrend, it will look like an inverse H&S. The implications and interpretations of a continuation H&S are generally consistent with those of reversal patterns. Price targets can be established in the same manner as they are for reversal patterns.
When a head and shoulders continuation forms during an uptrend, it typically breaks out to new highs once the pattern is completed. Breakouts to all-time highs from bullish continuation patterns are often reliable and robust.
Edwards and Magee highlighted the H&S continuation in their book, "Technical Analysis of Stock Trends," back in the 1930s. The pattern remains largely unchanged in today’s price charts.

Tesla - Indecision with the triangleNASDAQ:TSLA has been consolidating for almost 4 years and is definitely ready for a breakout!
+3.300% was the previous rally on Tesla which started back in 2019. But at the moment Tesla is not looking bullish whatsoever, considering that Tesla is trading at the same level as it was about four years ago. However, there is a long term descending triangle formation forming and therefore it is quite likely that we will (soon) see a breakout, either towards the upside or towards the downside.
Levels to watch: $210, $120
Keep your long term vision,
Philip - BasicTrading

ETHUSD: Thoughts and Analysis Today's focus: ETHUSD
Pattern – Continuation
Support – 2878 & 3060
Resistance – 3150 & 3315
Hi, traders. Thanks for tuning in for today's update. Today, we are looking at ETHUSD on its daily chart.
Do we have a continuation confirmation? Firm buying continues to push that case as the price continues to track higher today. Do you agree with our top-down analysis?
Watch out for any new push lower that moves back to support. This could be a warning that buyers don't have the number just yet.
Good trading.

GBPUSD Swing Analysis on DAILYDaily currently in a bullish pennant.
Expecting price to reach daily support & resistance levels after breakout.
Swing / position stack opportunity.

Nasdaq Analysis Week of May 19th Weekly= Bullish
Daily= Bullish
4H= Bullish
1H= Falling Flag Pattern = Continuation Pattern
30 min & 5 min inverse head & shoulders. Expecting price to respect both patterns and continue up. First TP level around 18664.

WB - Long Trade Opportunity with plenty of upside roomWe will want to see confirmation of an activation of one of our buying continuation algos. Will not be entering a trade until I see it activated.
Happy Trading :)
- TraderDaddyOG

Mastering High Probability Trading EnvironmentsIn this educational video, we'll delve into High Probability Trading Environments and introduce a simple yet effective concept to confirm their presence . Understanding these environments will empower you to confidently navigate the market with consistency and success.
For a comprehensive understanding, I recommend watching my previous video on Understanding Trend Analysis, SMT, and ICT Concepts below.
If you have any questions, feel free to leave them in the comments section.
Happy trading!
The_Architect

NVDA - Bullish Symmetrical Triangle | March 2024Symmetrical Triangle Breakout Pattern for NVDA - This could also be a head shoulders to the downside but with so much momentum going into next week and recent upgrades from major financial institutions anything is possible.. I’m bullish on this one

Understanding Trend Analysis, SMT and ICT ConceptsIn this video, I'll delve into the concept of Institutional Market Structure, a vital tool for trend analysis. Specifically, we'll explore the Smart Money Tool/Technique (SMT), which provides insights into whether a market will continue its trend or potentially reverse. Understanding these concepts is crucial for effective trading strategies. Sit back, relax, and enjoy the video!
Please do leave any questions in the comment section if you have any.
Kind Regards,
The_Architect

Latentview : Symmetrical WedgeAfter hitting all three of our previous targets the NSE:LATENTVIEW is currently exhibiting characteristics of a symmetrical wedge pattern, indicating a potential period of consolidation and indecision in the market. A symmetrical wedge pattern is identified by two converging trendlines, both sloping inwards. This formation signifies a period of decreasing volatility and tightening trading ranges as the highs and lows of the price action gradually converge. The symmetrical wedge pattern is considered a continuation pattern, implying that the prior trend, in this case, the prolonged upside run, could resume after the pattern's completion.
Breakout Strategy:
To effectively capitalize on this pattern, traders should exercise patience and wait for a confirmed breakout from the symmetrical wedge formation. A breakout occurs when the price decisively moves above or below one of the trendlines, accompanied by significant volume, signaling a shift in market sentiment.
Confirmation and Risk Management:
It's crucial to wait for confirmation of the breakout and avoid preemptive entries. Additionally, traders should implement proper risk management techniques, such as setting stop-loss orders to mitigate potential losses in case of a false breakout or adverse price movement.
Conclusion:
In summary, the formation of a symmetrical wedge pattern after a long upside run on the NSE:LATENTVIEW chart suggests a period of consolidation and indecision in the market.

CMDX's Epic Breakout: From Falling Wedge to Sky-High Targets! 🚀CMDX/USD: Navigating the Breakout and Continuation Patterns
CMDX/USD Technical Analysis Overview:
In a striking turn of events, CMDX/USD has shattered its major falling wedge structure, signaling a bullish momentum that has caught the eye of many traders. Following this breakout, CMDX/USD is currently crafting another continuation pattern, reminiscent of a falling wedge, suggesting that the bullish narrative is far from over.
Key Fibonacci Retracement Levels to Watch:
As CMDX/USD carves its path upwards, the Fibonacci retracement levels offer significant take-profit zones that traders should monitor closely:
Initial Target Zone: The $.085-$.10 region, correlating with the 38.2% Fibonacci retracement level, serves as the first major area where traders might consider taking profits.
Midway Point: Progressing further, the $.19-$.20 range aligns with the 50% retracement level, marking a critical halfway point in the asset's recovery journey.
Higher Ambition: For those with a more bullish outlook, the $.55-$.88 zone, matching the 78.6% retracement level, presents an ambitious target, hinting at a strong bullish conviction.
Ultimate Targets and Price Discovery:
Top of the Wedge: The apex target at the top of the wedge stands at $2.70, a level that would not only confirm the strength of the current trend but also set the stage for potential price discovery.
Beyond All-Time Highs: Should CMDX/USD venture into uncharted territories beyond its all-time high, the $9-$11 range emerges as the grand 1.272 Fibonacci extension level, offering a glimpse into the asset's long-term potential.
Timeframe and Strategy:
This unfolding scenario might span several months, urging traders to adopt a blend of patience and vigilance. Keeping a close eye on volume, market sentiment, and related macroeconomic factors will be crucial in navigating this journey.
Conclusion:
The CMDX/USD pair is painting a bullish tapestry, marked by breakout and continuation patterns that beckon traders with a long-term vision. As we traverse these Fibonacci landmarks, the journey promises to be both exhilarating and testing, with the ultimate prize lying in the mastery of timing and strategy.
Disclaimer: This analysis is for informational purposes only and should not be construed as financial advice. Always conduct your due diligence and consult with a financial advisor before making investment decisions.

NDQ100 (Nasdaq) Thoughts and Analysis. Today's focus: NDQ100 (Nasdaq)
Pattern – Continuation (Bullish)
Support – 17,804
Resistance – 18,047
Hi, traders; thanks for tuning in for today's update. Today, we are looking at NDX100 on the daily chart.
Today, we are asking if the NDX100 index will contnue to move higher after putting up several key price action points. Have buyers set the tone for a new extension higher? A main point for us will be that price remains above resistance. We have also run over a few warning signs if sellers start a new push lower.
Good trading.

AUDUSD 0.66023 -0.13 % SHORT IDEA MTF BREAKDOWN 🐻🐻📌HELLO TRADERS
Hope everyone is doing great 🛑
A look at AUDUSD ahead of the WEEK 📌
LET'S LOOK AT THE DAILY DXY
DXY D TF
* Looking at DXY from the DAILY TF we see a break BELOW (SSL) which are Monday lows.
* Swept SSL but traded back into the range with some bullish momentum.
* If we see momentum back into the range i would be looking for long.
* Looking for long on the DXY because we do not have a bearish body closure.
* & we are still in an indecisive state, in wick city as well.
AUDUSD DAILY TF
* On the DAILY we are trading from IRL in a bearish FVG.
* We have a DRAW IN LQ in the form of equal lows ERL .
* looking for some retracement into PD ARRAYS ( FVG + OB & balance price range)
* & should they hold looking for continuations with the bears.
* Violation of the FVG signals bullish momentum and some confirmations that invalidates the trade.
AUDUSD 4H TF
* Looking to take BSL.
* This will possibly be signaling a bearish week ahead.
* Sweep of BSL and trading back in the range.
1. IRL - ERL
2.Looking for LQ RUNS.
AUDUSD 1H TF
* We are range bound on the HOUR TF
* looking for SHORT entries.
* Possible retracement before continuation.
HOPE YOU ENJOYED THIS OUT LOOK, SHARE YOURS BELOW🛑
lets see how it goes.
IF THIS IDEA ASSISTS IN ANY OR IF YOU LIKE THIS ONE
SMASH THAT LIKE BUTTON & LEAVE A COMMENT.
ALWAYS APPRECIATED
____________________________________________________________________________________________________________________
* Kindly follow your entry rules on entries & stops. |* Some of The idea's may be predictive yet are not financial advice or signals. | *Trading plans can change at anytime reactive to the market. | * Many stars must align with the plan before executing the trade, kindly follow your rules & RISK MANAGEMENT.
_____________________________________________________________________________________________________________________
| * ENTRY & SL -KINDLY FOLLOW YOUR RULES | * RISK-MANAGEMENT | *PERIOD - I TAKE MY TRADES ON A INTRA DAY SESSIONS BASIS THIS IS NOT FINACIAL ADVICE TO EXCECUTE ❤
LOVELY TRADING WEEK TO YOU!

ORCL Textbook Bull Pennant Coincident With Index Support CatchORCL Upside break-out of a Descending Pennant.
Some things to note:
Hold of 50 EMA within the pattern
High volume entry into the pattern with descending volume throughout
Notable pickup in activity on the upside break
MACD Cross coinciding with break
Throwback following the upside break that tracks along the upper bound of the pattern and is halted at the 50 EMA
Measuring Implications for the pennant begin with a break out of a previous resistance to the top of the minor move that begins the pattern. The resulting move applies this distance to the beginning of the breakout of the pattern.
I have marked and color coded two potential areas to take into account when measuring for price targets, and marked volume POI's to justify those as start-points for their measuring.
PT1: 164
PT2: 143
SL: 50 EMA Break-down
Some other things going on that I observe:
SPX, DJIA, IXIC bouncing following minor (representing trend, not magnitude) decline
VIX 200 EMA rejection. Still cemented below 20 for now.
This analysis is for future price implications of ORCL.
I currently hold a position entered on AUG16.
Feel free to reach out for questions, including a review of a textbook pennant.
Manage Risk
Only invest what you are willing to lose
I warrant that the information created and published by me on TradingView is not prohibited, doesn't constitute investment advice, and isn't created solely for qualified investors.

Lesser Long PositionKing W. Harbmayg's Journal Entry #
Lesser Position
1. Pair & Position:
USDJPY— 1:5 RR
Long—
according to the Harbmayg Schematic, the market has successfully:
a. aligned with the daily template,
b. printed confirmation structure,
c. printed the inversion candle
2. Performance: (1 out of 5)
Confidence— 4
Discipline— 4
Execution— 5

$ALTO Bull Flag Formation After Wedge Break! 🚩🐂Hey traders! 👋📈 I've identified a compelling bullish setup on NASDAQ:ALTO that I wanted to share with you. It appears to be forming a bull flag pattern after a successful wedge break on the monthly timeframe, indicating potential upward momentum. Let's dive into the details! 📊💡
🔍 Symbol: NASDAQ:ALTO
📅 Timeframe: Monthly
📉 Previous Pattern: Wedge Breakout
📌 Bull Flag Formation:
After breaking out of the wedge pattern, NASDAQ:ALTO has been consolidating within a tight range, forming what looks like a bull flag. The flagpole represents the initial strong upward move, while the flag itself consists of parallel trend lines, indicating a temporary pause before another potential leg up.
📈 Entry Trigger:
To validate the bullish scenario, we'll need to see a clear breakout above the upper trendline of the bull flag formation. This breakout should be accompanied by increased volume, signifying renewed buying interest. Consider setting an entry trigger above , confirming the continuation of the upward trend.
🎯 Target Levels:
Based on the height of the flagpole, we can project a potential target for the next leg up. Measure the distance from the bottom of the flagpole to the breakout point and add it to the breakout level to estimate the target. Keep an eye on as potential price objectives.
⚠️ Risk Management:
As with any trade, it's crucial to manage risk effectively. Consider placing a stop-loss order below the lower trendline of the bull flag or at a level that aligns with your risk tolerance. This way, you can protect your capital in case the pattern fails to play out as expected.
Remember to conduct your own analysis and adjust your trading strategy based on your risk profile and market conditions.
📊 Hashtags: #ALTO #BullFlag #WedgeBreakout #TechnicalAnalysis #TradingView
Please note that this analysis is based on technical analysis principles and should be used as a starting point for further research. Keep an eye on price action, volume, and any relevant news that could impact the trade.
Happy trading! 📈💰
Disclaimer: This is not financial advice. Trading involves risks, and you should only trade with capital you can afford to lose. Always consult with a professional financial advisor before making any investment decisions.

NZDUSD- 60 MINS TIMEFRAMEThe Structure looks good to us, waiting for this instrument to correct and then give us these opportunities as shown on this instrument (Price Chart).
Note: Its my view only and its for educational purpose only. Only who has got knowledge about this strategy, will understand what to be done on this setup. its purely based on my technical analysis only (strategies). we don't focus on the short term moves, we look for only for Bullish or Bearish Impulsive moves on the setups after a good price action is formed as per the strategy. we never get into corrective moves. because it will test our patience and also it will be a bullish or a bearish trap. and try trade the big moves.
we do not get into bullish or bearish traps. We anticipate and get into only big bullish or bearish moves (Impulsive Moves). Just ride the Bullish or Bearish Impulsive Move. Learn & Know the Complete Market Cycle.
Buy Low and Sell High Concept. Buy at Cheaper Price and Sell at Expensive Price.
Keep it simple, keep it Unique.
please keep your comments useful & respectful.
Thanks for your support....
Tradelikemee Academy

GBPUSD continuation lower idea If the US dollar can continue to strengthen, then we should be looking for further weakness in the pound and other major dollar crosses

$ISV - Breakout play for +10 to 30% Technical Analysis (TA)
The monthly and weekly was oversold and price pushed higher with significant momentum after a consolidation phase.
Retracement to $25 is expected However, the push to $30 would require catalysts to increase momentum.
We could hit $25 and then come back down or go through another consolidation phase before further upside to $30.
Price Target
Entry: $22-$23
Target 1: $25
Target 2: $30

LYFT continuing a BreakoutLYFT beat earnings by 4X this past week and so brokeout.
On the cloud indicator, the conversion line has diverged above
the baseline.
LYFT could be watched for breakout continuation.
The Awesome Oscillator and VWAP Oscillators validate the breakout,
Added to watchlist for Monday, Aug 8th
Plan to check UBER. NASDAQ:LYFT
