Gold at Key Rejection Zone: Will the Drop Resume from $3310?By examining the gold chart on the 4-hour timeframe, we can see that after some consolidation between $3294 and $3302, the price finally began a sharp drop, correcting down to $3245. This area was a key demand zone on lower timeframes, which triggered a rebound, and gold is now trading around $3310. If the price gets rejected from the $3310–$3313 zone, we can expect another potential decline.
Please support me with your likes and comments to motivate me to share more analysis with you and share your opinion about the possible trend of this chart with me !
Best Regards , Arman Shaban
#forex#gbpusd

XAU/USD: Bull or Bear? Let's Find Out! (READ THE CAPTION)By examining the gold chart on the 4-hour timeframe, we can see that after our previous analysis, the price first corrected to the $3323 area and is currently trading around $3336. As mentioned in the previous analysis, as long as the price remains above $3313, we can expect further upside for gold. Based on the prior analysis, the next bullish targets are $3342, $3358, $3366, and $3394.
Please support me with your likes and comments to motivate me to share more analysis with you and share your opinion about the possible trend of this chart with me !
Best Regards , Arman Shaban

Double Top Alert: Key Resistance at 1.3570 Before US PCE DataGBPUSD PLAN – MAY 27 | Double Top Alert: Key Resistance at 1.3570 Before US PCE Data
GBPUSD is currently testing a critical resistance zone near 1.3570, forming a potential Double Top pattern. As markets await this week’s US Core PCE inflation release, the pair may be at risk of a short-term pullback.
🌍 MACRO FUNDAMENTALS
USD Rebounds Slightly ahead of April’s PCE inflation report – a key Fed inflation gauge due this Friday.
GBP Under Pressure as dovish tones from Bank of England (BoE) officials signal a potential pause in rate hikes.
UK Political Uncertainty and sluggish EU-UK trade talks continue to dampen investor confidence in the pound.
📊 TECHNICAL ANALYSIS
Price Structure: GBPUSD surged from 1.3446 support but is now facing resistance near 1.3570, where a Double Top formation is emerging.
Key Levels:
Resistance: 1.3570 – 1.3580 (previous high and psychological barrier)
Support 1: 1.3496 (confluence of EMA89 and 38.2% Fibonacci retracement)
Support 2: 1.3446
Indicators:
EMA13, EMA34 show early signs of bearish crossover on the 30-minute chart.
RSI approaches overbought territory, hinting at potential bearish divergence.
🎯 TRADE SETUP (IF PRICE REJECTS 1.3570)
🔻 SELL SETUP
Entry: 1.3570 – 1.3550
Stop-Loss: 1.3595
Take-Profit Targets:
TP1: 1.3496
TP2: 1.3446
📌 A bullish breakout only becomes valid if price closes strongly above 1.3590 on the H1 chart.
🧠 STRATEGIC NOTES
Wait for a clear reaction or bearish confirmation near 1.3570 before entering trades.
Avoid chasing trades mid-range; focus on clean breakouts or rejections.
PCE data may trigger volatility — manage risk tightly and prepare for directional momentum.
👉 What do you think of this Double Top scenario? Will GBPUSD reject or break through resistance? Drop your analysis below and follow for daily structured plans!

XAU/USD: It's time for Fall? (READ THE CAPTION)By analyzing the gold chart on the 2-hour timeframe, we can see that after our last analysis, the price continued to rise as expected and reached $3344. As I anticipated last week, the gap between $3311 and $3322 has finally been filled! This analysis has delivered a return of over 1090 pips so far. After hitting the $3340 zone, the price faced strong selling pressure and is currently trading around $3294. If gold manages to hold below $3284, we could expect further downside. This analysis will be updated!
Please support me with your likes and comments to motivate me to share more analysis with you and share your opinion about the possible trend of this chart with me !
Best Regards , Arman Shaban

breaking above its previous swing high.GBP/USD Technical – Break of Structure, Liquidity Sweep, and Potential Downside Movement
The GBP/USD currency pair recently demonstrated significant bullish strength by breaking above its previous swing high, which resulted in a clear Break of Structure (BOS). This move indicated a continuation of the upward trend as the market pushed higher. However, the latest price action suggests a shift in sentiment that traders should be aware of.
Despite the earlier bullish momentum, the market has now swept the previous daily swing high—meaning it briefly moved above that level only to close back below it. This kind of price behavior often signals a potential liquidity grab rather than a sustained breakout. Such a move is frequently followed by a reversal or corrective move to the downside, as it indicates that institutional participants may have been targeting stop-losses or resting liquidity before driving the price in the opposite direction.
Given this, there is a growing possibility that the market may retrace further downward. A likely target could be the previously marked swing low, where additional liquidity may be resting. Moreover, beneath this level lies a Bullish Price Rebalance (BPR) zone, which could serve as an area of interest for a potential bullish reaction if the market taps into it.
At this stage, it's crucial to monitor price action closely and wait for further confirmations before taking any directional bias. Watching how the market behaves near the previous swing low and the underlying BPR zone can offer valuable insight into the next probable move.
As always, conduct your own thorough research (DYOR) before making any trading decisions. This is not financial advice and is intended solely for educational and analytical purposes.

XAU/USD: More Bullish Move Ahead? (READ THE CAPTION)By analyzing the gold chart on the 2-hour timeframe, we can see that after our last analysis, the price dropped to $3120, and then faced strong buying pressure, pushing it back up to the $3240 area! Gold is now trading in a critical zone for trend direction. If the price manages to hold above $3233, we can expect further bullish movement. This analysis will be updated with your support!
Please support me with your likes and comments to motivate me to share more analysis with you and share your opinion about the possible trend of this chart with me !
Best Regards , Arman Shaban

GBPUSD Week 21 Swing Zone/LevelsNot Always.
Not always will price conform to hypothesis, but in following good RRR success is assured.
We setup week 21 levels and zone as shown with the predicted pathways.
Trade Parameters: Entry on 5 mins chart
Sl 10-15pips
TP usually dynamic but typically 5x
Follow on for trade updates.
As Always PRICE determines trades

XAU/USD: Gold Regains Strength After Pullback – New Highs Ahead?By analyzing the gold chart on the 2-hour timeframe, we can see that yesterday, as expected, gold surged above $3400, reaching as high as $3439 before facing strong selling pressure, dropping sharply to $3359.
Currently, gold is trading around $3385, and if the price can hold above $3366, we may expect further bullish momentum. I believe gold is setting up for another move above $3400, potentially aiming to break into new highs once again.
THE LATEST ANALYSIS :
Please support me with your likes and comments to motivate me to share more analysis with you and share your opinion about the possible trend of this chart with me !
Best Regards , Arman Shaban

Morning Star To Wake GU TradersFX:GBPUSD has fallen into a Wedge Pattern after breaking Mondays Highs!
Price this morning has seemingly found Support at the 50% Retracement level signaling the potential ending of the Consolidation phase of the Wedge!
This Retracement comes in the form of a Morning Star, a strong Triple Candle Reversal Pattern!
If Price is supported in this area, we could see a Bullish Break to this Pattern delivering a Long Opportunities as a Break and Retest Set-up!

XAU/USD: Gold Eyes $3400+ After Explosive Surge! (READ CAPTION)By analyzing the gold chart on the 1-hour timeframe, we can see that price once again hit our targets! As expected, gold had a strong bullish rally yesterday and today, reaching both $3328 and $3345, and even extending to $3387.
This surge was fueled by escalating tensions in the Middle East, particularly between Israel and Yemen. Since the conflict shows no signs of easing and further threats remain on the table, I believe gold is not done yet — we may soon see it push above $3400.
These are sensitive days, so please be extra cautious with your trades. Don’t let fear or greed take over — consistency and emotional stability are key to long-term success in this market.
I’ll continue posting more frequent updates to help you stay informed — but that depends on your strong support! Let’s keep growing together!
Please support me with your likes and comments to motivate me to share more analysis with you and share your opinion about the possible trend of this chart with me !
Best Regards , Arman Shaban

XAU/USD: NFP has come,What's Next? (READ THE CAPTION)By analyzing the gold chart on the 1-hour timeframe, we can see that after yesterday’s analysis, the price successfully rallied from $3231 to $3268. Once it reached that zone, selling pressure kicked in, and gold has since corrected down to $3239.
If gold stabilizes below $3257, we may expect further downside. The potential bearish targets are $3237 and $3221.
Keep a close eye on the $3209–$3220 zone, as price reaction there could be significant.
Please support me with your likes and comments to motivate me to share more analysis with you and share your opinion about the possible trend of this chart with me !
Best Regards , Arman Shaban

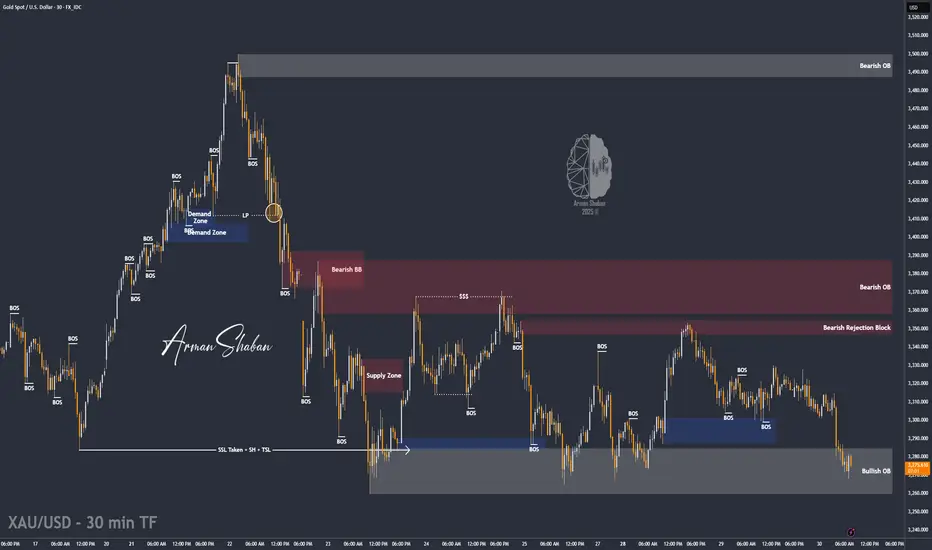
XAU/USD: High Volatility is Expected! (READ THE CAPTION)By analyzing the gold chart on the 30-minute timeframe, we can see that, as expected, the price began rising from the $3310 zone yesterday and reached $3330, delivering a 200-pip gain.
After that, selling pressure took over, and gold is now trading around $3277. Given the current market structure and today's important news events, I expect high volatility in both bullish and bearish directions.
One of the key liquidity pools likely to be targeted today lies below $3259, and before any potential drop, we may see the liquidity gap between $3288 and $3303 being filled.
Please support me with your likes and comments to motivate me to share more analysis with you and share your opinion about the possible trend of this chart with me !
Best Regards , Arman Shaban
GU Bear Flag Confirmed, Break & Retest Set-UpHere on the 1Hr Chart FX:GBPUSD has formed what seems to be a Continuation Pattern, the Bear Flag!
Now, with Price in a decline prior to entering the Consolidation Phase of the Pattern, this suggests that Price will continue further down if this Break is Validated and a Retest is Successful!
We will want to see:
1) Strong Breaking Candle that is followed by Accumulation of Bearish Volume!!
2) 10 - 20% of the Range, Past the Break
3) 3 - 5 Closing Candles, Outside of Break, Before Retest
This is considered the True or False Formula to determine if its a True Breakout or False Breakout.
RSI is Below the 50 in Bearish Territory with room to stretch Oversold strengthening the Bearish bias.

XAU/USD: Bull or Bear? (READ THE CAPTION)By analyzing the gold chart on the 30-minute timeframe, we can see that yesterday, right after posting the analysis, the price quickly hit the first target at $3307, then experienced a bounce and rallied to the $3369 supply zone. From there, gold faced more downward pressure and eventually reached the targets at $3303, $3297, and nearly $3285.
Currently, gold is trading around $3291, and if $3285 is broken, we could expect further downside toward levels below $3259.
Please support me with your likes and comments to motivate me to share more analysis with you and share your opinion about the possible trend of this chart with me !
Best Regards , Arman Shaban

GBPUSD Review - The fall whilst the Brits sleep?In this video I go through a GBPUSD review of Tuesday/Wednesday, Thursday (yesterday), and the possibilities for Friday (today).
Enjoy!
- R2F Trading

XAU/USD: New ATH ~ $3500, What's Next? (READ THE CAPTION)Upon reviewing the 15-minute gold chart, we can see that the price once again reached a new high today, rallying up to the key psychological level of $3500. Following this move, gold has experienced a pullback down to $3423 so far. If the price stabilizes below $3442, we will likely see a further correction toward the next target at $3411. (This analysis will be updated)
Please support me with your likes and comments to motivate me to share more analysis with you and share your opinion about the possible trend of this chart with me !
Best Regards , Arman Shaban

XAU/USD at a Critical Juncture: Uncovering the Key Levels for ApHere is the technical analysis of the gold/US dollar (XAU/USD) pair on the daily timeframe for today, April 18, 2025, identifying key support and resistance levels based on the latest available data:
⸻
🔹 Current Price:
The price of gold reached an all-time high of $3,357.40 per ounce, driven by growing concerns about tariffs, which Federal Reserve Chairman Jerome Powell described as "much larger" than expected, leading to slower economic growth and higher inflation.
⸻
📊 Technical Analysis (Daily Timeframe):
• Overall trend: Upward, with higher highs and lows, indicating continued positive momentum.
• Moving Averages: The price is trading above all major moving averages, including the 20-day simple moving average at $3,114.60, supporting the uptrend.
• Relative Strength Index (RSI): The RSI remains in the overbought zone, which could indicate a potential short-term price correction.
⸻
🔻 Key Support Levels:
1. $3,317.20 – Immediate support reflecting a previous high.
2. $3,305.65 – Medium-term support.
3. $3,292.80 – Additional support reflecting a previous consolidation zone.
⸻
🔺 Key Resistance Levels:
1. $3,335.00 – Current resistance that was recently tested.
2. $3,350.00 – Important psychological resistance level.
3. $3,375.00 – Potential resistance if the upward momentum continues.
⸻
⚠️ Additional Notes:
• Technical indicators are showing overbought signals, which could lead to a short-term price correction.
• In the event of a correction, the above-mentioned support levels may be potential entry points for investors.
• Upward momentum remains intact, but it is advisable to closely monitor technical indicators to identify appropriate entry and exit points.

XAU/USD: Bull or Bear? (READ THE CAPTION)By analyzing the gold chart in the 1-hour timeframe, we can see that the price managed to register a new high at $3245, but after that, it was followed by a correction and created a change in market structure. I expect that if the price stabilizes below $3213, it will be accompanied by further decline.
The targets are respectively $3187, $3177, $3155, and $3138.
Please support me with your likes and comments to motivate me to share more analysis with you and share your opinion about the possible trend of this chart with me !
Best Regards , Arman Shaban

GBPUSD: Strong Bullish Market 🇬🇧🇺🇸
GBPUSD set a new daily high today.
The pair remains in a strong bullish momentum since 8th of April.
With the complete absence of high impact fundamentals today, buying pressure
may persist.
I believe that it may continue rising at least to 1.33 - the closest historic resistance.
❤️Please, support my work with like, thank you!❤️
I am part of Trade Nation's Influencer program and receive a monthly fee for using their TradingView charts in my analysis.

XAU/USD: A Huge Fall Ahead? (READ THE CAPTION)By re-examining the gold chart on the 30-minute timeframe, we can see that the price once again moved exactly as expected and finally managed to rise back above $3100, reaching as high as $3136.5! Currently, gold is trading around $3120, and I expect we will soon see further decline in gold. The potential downside targets are $3115, $3105, and $3100 respectively. This analysis will be updated again!
The Last Analysis :

Massive Breakout in EUR/USD – Time to Ride the Trend?📊 EUR/USD Daily Technical Outlook – April 11, 2025
The euro-dollar pair (EUR/USD) continued its upward momentum on Friday, reaching a high of $1.1473 before closing at $1.1352. This movement reflects a significant appreciation of the euro, influenced by a weakening U.S. dollar amid escalating trade tensions and a selloff in U.S. Treasuries.
📈 Current Market Structure:
After consolidating earlier in the week, EUR/USD broke above key resistance levels, indicating strong bullish sentiment. The pair's movement suggests a potential shift in market dynamics, with investors seeking alternatives to the dollar.
🔹 Key Resistance Levels:
$1.1473: Immediate resistance. A break above this level could signal further bullish continuation.
$1.1500: Psychological resistance and a potential target for bulls.
$1.1600: A more substantial resistance area that could be tested if momentum continues.
🔸 Key Support Levels:
$1.1300: Recent support. A break below this level could indicate a short-term pullback.
$1.1200: Next significant support, representing a potential bounce point.
$1.1100: A critical support level that, if breached, could lead to a shift in market sentiment.
📐 Price Action Patterns:
The pair's recent breakout above previous resistance levels suggests a strong bullish trend. The formation of higher highs and higher lows supports this view. However, traders should watch for potential reversal patterns near resistance areas.
🧭 Potential Scenarios:
✅ Bullish Scenario: If EUR/USD breaks and holds above $1.1473, it could target $1.1500 and potentially $1.1600. Continued weakness in the U.S. dollar and positive Eurozone data would support this move.
❌ Bearish Scenario: Failure to sustain above $1.1300 may lead to a retest of $1.1200, with further declines possible toward $1.1100 if bearish momentum increases.
📌 Conclusion:
EUR/USD is exhibiting strong bullish momentum, breaking through key resistance levels. Traders should monitor upcoming economic indicators and geopolitical developments that may influence the pair's direction.
💬 What's your outlook for EUR/USD? Do you anticipate continued strength in the euro, or will the dollar regain its footing? Share your thoughts below!
Let me know if you'd like this analysis tailored for a specific platform or with additional details!

XAU/USD: Ready for another Fall? (READ THE CAPTION)By examining the gold chart on the 30-minute timeframe, we can see that yesterday the price once again moved exactly as expected, hitting all four targets: $3022, $3016, $3010, and $3000, and even dropped further to $2956, resulting in a total return of over 700 pips!
Currently, gold is trading around $3003, and if the price stabilizes below $3014, we can expect further downside.
All key demand and supply zones are marked on the chart and are fully tradable.
If the drop continues, the next bearish targets will be $2997, $2991, $2984, and $2976, respectively.
Please support me with your likes and comments to motivate me to share more analysis with you and share your opinion about the possible trend of this chart with me !
Best Regards , Arman Shaban

Will 3 Times Be The Charm For GBPUSD??We can see FX:GBPUSD retrace a tad further up to the Volume Imbalance that was created over the weekend of April 4th - 7th. After Price made its High @ 1.3207, it was immediately rejected back down below the Past Level of Support that is now showing signs of Resistance!
- Following that Higher High not only resulted in a Lower Low but also sent the RSI under 50 into Bearish Territory!
Now in the ICT Methodology of Volume Imbalances, Price is likely to Test or Fill the Imbalance, then once satisfied, has a high potential to turn the opposite direction. Now a Pullback to Fill the Imbalance would land Price right at the 38.2% Fibonacci Level @ 1.28984 where if Bulls are unable to push Price back above, would be an excellent Shorting Opportunity for Bears to overcome.
- RSI is now below the 50 suggesting Bulls have lost steam and strengthens the potential for more downside to occur but that would call for a Break and Retest Scenario on the Rising Support.
Fundamentally, the Federal Reserve will be releasing the CPI y/y and m/m results where analysts believe there to be a .3% decrease in inflation forecasting a 2.5% CPI for March from the previous 2.8% for February. Given this, the FOMC " do not plan to come to rescue Trump with rate cuts" and insist that all the Tariff pressure will actually be a reasoning for Inflation to Rise! So if CPI ends up printing Hotter than Expected (Higher), we could see a renewed strength in the USD.
