GBPJPY sitting at resistance – Is a drop to 193.360 likely?GBPJPY is sitting right at a key daily resistance zone. This is a level where it has struggled to break through and reversed strongly to the downside. So this makes it definitely one to monitor, especially if you’re eyeing potential short setups.
If we start seeing signs that the price is getting rejected here: like long wicks, strong bearish candles, it could be the early indication of another move lower. My focus is on a moderate drop toward the 193.360 area, similar to what we’ve seen in past pullbacks. Nothing too dramatic, just a simple downside play if sellers step in again.
But if we get a strong breakout? That changes everything: it would hint that bulls are taking full control. This area is pretty important and could give us a better idea of where price is headed next.
Just sharing my thoughts on support and resistance, this isn’t financial advice. Always confirm your setups and manage your risk properly.
Disclosure: I am part of Trade Nation's Influencer program and receive a monthly fee for using their TradingView charts in my analysis.
#gbpjpy#forex

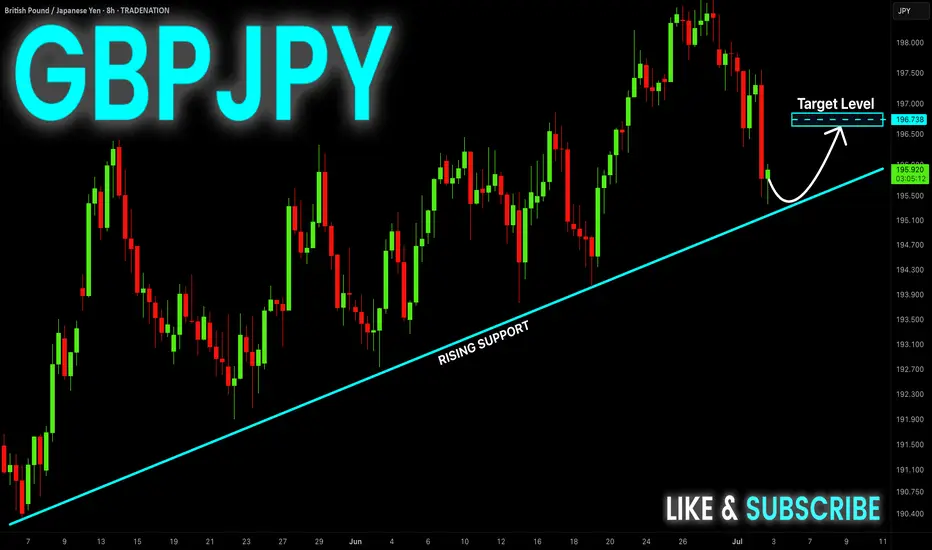
GBP-JPY Correction Ahead! Buy!
Hello,Traders!
GBP-JPY will soon make
A retest of the rising support
Line and as we are bullish
Biased we will be expecting
A local bullish correction
Buy!
Comment and subscribe to help us grow!
Check out other forecasts below too!
Disclosure: I am part of Trade Nation's Influencer program and receive a monthly fee for using their TradingView charts in my analysis.
Edge of the Wedge || GBPJPY
Simply Breakout and retest of the Edge of the Wedge
Entry: 198
Tp1: 200
TP2: 202
TP3: 204
SL: 196
A classic trend following setup

GBP_JPY RISING SUPPORT|LONG|
✅GBP_JPY is trading along the rising support
And as the pair will soon retest it
I am expecting the price to go up
To retest the supply levels above at 195.733
LONG🚀
✅Like and subscribe to never miss a new idea!✅
Disclosure: I am part of Trade Nation's Influencer program and receive a monthly fee for using their TradingView charts in my analysis.

GBP_JPY LOCAL SHORT|
✅GBP_JPY has been growing recently
And the pair seems locally overbought
So as the pair is approaching a horizontal resistance of 196.400
Price decline is to be expected
SHORT🔥
✅Like and subscribe to never miss a new idea!✅
Disclosure: I am part of Trade Nation's Influencer program and receive a monthly fee for using their TradingView charts in my analysis.

GBPJPY Strong rebound. Buy opportunity.The GBPJPY pair has been trading within an Ascending Triangle pattern. Today's geopolitics made the price form its latest Higher Low at the bottom of the pattern, which also coincided with a 4H MA200 (orange trend-line) test, and rebounded.
That was a clear buy signal on the 4H RSI Support that signaled the last three bottom buys. Our Target is the top of the pattern at 196.300.
-------------------------------------------------------------------------------
** Please LIKE 👍, FOLLOW ✅, SHARE 🙌 and COMMENT ✍ if you enjoy this idea! Also share your ideas and charts in the comments section below! This is best way to keep it relevant, support us, keep the content here free and allow the idea to reach as many people as possible. **
-------------------------------------------------------------------------------
Disclosure: I am part of Trade Nation's Influencer program and receive a monthly fee for using their TradingView charts in my analysis.
💸💸💸💸💸💸
👇 👇 👇 👇 👇 👇

GBP-JPY Free Signal! Sell!
Hello,Traders!
GBP-JPY made a retest of
The strong horizontal resistance
Of 196.260 and the pair seems
To be locally overbought
So we will go short with
The Take Profit of 195.525
And the Stop Loss of 196.455
Sell!
Comment and subscribe to help us grow!
Check out other forecasts below too!
Disclosure: I am part of Trade Nation's Influencer program and receive a monthly fee for using their TradingView charts in my analysis.

GBP_JPY WILL FALL|SHORT|
✅GBP_JPY went up sharply
But a strong resistance level was hit at 196.400
Thus I am expecting a pullback
And a move down towards the target of 195.671
SHORT🔥
✅Like and subscribe to never miss a new idea!✅
Disclosure: I am part of Trade Nation's Influencer program and receive a monthly fee for using their TradingView charts in my analysis.

GBPJPY OUTLOOKWe saw price took a shift which validated a bull structure while gathering up liquidity. Now price is currently moving sideways which shows buyers are lagging. I see sellers coming in here once support gets broken. I will be hoping in for a sell after the breakout at the nearest order block.

GBP-JPY Growth Ahead! Buy!
Hello,Traders!
GBP-JPY is trading in an
Uptrend along the rising
Support line and the pair
Will soon retest is to we
Will be expecting a rebound
And a bullish move up on Monday
Buy!
Comment and subscribe to help us grow!
Check out other forecasts below too!
Disclosure: I am part of Trade Nation's Influencer program and receive a monthly fee for using their TradingView charts in my analysis.

GBP_JPY RISING SUPPORT|LONG|
✅GBP_JPY is trading along the rising support
And as the pair will soon retest it
I am expecting the price to go up
To retest the supply levels above at 194.500
LONG🚀
✅Like and subscribe to never miss a new idea!✅
Disclosure: I am part of Trade Nation's Influencer program and receive a monthly fee for using their TradingView charts in my analysis.

GBP-JPY Resistance Cluster! Sell!
Hello,Traders!
GBP-JPY made a retest
Of the resistance cluster
Of the rising and horizontal
Resistance lines around 193.989
And we are already seeing a
Bearish reaction so we will be
Expecting a further bearish
Move down
Sell!
Comment and subscribe to help us grow!
Check out other forecasts below too!
Disclosure: I am part of Trade Nation's Influencer program and receive a monthly fee for using their TradingView charts in my analysis.

GBPJPY - Bullish Breakout Likely
The GBP/JPY 4-hour chart shows a strong bullish trend that propelled the pair from 190.50 support in early May to peaks near 196.50, followed by a healthy consolidation phase around the 192.00-194.00 range. This sideways price action has allowed momentum to reset while maintaining the underlying upward structure, with the pair successfully holding above key support at 192.00. The current positioning near the upper boundary of the consolidation range, combined with signs of renewed buying interest, suggests the correction is nearing completion. The technical setup favors a bullish breakout, with the higher probability scenario pointing toward a resumption of the uptrend targeting the previous high around 196.50 and potentially extending toward the 197.00 resistance zone.
Disclosure: I am part of Trade Nation's Influencer program and receive a monthly fee for using their TradingView charts in my analysis.

GBPJPY Channel Down making a Lower High rejectionThe GBPJPY pair rose aggressively since the last time we gave our buy signal (April 11, see chart below), quickly hitting our conservative 109.250 Target:
The price has since made a Lower High rejection at the top of the Channel Down but remains supported by the 1D MA50 (blue trend-line). Once broken and it closes a 1D candle below it, we will have bearish break-out signal. Our Targe will be 185.250, which will be the standard -5.85% decline that all 3 previous Bearish Legs had within the Channel Down.
-------------------------------------------------------------------------------
** Please LIKE 👍, FOLLOW ✅, SHARE 🙌 and COMMENT ✍ if you enjoy this idea! Also share your ideas and charts in the comments section below! This is best way to keep it relevant, support us, keep the content here free and allow the idea to reach as many people as possible. **
-------------------------------------------------------------------------------
💸💸💸💸💸💸
👇 👇 👇 👇 👇 👇

GBPJPY Signal : 1H / 4H Beautiful buy !!!Hello Traders! 👋
What are your thoughts on GBPJPY ?
Symbol : GBPJPY H1
Market price : 193.20
BUY limit : 192.40 - 192.00
Tp1 :193.40
Tp2 : 194.60
Tp3 : 196.40
Tp4 : 199.60
Sl : 190.80
Don’t forget to like and share your thoughts in the comments! ❤️
Remember this is a position that was found by me and it is a personal idea not a financial advice, you are responsible for your loss and gain.

GBP_JPY GROWTH AHEAD|LONG|
✅GBP_JPY is going down now
But a strong support level is ahead
Thus I am expecting a rebound
And a move up towards the target above 194.000
LONG🚀
✅Like and subscribe to never miss a new idea!✅
Disclosure: I am part of Trade Nation's Influencer program and receive a monthly fee for using their TradingView charts in my analysis.

GBP-JPY Long From Rising Support! Buy!
Hello,Traders!
GBP-JPY is trading along
The rising support line
And the pair will soon hit
A trend-line from where we
Will be expecting a local
Bullish rebound and a
Further bullish move up
Buy!
Comment and subscribe to help us grow!
Check out other forecasts below too!
Disclosure: I am part of Trade Nation's Influencer program and receive a monthly fee for using their TradingView charts in my analysis.

GBP-JPY Free Signal! Sell!
Hello,Traders!
GBP-JPY is trading in an
Uptrend and the pair is once
Again about to retest a horizontal
Resistance level of 193.665
So despite our bullish bias
We will enter a local short trade
On Monday with the Take Profit
Of 192.946 and the Stop Loss
Of 193.799 which is slightly
Above the upper bound of
The wide supply area
Sell!
Comment and subscribe to help us grow!
Check out other forecasts below too!
Disclosure: I am part of Trade Nation's Influencer program and receive a monthly fee for using their TradingView charts in my analysis.

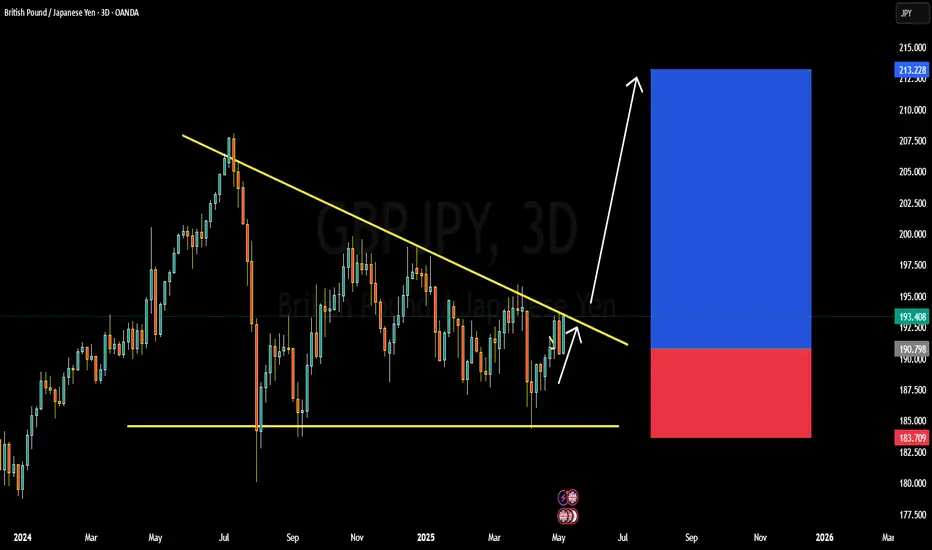
GBPJPY BULLISH OR BEARISH DETAILED ANALYSISGBPJPY is currently trading near 190.80 and is forming a significant breakout structure on the 3-day chart. After months of consolidation under a descending trendline, the pair is now coiling tightly, signaling a potential bullish breakout. The pair has respected the lower support range near 183.70 while pushing up against descending resistance multiple times. This squeeze pattern often precedes a major directional move, and with bullish momentum building, GBPJPY could be primed for a rally toward the 210.00 zone.
Fundamentally, the British pound is finding strong support from the latest hawkish commentary by the Bank of England, which has hinted that inflation remains sticky, keeping rate cut expectations delayed. On the other hand, the Japanese yen remains under consistent pressure due to the Bank of Japan's ultra-dovish stance and yield curve control policies. The BoJ’s reluctance to shift its policy outlook, coupled with soft macro data from Japan, is weakening the yen across the board.
Technically, a breakout and close above the descending trendline around 194.00 will be a key confirmation point. If this happens, bulls could dominate and push GBPJPY toward the 210.00 resistance zone in the medium term. The R\:R on this setup remains favorable with stops safely tucked below 183.70, giving this trade strong upside potential.
This pair is currently one of my top watchlist setups for May as both the technical and fundamental landscapes align. With bullish sentiment driving GBP strength and JPY weakness being a prevailing macro theme, GBPJPY could deliver a powerful upside continuation if the breakout confirms.
GBP/JPY Potential Bullish ContinuationPound/Yen price seems to exhibit signs of potential bullish momentum as the price action may form a credible Higher Low on key Fibonacci and Support levels.
Trade Plan :
Entry @ 191.37
Stop Loss @ 189
TP 0.9 - 1 @ 193.499

GBPJPY: Entering the most optimal medium-term Sell Zone.The GBPJPY pair is bullish on its 1D technical outlook (RSI = 59.237, MACD = 0.300, ADX = 16.909) as it is expanding the bullish wave of the 6 month Channel Down. The two prior peaked on the 0.786 and 0.9 Fibonacci retracement level respectively. This bullish wave has already reached the 0.786 Fib, so it has entered the most optimal Sell Zone for the medium term. Even if it peaks on the 0.9 Fib, a -5.90% bearish wave (similar with the 3 prior) would test 183.500.
See how our prior idea has worked out:
## If you like our free content follow our profile to get more daily ideas. ##
## Comments and likes are greatly appreciated. ##

GBP-JPY Potential Short! Sell!
Hello,Traders!
GBP-JPY keeps growing
From the lows just as we
Expected but the pair will
Soon hit a horizontal resistance
Of 192.500 and from there
A local bearish pullback
It likely to follow
Sell!
Comment and subscribe to help us grow!
Check out other forecasts below too!
Disclosure: I am part of Trade Nation's Influencer program and receive a monthly fee for using their TradingView charts in my analysis.

GBP_JPY BEARISH BIAS|SHORT|
✅GBP_JPY has been growing recently
And the pair seems locally overbought
So as the pair is approaching a horizontal resistance of
Price decline is to be expected
SHORT🔥
✅Like and subscribe to never miss a new idea!✅
Disclosure: I am part of Trade Nation's Influencer program and receive a monthly fee for using their TradingView charts in my analysis.
