USDJPY 1H - market buy with a confirmed structureThe price has bounced from a key support zone and is showing early signs of recovery. A clear base has formed, and the MA50 is starting to turn upward, indicating a shift in short-term momentum. While the MA200 remains above the price, the overall structure suggests a potential continuation of the bullish move.
Trade #1 — entry at market, target: 145.939, stop below recent local low.
Trade #2 — entry after breakout and retest of 145.939, target: 148.000, stop below the retest zone.
Volume has stabilized, and the reaction from support is clear. As long as price holds above the last swing low, buying remains the preferred strategy.
#usdjpy#forex

USDJPY – A Bull Trap in the Making?USDJPY has just broken above the descending trendline but stalled right at the confluence resistance near 147.100 – a former strong distribution zone. Although buyers have pushed the price higher, the current price structure is sketching a potential double top pattern, signaling a possible exhaustion of the bullish momentum.
If this pattern confirms and price breaks below the FVG support zone around 145.161, then 144.300 will likely be the next target – a level that previously halted price before the recent rally. Price action should be closely monitored here, as a breakdown below 145.161 could be an early reversal signal.
Disappointing Nonfarm data has pushed bond yields lower and weakened the USD, reinforcing expectations of an earlier Fed rate cut. If this week’s CPI also comes in lower than expected, USDJPY could sharply drop from the current top.

USD/JPY loses bulk of NFP-related gainsThe USD/JPY has given back a bulk of yesterday's NFP-driven gains. Although the data was not as strong as the headlines suggested, the fact that we saw decent moves in bond and equity markets suggests investors were overall impressed by the figures. So it seems the market is preparing itself for some more tariff-related volatility as we approach the 9 July deadline, when 'Liberation Day' tariffs will revert. Trump has suggested letters are being sent out to trading partners over the next few days, informing them of their new tariff rate. If you recall, during the worst of April's volatility, the likes of the franc, euro and yen were all outperforming. Could we see a similar pattern this time?
Well, looking at the USD/JPY, traders have certainly sold into yesterday's rally. But we need a more decisive breakdown of support between 140.00-140.25 now to trigger some long side liquidation. Below this area, key support comes in around 142.50. Resistance comes in at 145.00, followed by 146.00.
By Fawad Razaqzada, market analyst with FOREX.com

USDJPY: Bearish Trend Remains in ControlUSDJPY continues to follow a clear downtrend on the H4 chart, respecting a descending trendline and forming consistent lower highs. The strong rejection at 144.800 and the presence of multiple FVGs further reinforce the bearish structure.
Price is currently retracing to test the FVG zone. If rejection occurs here, the downtrend could resume towards the 141.900 support level.
Trade Setup:
Sell near 144.700
TP: 141.900
SL: above 145.300
Supporting News:
"Risk-on" sentiment is back after strong manufacturing data from China and rising expectations that U.S. interest rates may soon peak, weakening the USD against the JPY.
Are you watching for a short setup like I am?

USDJPY – Uptrend Still Intact, But Waiting for a BounceUSDJPY is currently pulling back toward the key support zone at 142.244 after being rejected from the 148.000 resistance area. This recent drop reflects strong selling pressure from the dense FVG zones near Resistance 2.
However, the overall structure remains bullish, with a series of higher highs and higher lows still intact. The current support zone is crucial—if it holds, USDJPY could rebound toward 145.800 and potentially retest the 148.000 level.
On the news front:
– A fragile ceasefire between Iran and Israel has improved global risk sentiment, reducing demand for USD as a safe haven.
– The Bank of Japan kept interest rates unchanged and signaled caution in reducing bond purchases—supporting the yen, but not enough to reverse the dollar's edge.
– The wide interest rate differential still favors the USD.
Strategy: Watch for bullish confirmation at 142.244. If buyers step in clearly, it may present a long opportunity in line with the dominant uptrend.

Traders, it's time to pay close attention! 🚨 USDJPY 4H Setup Alert – High-Probability Play Unfolding! 🚨
Traders, it's time to pay close attention! 🧠📊
The USDJPY pair has just perfectly tapped into a key bullish Fair Value Gap (FVG) on the 4-hour chart — a classic move in the smart money playbook. What’s more? We've just seen a clean sweep of internal range liquidity (IRL) — a textbook liquidity grab that signals potential accumulation by larger players. 💥💼
This is not just noise — it's a significant signal. The market structure is hinting at a possible shift in momentum, and bullish pressure is building. The trap has been set, the weak hands have been shaken out, and smart money may be preparing for a strong upward push. 📈🐂
🔮 What’s the next move?
All eyes are now on the external range liquidity (ERL) — a prime liquidity pool sitting above current price levels. If price accelerates toward it, this zone could act as the magnet and the catalyst for the next explosive move upward. 🚀
🔥 Key Points to Watch:
Bullish FVG reaction ✅
IRL liquidity swept ✅
Bullish market structure forming 🏗️
ERL liquidity resting overhead — potential target 🎯
Volume profile & order flow confirming accumulation? 👀
⚠️ Stay alert and don’t chase — let the setup come to you.
Smart money might already be stepping in, and if this momentum follows through, we could be witnessing the beginning of a strong leg up.
Mark your charts and monitor closely — opportunity is knocking. 📍🕵️♂️

USDJPY Strong support formed. Excellent buy opportunity.The USDJPY pair is trading within a Channel Down since the start of the year but following the April 22 Low, it has been rising on Higher Lows. Today that trend-line was tested and again produced a rebound (so far).
Since the April 22 Low was very close to the 139.600 Support (from the September 16 2024 Low), there are higher probabilities that we will have a trend change to bullish, at least for the medium-term.
The natural Resistance now is the 1D MA200 (orange trend-line), so we will target just below it at 148.675 (Resistance 1).
-------------------------------------------------------------------------------
** Please LIKE 👍, FOLLOW ✅, SHARE 🙌 and COMMENT ✍ if you enjoy this idea! Also share your ideas and charts in the comments section below! This is best way to keep it relevant, support us, keep the content here free and allow the idea to reach as many people as possible. **
-------------------------------------------------------------------------------
Disclosure: I am part of Trade Nation's Influencer program and receive a monthly fee for using their TradingView charts in my analysis.
💸💸💸💸💸💸
👇 👇 👇 👇 👇 👇

USDJPY: Bottom formation successful. Strong buy.USDJPY is neutral on its 1D technical outlook (RSI = 46.191, MACD = -0.020, ADX = 12.744) as it is consolidating around the 1D MA50. This is the bottom formation process straight after rebounding on the S1 Zone. The wider pattern is a Descending Triangle and the bottom formation suggests that the new bullish wave is about to be initiated. Go long and target the 0.618 Fibonacci level (TP = 153.500).
## If you like our free content follow our profile to get more daily ideas. ##
## Comments and likes are greatly appreciated. ##

USD/JPY bounces off trend but risks tilted to downsideWith equity markets well off their earlier lows, the USD/JPY is also bouncing back, although it is not out of the woods yet with risks remaining tilted to the downside amid signs of weak inflation data and Trump's tariff threats.
Technically, the USD/JPY has been in consolidation mode, but a potential break of the trend line could trigger a sharp drop towards 142.00 and then 140.00.
For now, the trend line is providing support, but with the dollar slumping against other currencies, the USDJPY could also take a tumble should we see renewed weakness in stocks.
Resistance comes in at around 144.00.
By Fawad Razaqzada, market analyst with FOREX.com

USD/JPY – Short-term bullish structure within a larger downtrendThe USD/JPY pair has been in a well-established downtrend on the daily timeframe, showing consistent weakness over recent weeks.
Daily timeframe
The pair recently bounced from a significant and well-respected support zone around the $140.00 level. This area has historically provided a strong base for price, and once again, it appears to be holding as reliable support. Although the overall daily trend remains bearish, this bounce introduces the potential for a short-term retracement or consolidation phase.
Clear Rising Trendline on the 4H Chart
Zooming into the 4-hour timeframe, the price action shows a notable shift in momentum. A clear rising trendline has formed, acting as a dynamic support level and guiding the pair higher in the short term. As long as this trendline remains intact and unbroken, the bullish bias on the 4H remains valid. This upward move suggests a corrective phase within the broader daily downtrend, supported by increasing demand at higher lows.
Approaching Key Resistance — FVG and 0.786 Fibonacci Level
The pair is currently approaching a key resistance area near the $145.50 level. This zone aligns with the 4-hour Fair Value Gap (FVG) left by the previous strong downward move and coincides with the 0.786 Fibonacci retracement level, measured from the most recent swing high to swing low. A few days ago, price action briefly tested the lower boundary of this FVG but failed to fully fill the imbalance. Given the current momentum, another attempt to fill the entire FVG and test the 0.786 Fibonacci level is likely. This confluence of technical factors creates a strong resistance zone that could trigger significant price reactions, potentially resuming the broader downtrend.
Target Levels — Where to Look for Reversal or Profit-Taking
A sensible short-term target would be the previous lower high around the $144.00 level. This zone may serve as an initial resistance or take-profit area before price challenges the $145.50 resistance region. Additionally, if the pair breaks below the rising trendline on the 4H, this $144.00 zone could become a support level from which the pair might attempt another move higher.
Conclusion
To summarize, the USD/JPY pair remains in a broader daily downtrend but has shown signs of short-term strength after bouncing from the $140.00 support zone. On the 4-hour timeframe, bullish momentum is evident, supported by a rising trendline and upward movement toward a significant resistance area. Traders should closely watch the $145.50 zone, as it represents a confluence of the FVG and 0.786 Fibonacci retracement — both of which could act as a strong ceiling for price. Until the rising trendline breaks, the short-term outlook remains cautiously bullish, but the medium-term bias leans bearish if resistance holds and selling pressure resumes.
Disclosure: I am part of Trade Nation's Influencer program and receive a monthly fee for using their TradingView charts in my analysis.
Thanks for your support.
- Make sure to follow me so you don't miss out on the next analysis!
- Drop a like and leave a comment!

USD/JPY holds key support ahead of US dataThe USD/JPY direction has turned somewhat bullish in recent days as improving risk appetite and optimism over US-China trade talks lifted the dollar and pressurized the safe-haven yen.
The pair held firm above key support at 142.50, with sentiment-driven flows favoring the greenback. This week’s focus shifts to key US data releases—CPI on Wednesday and UoM Consumer Sentiment on Friday—which could influence Fed policy expectations and the USD’s trajectory.
A stronger dollar, supported by macro data and fading trade tensions, may push USD/JPY higher, especially as global equities rally and investor confidence improves.
Short-term resistance is seen around the 145.00 handle. The next upside targets are at 146.00, and then 148.00.
All bullish bets would be off, however, should support at 142.50 give way eventually. At the time of writing price was testing interim support around 144.00.
By Fawad Razaqzada, market analyst with FOREX.com

USD/JPY back at neckline as soft US data narrows yield spreadToday's soft US data releases weighed on US yields, which helped to further narrow the US-Japan spreads on the long dated bond yields. In turn, the USD/JPY gave up its entire gains from the day before when it was boosted by the JOLTS data. Next move could be defendant on the nonfarm payrolls report on Friday.
From a technical point of view, this is text book stuff. Price is testing a key area of support at the time of writing, between 142.00 to 142.70, as marked in grey on the chart. This zone has provided strong support on multiple occasions, preventing rates from sliding towards 140.00 zone. Now the more a level or an area is tested, the more likely it will break down. Will we see a break here in the next few days? Or will support continue to hold, as improving risk appetite gives US dollar some breathing space?
Well, the pair is down quite a lot on the session, so i wouldn't rule out a bounce here heading into US close. But the trend direction is clear: bearish.
By Fawad Razaqzada, market analyst with FOREX.com

USD/JPY takes fresh dip on renewed trade uncertaintyThanks to ongoing trade uncertainty and troubles in the bond market, the USD/JPY looks like is going to end the week on a negative note, after coming down sharply in the last day and a half, which means the weekly gains have more than halved.
The US dollar had actually clawed back a bit of ground in early Friday trading after taking a hit the day before. The rebound came despite fresh drama around Donald Trump’s tariff policies, which—unsurprisingly—are once again stirring the pot. A federal appeals court gave the president a temporary lifeline, pausing a ruling that could have derailed much of his economic agenda.
The White House team wasted no time doubling down: Trump, they insist, isn’t backing off. Tariffs are sticking around. But the mood got murkier when Treasury Secretary Scott Bessent admitted that US-China trade talks are “a bit stalled.” Then came Trump’s latest post on Truth Social, where he accused China of “totally violating” the trade deal with the US.
Markets didn’t take it well. US indices dipped, USD/JPY slid, and even the euro managed to push the dollar back a touch.
As well as well as trade uncertainty eyes will turn to incoming US data next week, among them the monthly jobs report on Friday.
The US jobs report is always important as it could impact the Fed’s future policy decisions. Traders will want to see whether the trade war uncertainty is negatively impacting the jobs market too, after several macro data, including consumption data in GDP report and consumer sentiment surveys, have come out weaker in recent weeks. JOLTS jobs data and ISM PMIs are also due out earlier in the week.
The US dollar has been under pressure in the last three months or so, with the euro performing admirably during this time despite US tariffs.
With the US recently losing its final top-tier credit rating at the hands of Moody’s a couple of weeks ago, investors are worried that debt concerns and government spending will push yields even higher and thus they are shorting Treasuries and the dollar, buying foreign currencies, including the euro. This makes the EUR/USD outlook remain fairly resilient around the 1.12-1.15 range.
By Fawad Razaqzada, market analyst with FOREX.com

USDJPY - Predictive Analysis & Forecasting USDJPY
Scales
- S: pending 149.964 activation
- M: nears cycle completion from 140.648 to 148.52-149.53 target range
- L: 142.67 activation triggered 149.21 pivot
Forecast & Targets
- ST: limited upside to 149.96 max
- MT: bearish to 143.09 min, 138.29 max
#USDJPY #Forex #CROW2.0
4xForecaster
------
Originally published in BlueSky

USDJPY – Supportive news, price may break resistance soonUSDJPY is supported by positive U.S. economic data, as the PCE index remains elevated—reinforcing expectations that the Fed will keep interest rates higher for longer. This has boosted bond yields and the USD, driving USDJPY upward.
On the H3 technical chart, USDJPY has rebounded from the support zone around 143.680. Both the EMA 34 and EMA 89 lie below the price, reinforcing the recovery momentum. The pair is now expected to approach the 146.000 resistance area—where it intersects with the long-term descending trendline that has rejected price at least twice before.
If buying pressure holds and 146.000 is decisively broken, a short-term bullish trend will likely be confirmed. However, another rejection could lead to a retest of the previous support zone. Overall, the current trend slightly favors the buyers.

USDJPY – Rejected at 146.00, downside risk growsUSDJPY reacted strongly at the 146.00 resistance area – a level where price was previously rejected. After a sharp rally, the pair has turned lower and is now heading toward the 144.00 support zone, which aligns with the EMA 34–89 on the H3 chart.
The chart shows a small double top pattern forming around the recent highs. If USDJPY continues to struggle below 146.00 and breaks through the 144.00 support, a short-term downtrend may be confirmed, with the next target around 142.50.
On the news side: The Japanese Yen is gaining some ground again after the BOJ signaled readiness to adjust its easing policy if inflation consistently exceeds its target. Meanwhile, the USD is under pressure as expectations grow that the Fed may keep interest rates steady in the upcoming meeting, due to cooler consumer data.
Suggested strategy: Consider selling if bearish signals appear around the 145.80–146.00 area, with a short-term target at 144.00.

USD/JPY key levels to watch after powerful rallyThe USD/JPY has rallied decisively today, aided by the shift in Japanese bond sentiment.
The pair has broken several short-term levels and moving averages. At the time of writing, it was trading bang in the middle of the 144.00 -144.80 resistance area, formerly support. We also have the 21-day exponential moving average residing here.
As things stand, the next key upside target for the USD/JPY is now positioned near the 145 mark. Should price approach or breach it, we might begin to see growing confidence among longer-term bulls.
On the downside, key support is seen around the 142.50 level. Bearish below towards 140.00 next.
By Fawad Razaqzada, market analyst with FOREX.com

Downtrend Awaiting ConfirmationUSDJPY has just made a technical rebound from the support zone at 142.22 up to the resistance area around 144.60 — a confluence with both the EMA 34 and EMA 89. However, based on the chart, this zone has previously acted as a reversal point, and price is now retesting that same level of rejection.
The current price action suggests a high likelihood of a small double-top pattern forming around 144.60. If selling pressure re-emerges here, the market could reverse and head back down toward 142.22, aligning with the developing downtrend.
Moody’s recent warning on U.S. credit rating has placed pressure on the USD, while the JPY continues to hold its safe-haven appeal amid market uncertainty.

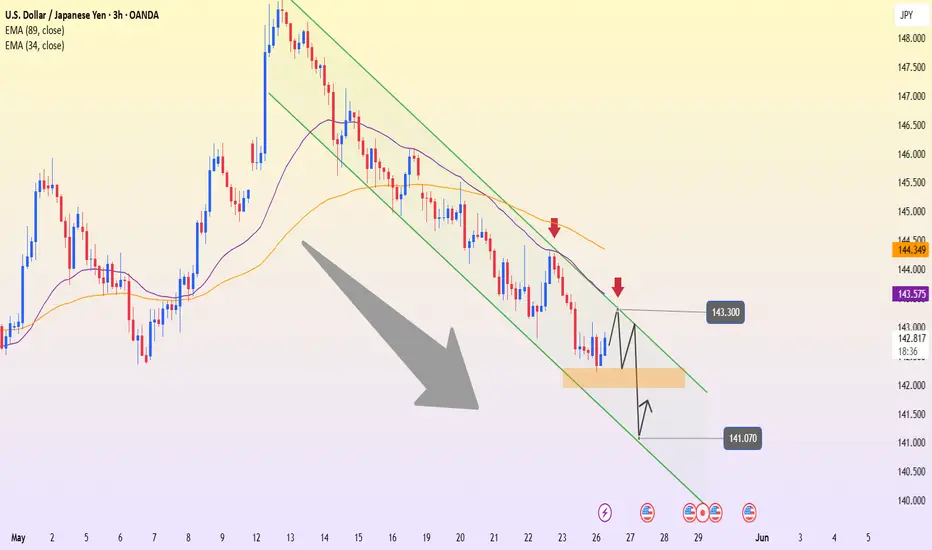
USDJPY – Bearish Channel Holds, Eyes on Support BreakUSDJPY is currently trading within a clearly defined bearish channel on the 3H timeframe, consistently forming lower highs and lower lows. After a slight bounce from the 142.50 support zone, the price is now heading toward the 143.30 resistance area — which aligns with the upper boundary of the channel. This is a zone likely to face rejection and renewed selling pressure.
On the news front, Moody’s recently downgraded the U.S. credit rating due to concerns over prolonged budget deficits, putting pressure on the USD. Although the interest rate gap between the Fed and the BoJ still favors the dollar, current market sentiment is making it harder for USDJPY to maintain a strong rally.
If the 143.30 resistance holds, the price is likely to be pushed back down to retest the 141.07 support zone — a previous low and the lower boundary of the descending channel. A confirmed break below this level would signal further downside, with the next target below the 140.00 mark.
USD-JPY Free Signal For Monday! Buy!
Hello,Traders!
USD-JPY is about to retest
A horizontal support level
Around 142.000 and after
The retest on Monday we
Will be able to go long on
The pair with the Take
Profit of 143.331 and the
Stop Loss of 141.939
Buy!
Comment and subscribe to help us grow!
Check out other forecasts below too!
Disclosure: I am part of Trade Nation's Influencer program and receive a monthly fee for using their TradingView charts in my analysis.

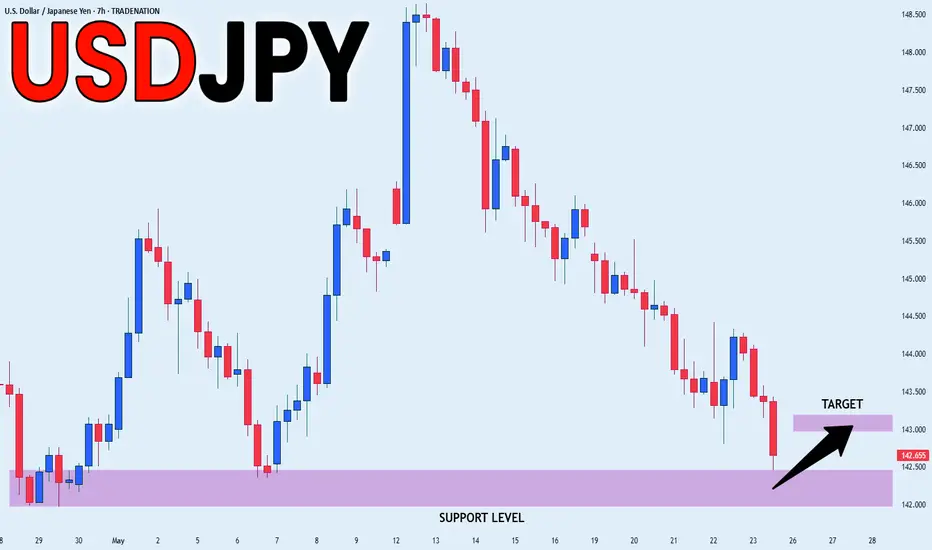
USD_JPY SUPPORT AHEAD|LONG|
✅USD_JPY is going down now
But a strong support level is ahead at 142.000
Thus I am expecting a rebound
And a move up towards the target of 143.000
LONG🚀
✅Like and subscribe to never miss a new idea!✅
Disclosure: I am part of Trade Nation's Influencer program and receive a monthly fee for using their TradingView charts in my analysis.
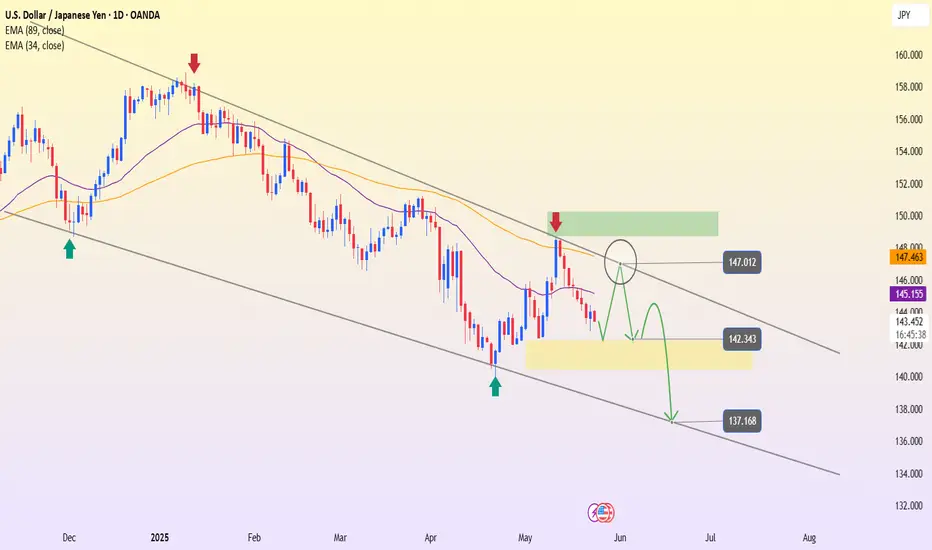
USDJPY – The downtrend continues, channel still leads the wayLooking at the D1 chart, USDJPY remains firmly within the descending channel that has persisted since the end of 2024. Every time the price approaches the upper boundary of the channel, selling pressure reappears – and the recent touch around the 147.012 area is no exception.
After being rejected at this strong resistance zone, the price has turned lower and is now forming a pullback structure within the prevailing trend. EMA34 and EMA89 continue to slope downward, reinforcing the bearish momentum.
If the price gets rejected again around the 145–146 region, the correction pattern may complete, opening up room for a drop toward the support zone at 142.343, or even deeper toward the channel bottom near 137.168.
In summary, the primary trend remains bearish – and the preferred strategy now is "sell on rally" when the price nears the upper resistance of the channel. Patience and watching for price action will be key.
USDJPY Bullish Breakout Setup – Retest at Key Demand ZoneUSDJPY is respecting a clean bullish structure after rebounding from the 140.100 base. Price made a higher high near 148.650, followed by a pullback into the previous demand zone around 145.000.
Technical Breakdown:
Market Structure: Higher highs and higher lows indicate a strong uptrend.
Demand Zone: Clean reaction from the 145.000 zone, which previously acted as resistance-turned-support.
Target Zones:
First TP: 147.900 (previous swing high)
Final TP: 150.600 (key resistance level)
Invalidation Level : Close below 144.800 could invalidate this bullish scenario.
If price sustains above 145.000, the bullish trend is likely to continue.
As always, manage risk carefully.
Like & Follow for more clean, high-timeframe breakdowns!
