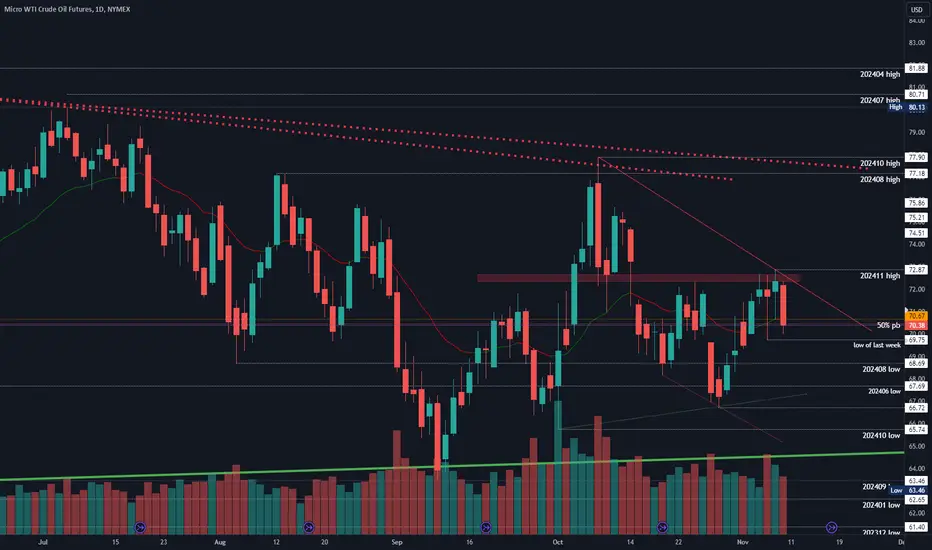
WTI OIL Massive rejection on the 1D MA200.WTI Oil (USOIL) has been trading within a Channel Down for over a year now and today its latest Bullish Leg hit the 1D MA200 (orange trend-line) for the first time since February 03 2025.
Unless we see a sustainable structured rise that turns it into a Support, the long-term bearish trend should prevail, and the market has already reacted to this with a strong rejection.
With the 1D RSI almost overbought (>70.00), being consistent with the last 3 major tops, we expect a gradual decline towards Support 1, as it happened on the January - February 2025 Bearish Leg.
Our Target is just above it at $55.50.
-------------------------------------------------------------------------------
** Please LIKE 👍, FOLLOW ✅, SHARE 🙌 and COMMENT ✍ if you enjoy this idea! Also share your ideas and charts in the comments section below! This is best way to keep it relevant, support us, keep the content here free and allow the idea to reach as many people as possible. **
-------------------------------------------------------------------------------
💸💸💸💸💸💸
👇 👇 👇 👇 👇 👇
#wti#crude#oil

WTI Crude Oil Stalls At Technical JunctureCrude oil has enjoyed a decent rally in recent weeks thanks to improved sentiment and OPEC+ scaling back production. Yet momentum turned against bulls on Tuesday, despite positive trade talks between the US and China. Today I discuss whether this could be a turning point for oil, or simply a bump in the road.
Matt Simpson, Market Analyst at City Index and Forex.com

WTI Crude Oil Testing Make-or-Break Support ZoneWTI crude is grinding into a pivotal horizontal support near 6,020 after another sharp rejection near the 50-day SMA:
Support at Risk: Price is pressing into the horizontal support zone formed by May’s lows (~6,020). A clean break below would shift momentum back decisively to the downside.
Bearish Structure: Price remains well below both the 50- and 200-day SMAs, which are angled downward—consistent with a medium-term downtrend.
Momentum Fading: MACD is negative and turning lower again, while RSI is stuck near 45 and showing no bullish divergence.
Next Support: If support fails, next downside level is likely around the YTD low near 5,400.
As it stands, bears remain in control unless bulls can defend this floor and drive a breakout back above the 50-day SMA.
-MW

WTI CRUDE OIL: Short term rebound on RSI Bullish DivergenceWTI Crude Oil is bearish on its 1D technical outlook (RSI = 38.958, MACD = -2.110, ADX = 28.985) as it remains on a multi-month Low. The 1D RSI however displays a HL Bullish Divergence and this can cause a short term price rebound. The Resistance is the Pivot Zone and short term the LH trendline is what maintains the downtrend. Consequently, we are now bullish, TP = 64.90.
## If you like our free content follow our profile to get more daily ideas. ##
## Comments and likes are greatly appreciated. ##

WTI CRUDE OIL: Channel Down bottomed. Buy opportunity.WTI Crude Oil is heavily bearish on its 1D technical outlook (RSI = 38.039, MACD = -2.310, ADX = 38.046) as it is trading inside a Channel Down for more than 1 year. Last week's low has made a technical LL at the bottom of the pattern and the current consolidation indicates that this may be an attempt to initiate the new bullish wave. The 1D RSI recovered from being oversold previously and this potentially hints to a rebound over the 1D MA200. The last bullish wave crossed above the 0.618 Fibonacci marginally. Trade: long, TP = 71.00.
## If you like our free content follow our profile to get more daily ideas. ##
## Comments and likes are greatly appreciated. ##

WTI CRUDE OIL: Potential bottom and massive rebound to 71.00.WTI Crude Oil got oversold on its 1D technical outlook (RSI = 31.096, MACD = -1.620, ADX = 38.232) but is recovering its 1W candle now as it hit the bottom (LL) of the 1 year Channel Down. If the 1W candle makes a green closing, we will consider this a bottom, as the 1W RSI is also on its LL trendline) and go for a long aimed as the previous one at the 0.618 Fibonacci (TP = 71.00).
## If you like our free content follow our profile to get more daily ideas. ##
## Comments and likes are greatly appreciated. ##

WTI crude oil shows the potential for a bounceThis is a bit of a scrappy chart, but I still see the potential for a cheeky bounce.
WTI crude oil is trying to snap a 4-week losing streak, by stalling around a 50% retracement level. Last week's candle was an inverted hammer, and the previous two weeks have both closed above the 50% level.
A bullish divergence formed on the daily RSI (2) ahead price action finding support at the 200-day SMA and 200-day EMA.
From here, the bias remains bullish while prices hold above last week's low. Bulls could seek dips towards the 200-day MAs, with a near-term upside target of $72. A break above which brings $74 into focus, near the monthly pivot point.
Matt Simpson, Market Analyst at City Index and Forex.com

WTI selloff stalls around cluster of big levelsWTI crude has seen a 11% correction from its January high, and 11 of the past 13 days since the high have been down days. But there is a glimmer of hope for bulls as prices are holding above several key levels of support, just above the $70 handle.
Tuesday's bullish pinbar held above respected the 200-day EMA and 50% retracement levels, while respecting the 200 and 50-day EMAs. It also saw a minor (and ultimately false) break of the $71 handle and November high.
While Wednesday was a down day, it was also an inside day. And this suggests a hesitancy to break immediately lower with demand around $71.
This may be on the scrappy side, but bulls could consider longs around the current lows and seek a rebound to either Wednesday's high, just beneath the $73. Though a higher target could be considered should a fundamentally bullish catalyst arrive.
The bias remains bullish above $70, but $70.49 could also be used to improve the reward-to-risk ratio.
Matt Simpson, Market Analyst at City Index

WTI CRUDE OIL: Rebound to 75.50 very probable.WTI Crude Oil is bearish on its 1D technical outlook (RSI = 40.837, MACD = 0.030, ADX = 37.618) which is natural as it's trading inside a Channel Down. The pattern formed a 4H Death Cross yesterday and even though it's technically bearish, the last time it was formed (October 24th 2024), it marked a bottom 4 days later. The bottom was formed on a HL trendline and if it gets repeated, we should see a HL rebound soon. As with November's rebound, we will be targeting the 0.5 Fibonacci level (TP = 75.50).
## If you like our free content follow our profile to get more daily ideas. ##
## Comments and likes are greatly appreciated. ##

WTI CRUDE OIL: Buy opportunity on the bottom trendline.WTI Crude Oil remains bullish on its 1D technical outlook (RSI = 58.480, MACD = 1.830, ADX = 66.542) despite the 4 day selling streak, which pushed the price under the 4H MA50. The HL trendline is still intact though, so technically that is a sound buy opportunity, especially if the 1D RSI hits the 30.000 oversold level. We're bullish (TP = 86.00).
## If you like our free content follow our profile to get more daily ideas. ##
## Comments and likes are greatly appreciated. ##

CRUDE OIL CORRECTION AHEAD|SHORT|
✅CRUDE OIL is about to retest a key structure level of 80.14$
Which implies a high likelihood of a move down
As some market participants will be taking profit from long positions
While others will find this price level to be good for selling
So as usual we will have a chance to ride the wave of a bearish correction
SHORT🔥
✅Like and subscribe to never miss a new idea!✅

WTI CRUDE OIL: Bullish fractal from 2023 targets $78.50.WTI Crude Oil is neutral on its 1D technical outlook (RSI = 51.153, MACD = 0.060, ADX = 20.101) as it is trading around its 1D MA50 but at the same time remains supported on the S1 Zone. In the meantime the 1D RSI is rising on HL, which is a bullish divergence. This set of dynamics are identical to March-June 2023, when WTI was contained over the S1 Zone but the RSI was pointing to a bullish divergence that eventually caused a bullish breakout. Consequently, we are bullish now, aiming again at the R1 level (TP = 78.50).
## If you like our free content follow our profile to get more daily ideas. ##
## Comments and likes are greatly appreciated. ##

WTI OIL Major bullish break-out happened. Expect rally to $76.WTI Oil (USOIL) broke yesterday above the 1-month Lower Highs trend-line, following the bullish EIA report. This is a major bullish break-out as the last time the price broke above a similar Lower Highs trend-line was on October 01, with the resulting rally rising above the 0.786 Fibonacci retracement level.
Even the 4H RSI sequences between the two fractals are identical, with both starting on a Bullish Divergence (Higher Lows against the price's Lower Lows and then a nearly oversold RSI with the price on the Support Zone was what initiated the rebound that broke the Lower Highs.
Our Target is again the 0.786 Fib at $76.00.
-------------------------------------------------------------------------------
** Please LIKE 👍, FOLLOW ✅, SHARE 🙌 and COMMENT ✍ if you enjoy this idea! Also share your ideas and charts in the comments section below! This is best way to keep it relevant, support us, keep the content here free and allow the idea to reach as many people as possible. **
-------------------------------------------------------------------------------
💸💸💸💸💸💸
👇 👇 👇 👇 👇 👇

2024-12-11 - priceactiontds - daily update - wti crude oilGood Evening and I hope you are well.
tl;dr
wti crude oil futures - Neutral. Having a hard time being bullish inside trading ranges and unexpected moves higher. Volume is utter trash and yet market broke above last weeks high and the bear trend line. Bulls want 71 next but I would not be surprised if we go down to 68 or even 67 again.
comment: Daily chart shows the trading range which is still contracting but the very small break above last weeks high is a start for the bulls. Buying at previous resistance inside a trading range is always a bad trade. I’d rather wait if bulls come around big time on a pullback and see if it has strong momentum and can break above 70.5.
current market cycle: trading range
key levels: 67 - 71
bull case: Bulls made a small higher high and now want 71 next. The rally is not particularly strong and the volume is also atrocious. I don’t have many arguments for the bulls here.
Invalidation is below 66.27
bear case: Bulls have not printed more than 2 consecutive bull bars for almost 2 months now. Bears see that, previous resistance 70.5 from last week and still a bear trend line close enough. They have much more reasons to sell this, than bulls have for buying it.
Invalidation is above 70.6.
short term: Neutral. I wait for one side to gain momentum again but my bar for the bulls is higher than for the bears. I don’t have an opinion on where this goes next. For me it’s 50/50 if we go down to at least 69 or higher to 71.
medium-long term - Update from 2024-11-10 : Unless an event comes up, this will very likely close around 70 for the year.
current swing trade : Nope
trade of the day: Tough. Long was obviously right but there were so many trend lines that could have been resistance, it was much more reasonable to not take the longs than to hope for a breakout above multiple trend lines.

#202449 - priceactiontds - weekly update - wti crude oil futuresGood Evening and I hope you are well.
tl;dr
wti crude oil futures: Neutral af. Two weekly bear bars closing on their lows the past two weeks. Before that we had 12 weeks of most alternating bull/bear weeks. Can you get bearish now for a stronger leg down? I highly doubt it. Market has not had a weekly close below 65.6 for exactly a year. 65.6 is the November low and I expect it to hold. So looking for longs is probably the way to go but bulls only produced one single bull bar in the past 2 weeks. Need more buying pressure before looking for higher targets. I won’t touch it for now.
Quote from last week:
comment: The most likely outcome was a continuation of the trading range and that’s what we got. Bears are on their way to test 67 again and the market now have formed a head & shoulders pattern like in August where we broke down to make new lows. Most h&s patterns fail and are just continuation patterns. We will likely get the answer to that next week. Anything between 68 and 70 is a dead zone and I will only be interested in longs around 67, if bulls come around again. Shorts do not make sense below 70.
comment : Bulls are not doing enough but bears are also barely making new lows. Market is mostly two sided and stuck inside an 8$ range for 2 months. Don’t over analyze it.
current market cycle: trading range
key levels: 65 - 73
bull case: I won’t make up stuff here. Market has no direction for years now and the range is contracting. Bulls want to stay above 66 and test the upper bear trend line around 70 again. That’s about it.
Invalidation is below 66.
bear case: Bears are in control but it’s clearly a very weak trending trading range. We are inside nested triangles on higher time frames and selling below 67 has not been profitable for more than an intraday scalp since mid 2023. It hasn’t been profitable to get bearish below 67 for that long, why would you now.
Invalidation is above 71.6.
outlook last week:
short term: Neutral 68 - 70 and I doubt we make lower lows below 66. Even if bears push below, downside is likely limited.
→ Last Sunday we traded 68 and now we are at 67.2. Good outlook but trading ranges are not rocket science.
short term: Neutral 68 - 70 and I doubt we make lower lows below 66. Even if bears push below, downside is likely limited. Can’t change much of last weeks short term outlook, since it’s still valid. Bears have targets below 66 but until they get a daily close below it, we continue sideways.
medium-long term - Update from 2024-11-10: Unless an event comes up, this will very likely close around 70 for the year.
current swing trade: None
chart update: Nothing worth mentioning. Again.

WTI OIL Bullish break-out to $76 imminent.WTI Oil (USOIL) is so far following our last call (November 26, see chart below) on high precision as, after once last pull-back to the Support Zone, it is now rebounding:
As you can see now on this 1D chart, the price hit the 1D MA50 (blue trend-line) today but based on the other 2 November attempts, even a candle close above it doesn't translate into a sustainable break-out.
Contrary to that, however, those 2 attempts weren't supported by a 1D RSI Higher Lows base similar to September's. As you can see that same pattern was that initiated the rebound on the Support Zone that broke above the 1D MA50 and extended even above the 0.786 Fibonacci retracement level and tested the bottom of the 4-month Resistance Zone.
As a result, our $76.00 Target remains intact, which is marginally above the 0.786 Fib and projected to be just below the 1D MA200 (orange trend-line).
-------------------------------------------------------------------------------
** Please LIKE 👍, FOLLOW ✅, SHARE 🙌 and COMMENT ✍ if you enjoy this idea! Also share your ideas and charts in the comments section below! This is best way to keep it relevant, support us, keep the content here free and allow the idea to reach as many people as possible. **
-------------------------------------------------------------------------------
💸💸💸💸💸💸
👇 👇 👇 👇 👇 👇

#202448 - priceactiontds - weekly update - wti crude oil futuresGood Evening and I hope you are well.
tl;dr
wti crude oil futures: Bearish. Bears printed 4 consecutive bear bars and made new lows. Next target is 67. Only a daily close above 70 would do it for the bulls but even then the next bear trend line runs below 71. Market is once again forming nested triangles on the daily chart. Tough to trade.
Quote from last week:
comment: Was also bullish on this and bulls finally came around. Clear break of the bear trend line and next target is 72.6. Is this a very bullish structure? Hell no. I expect more sideways movement just in a bigger range 69 - 72/73 until the bear gap is closed. If bulls somehow manage to close it next week, we can expect 75+ next. Continuation of the current range is much more likely though and that is why you should not over analyze trading ranges. Market is in balance in the midpoint, so mark it and fade the extremes.
comment: The most likely outcome was a continuation of the trading range and that’s what we got. Bears are on their way to test 67 again and the market now have formed a head & shoulders pattern like in August where we broke down to make new lows. Most h&s patterns fail and are just continuation patterns. We will likely get the answer to that next week. Anything between 68 and 70 is a dead zone and I will only be interested in longs around 67, if bulls come around again. Shorts do not make sense below 70.
current market cycle: trading range
key levels: 67 - 72.6
bull case: Horrible week for the bulls with a clear sell signal going into next week. They have to defend 67 or we will likely go down to 66 or 65.74 again. Bulls who bought 67 have made money since September and we have no reason to expect it to be different this time. Daily close above 69 brings 70 and 70.5 in play.
Invalidation is below 67.
bear case: I do think Monday’s bar was a big bear surprise and market went mostly sideways afterwards. They also had a really good reversal on Friday which is a sell signal going into next week. They want to test the November low 66.27 and break below the very shallow bull trend line to test 65.73 or the lower bull trend line starting December 2023 at around 64.
Invalidation is above 71.6.
outlook last week:
short term: Bullish that we reach 72 but upside is probably limited after that. Pullbacks are likely to be bought if not too strong and if we stay above 68.
→ Last Sunday we traded 71.24 and now we are at 68. Outlook was just plain wrong and that was already clear on Monday at US open. Market basically went nowhere after that.
short term: Neutral 68 - 70 and I doubt we make lower lows below 66. Even if bears push below, downside is likely limited.
medium-long term - Update from 2024-11-10: Unless an event comes up, this will very likely close around 70 for the year.
current swing trade: None
chart update: Nothing worth mentioning.

#202446 - priceactiontds - weekly update - wti crude oil futuresGood Evening and I hope you are well.
tl;dr
wti crude oil futures: Neutral until bulls do more. 66.72 is still the low to be broken if bears want more downside, otherwise it’s a descending triangle with clear support around 67. It does look like bulls need an event to help them. Every small rip is sold and it’s a matter of time until one side gives up and we see another breakout. Last thing I want to be is bullish on this but until we have a daily close below 67, it’s huge support.
Quote from last week:
comment: Market is now trying for 4 weeks to get below 73 and still failing. Friday’s bar is decent enough that bears could have given up and market has to drop down to 68 or lower to 67 to find more buyers. The trading range 68 - 73 is still not broken and until it is, that is the range to play. I just expecting bears to be stronger next week than the bulls.
comment: Huge support around 67 and bears need a daily close below for lower prices. Bulls a daily close above 69 for 70 and potentially 70.4. No more magic to it and I won’t make stuff up for the fun of it. Market has no direction for weeks and the range is tighter than my food exit. As long as market does not drop below 66.72, bulls are ok but it’s really tough to make money as a bull in this. If bears break that price, we go 65 next, followed by 63.5.
current market cycle: trading range (descending triangle)
key levels: 67 - 71
bull case: At this point I am too lazy to come up with something for either side. I follow the range and past pattern. Last week was bearish and support held. Next week I expect trading above 69-71. I stop being lazy once the given range breaks. Maybe long range missiles onto Russian Oil depots will help this break out.
Invalidation is below 66.7.
bear case: Either break below 66.7 or give up again. Below 66.7 we see 65.74 and then 65 next.
Invalidation is above 69.
outlook last week:
short term : Neutral again. Range is unbroken, play it until it breaks.
→ Last Sunday we traded 70.38 and now we are at 67.02. Bad outlook but will probably touch 70 tomorrow or Tuesday again. Probably was just off due to Sunday-Sunday.
short term: Neutral.
medium-long term - Update from 2024-11-10: Unless an event comes up, this will very likely close around 70 for the year.
current swing trade: None
chart update: Nothing worth mentioning.

2024-11-12 - priceactiontds - daily update - oilGood Evening and I hope you are well.
tl;dr
oil - Neutral. 3 legs down are done and bulls got a couple of 1h bars that closed above the 1h 20ema. We have formed a descending triangle which will break out tomorrow and I do think a break to the upside is much more likely than below but it could happen. Bulls want 70 and bears 67. Below 67 would be 66.72 but I doubt bears can get there.
comment : Market is trying to find a bottom. Can wait for a breakout and not trade this contracting range. Bears want 67 and then 66.72 and bulls 70 if they can break above the bear trend line. Not more magic to it.
current market cycle: trading range (big triangle on the daily chart)
key levels: 63 - 78
bull case: Bulls see the 3 clear legs down and now want a correction to at least the 50% retracement at 70.30. Today they finally printed multiple bars above the 1h 20ema and they are producing good buying pressure at 68. Bears will likely try 1-2 more times at 68 before they could give up and we see the upside breakout.
Invalidation is below 67.50.
bear case: I do think it’s tough to be a bear below 68. Downside could be limited to 66.72 and where would you put your stop? 69? Could work but I would not. Market has not traded below 67 for more than 5 days in September. Ultimately bears want to retest the October low at 65.74 and they have more arguments on their side than the bulls and yet I still don’t think the risk:reward selling below 68 is worth it.
Invalidation is above 69.3.
short term: Neutral until bulls break 69.3. No interest in selling below 68.
medium-long term - Update from 2024-10-20 : No idea where this wants to go in the remaining 2 months of this year so I am neutral until we have a better pattern. The big triangle on the weekly chart is alive and until that changes, no more updates.
current swing trade: Nope
trade of the day: Buying 68 has been profitable and will likely continue to be.

WTI CRUDE OIL Bullish reversal expected.WTI Crude Oil / USOIL is pulling back on the 4hour chart, approaching the Support A level.
This level is where the last two rallies started on Oil.
The 4hour RSI being oversold as now, has coincided with 3 out of 5 major rallies since September 10th, so it is always a desirable level to buy.
Go long and target 78.00 near Resistance A.
Follow us, like the idea and leave a comment below!!

#202445 - priceactiontds - weekly update - wti crude oil futuresGood Evening and I hope you are well.
tl;dr
wti crude oil futures: Neutral between 68 - 73. Bulls have no tried to have a daily close above 73 for a month and could not get it. Friday’s bear bar looks like the turning point from which we will test lower. First bear target is a daily close below 70, followed by 68 and then 67. I doubt we get below 66.8 and rather print another nested triangle.
Quote from last week:
comment: The trading range expanded some but not much. On the weekly chart the September and October lows do seem to be respected and holding but since bulls fail to trade above 72.33, we are forming more nested triangles inside the big one on the monthly chart. For now the range is 65 - 72.33 until broken.
comment: Market is now trying for 4 weeks to get below 73 and still failing. Friday’s bar is decent enough that bears could have given up and market has to drop down to 68 or lower to 67 to find more buyers. The trading range 68 - 73 is still not broken and until it is, that is the range to play. I just expecting bears to be stronger next week than the bulls.
current market cycle: trading range
key levels: 68 - 73
bull case: Bulls failed so many times below 73 now, they will probably only try again at 68 or even lower. We are making higher lows since September, so for now I expect buyers to step in above 67.5. If bulls keep it above 70, I would be surprised and we chop more between 70 and 73 until one side clearly gives up.
Invalidation is below 66.7.
bear case: Bears established strong resistance under 73 and we still have an open gap there. Their next target is to get a daily close below 70 to make much more bulls cover and then I expect the selling to accelerate down to 68 or even 67. Funny thing to watch currently is that the daily, weekly and monthly 20ema are as flat and close together like I have never seen it on markets before. This market is in absolute balance between 70 and 72. Mean reversion strategies for Oil must have made a killing in 2024.
Invalidation is above 73.
outlook last week:
short term: Neutral again. Clear range and bearish pattern with limited downside. Scalp and don’t overstay your welcome in positions.
→ Last Sunday we traded 69.49 and now we are at 70.38. Good outlook but it’s not hard to be neutral and be right about it in this market.
short term: Neutral again. Range is unbroken, play it until it breaks.
medium-long term - Update from 2024-11-10 : Unless an event comes up, this will very likely close around 70 for the year.
current swing trade: None
chart update: Nothing
WTI OIL targeting the 1D MA200 at $76.50WTI Oil (USOIL) managed to close yesterday above its 1D MA50 (blue trend-line) despite breaking below it intraday. Even if we see a pull-back like September 25-26, Oil is more likely to test the 1D MA200 (orange trend-line) as since the August 12 High, the market is practically ranging between the Support and Resistance Zones. Our Target is $76.50.
-------------------------------------------------------------------------------
** Please LIKE 👍, FOLLOW ✅, SHARE 🙌 and COMMENT ✍ if you enjoy this idea! Also share your ideas and charts in the comments section below! This is best way to keep it relevant, support us, keep the content here free and allow the idea to reach as many people as possible. **
-------------------------------------------------------------------------------
💸💸💸💸💸💸
👇 👇 👇 👇 👇 👇

#202443 - priceactiontds - weekly update - wti crude oilGood Evening and I hope you are well.
tl;dr
wti crude oil: Dead zone 70 - 72. Best not to trade it and wait for the breakout. I have no opinion on who wins it. For me to believe the bullish breakout to be good, I need to see follow through selling above 73, otherwise it could still be just a retest of the previous support.
Quote from last week:
comment: Bulls started ok on Monday and the close was neutral but Tuesday really killed every last bull who bought above 71 and hoped for a second leg up above 75. Market has now left a giant bearish island reversal between 71 and 72.5 and that is as bearish as it gets. Bulls last hope now is to hold above the bull trend line at 68.
comment: Bulls actually managed to hold it above 68 and the trend line but failed to close the bear gap completely. This leaves us in nowhere land between 70-72 and a proper triangle. Play that until it’s clearly broken. No more deeper analysis needed.
current market cycle: trading range (triangle on the weekly tf)
key levels: 63 - 78
bull case: Bulls need a daily close above 72.7 for a chance of retesting north of 75. Below 68 things get really spicy.
Invalidation is below 68.
bear case: Bears need a daily close below the bull trend lines (also head & shoulders neckline) for lower prices. First would be below 69 and second is below 68. If they manage that, market is free to test down to 66 and then 64. If the neckline breaks, measured move would be 59ish but that is very far fetched.
Invalidation is above 72.7.
outlook last week:
short term : Neutral 68-70 but leaning bearish near 71. Not the best spot to trade currently.
→ Last Sunday we traded 68.69 and now we are at 71.78. Decent outlook.
short term: Neutral 68-70 but leaning bearish near 71. Not the best spot to trade currently.
medium-long term - Update from 2024-10-20 : No idea where this wants to go in the remaining 2 months of this year so I am neutral until we have a better pattern. The big triangle on the weekly chart is alive and until that changes, no more updates.
current swing trade: None
chart update: Adjusted bear gap
