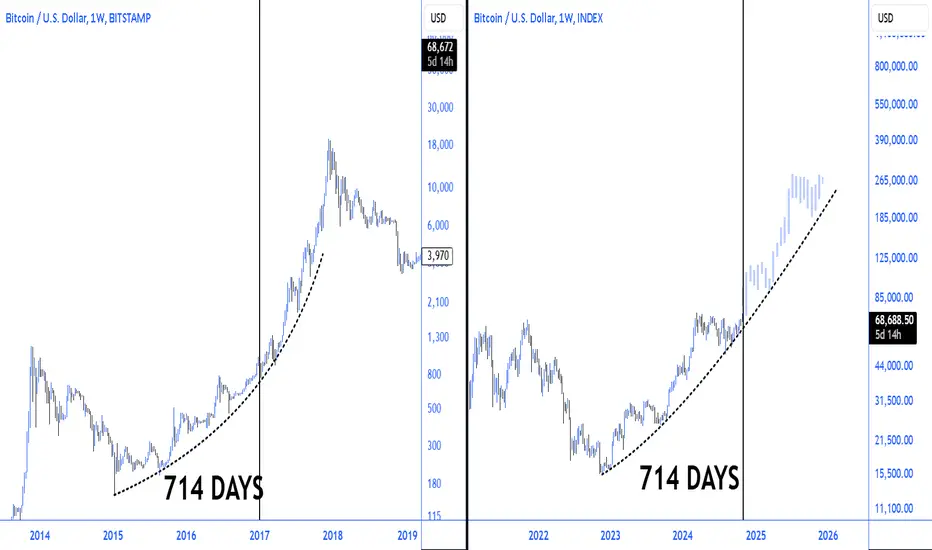
BITCOIN fully supported targeting $170k after the ATH breaks.Exactly 3 months ago (August 05, see chart below) when the price was on the 1W MA50 (blue trend-line), having hit it for the first time since the week of March 12 2003, we claimed that this was the last stand for Bitcoin (BTCUSD) if the market wanted to maintain the Bull Cycle, as based on the previous 3 Cycles, it was the absolute supporting trend-line:
The 1W MA50 eventually held not once but twice and that gave way to a rally that last week tested the 73800 All Time High (ATH). That is incredibly bullish, especially only two days before the U.S. elections, as from the historic patterns we've shown you before, a Parabolic Rally has started after each election.
So according to our August comparison chart, if history is repeated, BTC is looking towards at least the 1.618 Fibonacci extension from the ATH, which is roughly a little over $170k.
But what do you think? Are you expecting the ATH test to start a massive rally similar to all previous Cycles? And if so, is $170000 a realistic Target? Feel free to let us know in the comments section below!
-------------------------------------------------------------------------------
** Please LIKE 👍, FOLLOW ✅, SHARE 🙌 and COMMENT ✍ if you enjoy this idea! Also share your ideas and charts in the comments section below! This is best way to keep it relevant, support us, keep the content here free and allow the idea to reach as many people as possible. **
-------------------------------------------------------------------------------
💸💸💸💸💸💸
👇 👇 👇 👇 👇 👇
1-BTC

Bitcoin Falling Again==>>Short-term!!!Bitcoin ( BINANCE:BTCUSDT ) is currently moving near the Resistance lines and in the Resistance zone($69,580-$68,800) .
Regarding Elliott's wave theory , it seems that Bitcoin is still completing Corrective Waves . The Structure of Correction Waves looks like Double Three Correction(WXY) .
I expect Bitcoin to Go Down at least Cumulative Long Liquidation Leverage after breaking the Uptrend line .
⚠️Note: We can expect more pumps if Bitcoin can break the Resistance zone($69,580-$68,800) .⚠️
⚠️Note: The American elections and the tension between Iran and Israel can easily change the scenarios of Bitcoin: if the tension between Iran and Israel increases, we can see the fall of Bitcoin, and if Donald Trump does not succeed in the US presidential election, we can see the fall of Bitcoin. And vice versa.⚠️
Bitcoin Analyze (BTCUSDT), 15-minute time frame⏰.
🔔Be sure to follow the updated ideas.🔔
Do not forget to put Stop loss for your positions (For every position you want to open).
Please follow your strategy and updates; this is just my Idea, and I will gladly see your ideas in this post.
Please do not forget the ✅' like '✅ button 🙏😊 & Share it with your friends; thanks, and Trade safe.

What reaction does the market have to the elections?The price managed to break the wedge in the one-hour time frame, and this is very good. The price can rise again to 71k dollars or even more with a little correction. Now we have to wait for the results of the US elections, which have a significant impact on this market.
In the current scenario, with the US elections being so close, there's a lot of uncertainty, which can lead to increased market volatility. Investors are closely watching the candidates' stances on key issues like trade policies, taxes, and regulation, as these will have significant implications for various sectors.
Give me some energy !!
✨We spend hours finding potential opportunities and writing useful ideas, we would be happy if you support us.
Best regards CobraVanguard.💚
_ _ _ _ __ _ _ _ _ _ _ _ _ _ _ _ _ _ _ _ _ _ _ _ _ _ _ _ _ _ _ _
✅Thank you, and for more ideas, hit ❤️Like❤️ and 🌟Follow🌟!
⚠️Things can change...
The markets are always changing and even with all these signals, the market changes tend to be strong and fast!!

HelenP. I Bitcoin can break resistance level and continue growHi folks today I'm prepared for you Bitcoin analytics. In the chart, we can see how the price declined to the support level, which coincided with the support zone, and then at once tried to grow. But soon it turned around and dropped below the 63000 level, breaking it, and then some time traded below this level. Price tried to rise higher than the support level, but failed and declined to the trend line, after which it rebounded and grew back. Soon, BTC broke the 63000 support level and rose in a short time to the resistance level, which coincided with the resistance zone. After this, the price rebounded and made little correction, after which continued to move up inside pennant. BTC reached a resistance level, broke it, and rose to the resistance line of pennant pattern, but soon turned around and started to decline. It quickly fell to the trend line, breaking the resistance level, but recently started to grow. Now, I expect that BTCUSDT will exit from the pennant, break the resistance level, and then make a retest. Then I think the price can continue to move up, therefore I set my goal at 73000 points. If you like my analytics you may support me with your like/comment ❤️

Bitcoin Faces Rejection at Resistance: Short-Term Downsidehello guys.
Failed Breakout: Bitcoin attempted to break above the resistance zone around $69,400–$69,600 but was unable to sustain the move, indicating a potential lack of buying strength at these levels.
Broken Trendline: The price has already broken below a key ascending trendline, reinforcing the bearish bias in the short term.
Bearish Zone: The shaded pink area represents a strong resistance zone, which Bitcoin struggled to overcome. Sellers defended this zone effectively.
Potential Downside Target: With the rejection at resistance, the price may head toward the support area around $67,963–$67,934, as indicated by the green zone.
Lower High Formation: The lower high structure suggests that the trend could continue downward if the current pattern holds.

Bitcoin Roadmap==>Short term!!!Bitcoin ( BINANCE:BTCUSDT ) touched the 🎯 Targets 🎯 as I expected in the previous post ✅.
Bitcoin started to rise well from the Support zone($67,620-$67,000) and the Support line again ( the start was accompanied by good momentum ).
Regarding Elliott's wave theory , wave 5 seems to be completed .
I expect Bitcoin to rise to at least the Support zone after breaking the Resistance lines .
⚠️Note: The American elections and the tension between Iran and Israel can easily change the scenarios of Bitcoin: if the tension between Iran and Israel increases, we can see the fall of Bitcoin, and if Donald Trump does not succeed in the US presidential election, we can see the fall of Bitcoin. And vice versa.⚠️
Bitcoin Analyze (BTCUSDT), 15-minute time frame⏰.
🔔Be sure to follow the updated ideas.🔔
Do not forget to put Stop loss for your positions (For every position you want to open).
Please follow your strategy and updates; this is just my Idea, and I will gladly see your ideas in this post.
Please do not forget the ✅' like '✅ button 🙏😊 & Share it with your friends; thanks, and Trade safe.

When to Book Profits in Bitcoin?Bitcoin technical analysis update
Historically, when Bitcoin's monthly RSI reaches overbought levels, the price tends to drop. In 2013, the RSI peaked at 97, in 2017 it reached 95, and in 2021, it topped at 92.5, forming a higher low divergence on the monthly chart. This time, if the RSI reaches the 90 level, it could signal another peak for Bitcoin. When the RSI reaches the 89-90 range on the monthly chart, it’s typically a good time to start booking profits. Currently, the RSI is at 63, suggesting there is still room for a price increase in the coming months.
Regards
Hexa

BTC UPDATE (2H)Bitcoin had a CME gap that has just been filled.
From the green range, it can move up and then drop.
CME gaps are usually filled, especially if the gap is close.
When these gaps are filled, the price is balanced.
For risk management, please don't forget stop loss and capital management
Comment if you have any questions
Thank You

Bitcoin can fall little more and then rebound up in channelHello traders, I want share with you my opinion about Bitcoin. By observing the chart, we can see that the price declined to the support level, and soon turned around and started to grow. But soon turned around again and dropped lower 68000 level, breaking it, and started to trades inside range. In the range, the price fell to the bottom part and then in a short time rose to the support level, and even made a fake breakout. After this, BTC fell back to the range, and even declined to bottom par again, where it made impulse up and rose higher than the 68000 level, breaking it, thereby exiting from the range too. Next, the price continued to grow and reached the 71000 level, which coincided with the seller zone and then broke this level. Then the price rose to 73600 points, after which started to decline inside the downward channel. In the channel, the price broke the resistance level and fell to the support line, after which tried to back up, but failed and continued to fall. Recently BTC reached a support level, after which rebounded and has now grown. So, in my opinion, the price can decline a little more and then rebound up to the resistance line of the channel. That's why I set my TP at 70400 points, which coincided with this line. Please share this idea with your friends and click Boost 🚀

Bitcoin Bull Run Ignites: Eyeing New Highs Ahead of ElectionsOverview: Bitcoin (BTC) has recently demonstrated significant bullish momentum, breaking the $68,900 resistance level. This surge is supported by favorable financial news and the anticipation surrounding the U.S. presidential election scheduled for tomorrow.
Key Levels:
Entry Point: $68,900
Target 1 (T1): $75,146.69
Target 2 (T2): $84,392.46
Target 3 (T3): $92,059.49
Stop Loss: $66,500
Technical Indicators:
Moving Averages: The 50-day and 200-day moving averages are trending upwards, indicating sustained bullish momentum.
Relative Strength Index (RSI): Currently at 65, suggesting room for further upward movement before reaching overbought territory.
Volume: Increased trading volume aligns with the recent price surge, reinforcing the bullish outlook.
Fundamental Factors: The upcoming U.S. presidential election has heightened market interest in Bitcoin, with both major candidates expressing favorable views towards cryptocurrency regulation. Additionally, significant inflows into Bitcoin exchange-traded funds (ETFs) have been observed, indicating strong institutional support.
Conclusion: The confluence of technical indicators and positive fundamental developments suggests a strong bullish outlook for Bitcoin. Traders should monitor the aforementioned target levels and adjust positions accordingly, keeping an eye on potential resistance as the market reacts to election outcomes.
Disclaimer: This analysis is for informational purposes only and does not constitute financial advice. Always conduct your own research before making investment decisions.

BITCOIN Bull VS Bear📊 BTC/USDT - Daily Analysis 📊
🔴 Main Scenarios
📉 Bearish Scenario (Wave C)
We are currently in corrective Wave C within a larger downtrend:
Rejection from the top suggests the completion of Wave B and the probable beginning of Wave C .
If price breaks down to reach the 1.618 or 2.618 Fibonacci retracement levels, this would confirm the end of Wave B and initiate the main downtrend toward targets in the $44,000 - $37,000 range.
Key Bearish Targets: $42,341.97 and $39,039.61 .
📈 Bullish Scenario (Ending Diagonal)
In the bullish option, the current pattern might be forming an Ending Diagonal:
Price must hold the trendline support (a wick below is acceptable, but a strong breakdown would invalidate this).
BTC could continue upwards toward 0.61 - 0.7 Fibonacci levels , approximately at $ 70,300 - $71,700 . Here, a potential rejection might test the trendline.
If Wave 4 of the ending diagonal remains intact, we may see a final minor rally to a new all-time high , targeting $77,000 - $79,300 to mark the top.
📉 Trading Strategy
Risk-Reward (RR) for Short Positions:
Monitor a bounce from support up to the $70,300 - $71,700 zone as a potential short entry.
The intensity of the decline after rejection will indicate whether a bearish trend is underway or if this is simply a corrective Wave 4.
🚫 Invalidation🚫
Short positions would be invalidated if price breaks above the previous all-time high.
📝 Conclusion📝
BTC is at a critical level. If it rejects around $70,300 - $71,700 , a continuation of the downtrend is expected. Confirmation would come with a break below the lower trendline, signaling a potential Ending Diagonal pattern. Alternatively, if BTC holds within the Ending Diagonal, another minor leg up toward $77,000 - $79,300 could complete the bullish cycle before a possible decline toward $44K - $37K.
Disclaimer:
⚠️ This is not financial advice! All information provided is for educational purposes only. Always conduct your own research before making any investment decisions. Trading carries a high risk and may result in the loss of capital

$BTC have a gold fractal!Please pay attention to the Bitcoin chart and the Gold fractal! It's incredible, but it looks very similar. The level of correlation is quite high! Similar formation of tops, bottoms, breakout without retest and then now breakout phase with retest. The retest was successful. Very soon there will be the strongest growth! Good luck!
Horban Brothers!

BTC to reach 110k by the end of mayFor a long time BTC has been zoning around the 23k level. This was indeed a big step up from the 16k level it had been zoning around for a terrifyingly long time as well. As you can see in the chart, everything is about to change. The green lines point towards a clear upward move anywhere near the next 3 weeks. If this happens indeed, i would expect a small bounce back before reaching the 100k or even the 110k within the next 3 months.
follow for more advice!
ps: do your own research, im not accountable for your investments.

Mt. Gox Moves $2.2 Billion in Bitcoin Amid Repayment DelaysMt. Gox, the once-dominant but now-defunct Bitcoin exchange, made waves by transferring 32,371 CRYPTOCAP:BTC —valued at approximately $2.2 billion—to unmarked wallets. The timing of these movements is critical, given the already volatile landscape surrounding Bitcoin and ongoing uncertainties related to the upcoming U.S. presidential election.
Mt. Gox Transfers 32,371 BTC to Unmarked Wallets
Blockchain analytics firm Arkham reports that Mt. Gox has executed a massive transaction, moving 32,371 BTC to two unidentified wallet addresses. This event stands as the largest transfer from Mt. Gox in recent months. Specifically, 30,371 BTC went to a wallet labeled “1FG2C…Rveoy,” while the remaining 2,000 BTC was directed to a separate wallet named “1Jbez…LAPs6.” Additionally, an internal movement of 2,000 BTC between cold wallets suggests ongoing asset reorganization, likely in preparation for creditor repayments.
This is not the first time that Mt. Gox has moved funds, as smaller transfers were observed last week. However, this latest transfer's scale has piqued market watchers' interest, sparking questions about its timing and the potential impact on the Bitcoin market.
Repayment Delays Extended to 2025
The transfer comes on the heels of Mt. Gox announcing a delay in its repayment schedule. Initially set for October 31, 2024, the deadline has been postponed to October 31, 2025, following approval by a Japanese court. This extension gives the Mt. Gox Rehabilitation Trustee more time to sort out repayment plans, which many investors see as a temporary relief. However, there is lingering concern about the eventual release of a large volume of Bitcoin into the market, which could exert significant downward pressure on CRYPTOCAP:BTC prices if creditors decide to sell their holdings en masse.
Market analysts are wary of how these delays and large-scale transfers could impact the broader cryptocurrency ecosystem, especially as repayment announcements from Mt. Gox have historically triggered market volatility.
Market Reaction and Election Uncertainty
The market's response to Mt. Gox's Bitcoin movements has been mixed. Some investors fear that the impending distribution to creditors could lead to substantial sell-offs, pressuring Bitcoin's price downward. These concerns come amid broader geopolitical and economic uncertainty, compounded by fluctuations in the U.S. presidential race.
Bitcoin’s price has already experienced a 7% dip last week, largely attributed to uncertainties surrounding the U.S. election. Speculation is rife about potential regulatory changes, with some traders anxious about a Kamala Harris presidency, given her largely undefined stance on cryptocurrencies. Conversely, a more crypto-friendly administration could spur optimism among investors.
Technical Outlook
Despite these concerns, Bitcoin ( CRYPTOCAP:BTC ) has shown signs of resilience. As of now, BTC is trading up 1.53%, with an RSI of 54.82, signaling moderate bullish momentum. The daily price chart also indicates a bullish engulfing pattern forming, which is often a precursor to upward movement. Furthermore, a golden cross—a bullish technical signal where the 50-day moving average crosses above the 200-day moving average—is slowly materializing.
Bitcoin’s immediate support lies between the $64,000 to $65,000 pivot range, and a short-term correction could be on the horizon. However, we are eyeing a potential surge to $75,000, with optimistic projections even stretching to $100,000, assuming bullish catalysts materialize. These factors include institutional inflows, market sentiment shifts, and broader acceptance of Bitcoin as a store of value amid economic uncertainty.
What Lies Ahead
Bitcoin’s trajectory is shaped by both macroeconomic elements and crypto-specific news. The Mt. Gox repayment delay has provided a reprieve, albeit temporary, preventing a massive influx of CRYPTOCAP:BTC into the market. Additionally, geopolitical events, such as the U.S. presidential election and looming concerns about regulatory shifts, add layers of complexity to Bitcoin’s outlook.
Investors should also consider Bitcoin’s role as a hedge against inflation and geopolitical instability. As traditional markets brace for election-related volatility, Bitcoin’s status as "digital gold" may attract more attention, driving up prices. However, this is contingent upon market sentiment remaining favorable and no significant sell-off events—such as a large-scale release from Mt. Gox creditors—materializing.
Conclusion
Bitcoin’s road ahead is fraught with both challenges and opportunities. The Mt. Gox transfers and repayment delays have introduced another layer of complexity, while the upcoming U.S. presidential election adds to the uncertainty. Yet, technical indicators suggest that a bullish trend could be on the horizon, provided the market can weather short-term corrections and external shocks.
As always, the crypto landscape is ever-changing, requiring both patience and mental fortitude from investors. The coming weeks will be pivotal in determining Bitcoin’s trajectory, and all eyes will be on key resistance and support levels as the market digests these developments

Like it or not, it really is this simple.Some of you may not appreciate this chart, but we have to trade on facts not wishes. Right now (and it pains me to say this as a technical analyst), you can throw all your technicals out the window. The market is trading U.S. election results. That's it. Trump looks to be winning the popular vote by a large margin. Once the results are official and Trump is declared the winner, the rocket ships will fire up, take off, and may leave many traders in the smoke with FOMO. On the other hand, if there enters any doubt whatsoever that Trump will be the next POTUS, down we'll go.

Run it back turbo #Bitcoin CRYPTOCAP:BTC price action in 2024 is in some ways reminiscent of the 2016-2017 rally.
At that time, the price of #btc began to rise after the block reward halving in 2016 and peaked at the end of 2017.
Similarly, market expectations have risen again after the 2024 halving.
There is a similar momentum cyclically; prices tend to move upwards due to supply constraints and increased demand after the halving.
Oct.29-Nov.04(BTC)Weekly market recapLast Friday, the non-farm payroll data fell significantly short of expectations, leading to a substantial increase in interest rate cut anticipations. The price of BTC surged before retreating, with the majority of traders attributing the disappointing data to the impact of the hurricane, as the market response was less than favorable.
Currently, the outcome of the U.S. presidential election is pivotal for the mid-term trajectory of BTC, given the differing monetary policy and inflation outlooks of the two candidates. Should Trump be elected, the promised favorable policies may come to fruition, increasing the likelihood of institutional investments in BTC, thereby enhancing its fundamentals as digital gold. Conversely, if Harris takes office, the SEC is expected to maintain its stringent stance on cryptocurrency regulations.
Last week, BTC experienced an initial rise followed by a decline, breaking through the resistance level to reach $73,590 on Tuesday. The WTA indicator showed the emergence of blue bars representing whales, but these disappeared after Saturday, indicating a withdrawal of significant capital. The ME indicator remains in a bullish trend.
In summary, we anticipate that BTC may experience considerable volatility this week. We have adjusted the resistance level to $74,000 and the support level to $67,000.
Disclaimer: Nothing in the script constitutes investment advice. The script objectively expounded the market situation and should not be construed as an offer to sell or an invitation to buy any cryptocurrencies.
Any decisions made based on the information contained in the script are your sole responsibility. Any investments made or to be made shall be with your independent analyses based on your financial situation and objectives.

BTC and the previous three US Election DatesThis charts the dates of the previous three US Elections (2012, 2016 and 2020) on a log chart, with price on the horizontal axis at daily candle close.
As you can see, once price breaks above (sometimes next day, as in 2020, sometimes a week or more later, as in 2016 and in 2012) price has never returned - ever.
Plotted are the time and percentage difference from election date to cycle ATH. On average it's 387 days apart.
If things play out this time in a similar fashion we can expect this week into mid next week to be the final time BTC will be in the mid 60k per coin - ever.

#Altcoin run is programmed in the medium term.2025 will be unique for #Alts and #Bitcoin
The impact of the elections in the US on financial markets can be significant. A win by #Trump or Harris could have different effects in terms of economic policies and market expectations. If Trump wins, it is possible that prices will rise even more due to high inflation expectations in the markets. If #Harris wins, it is expected that the #Fed will continue with its current monetary policies, so although there will be price fluctuations in the short term, it is possible that the bull run will continue in the long term.
It should not be forgotten that the election results are not only related to short-term effects, but also to medium and long-term economic fundamentals and central bank policies. 🤝

BTCUSDT Bullish Wedge Pattern!BINANCE:BTCUSDT has formed a falling wedge pattern on the 1-hour chart, with strong support at the bottom of the wedge around $67,000. The price has already broken out of the pattern and is now retesting the wedge resistance. Additionally, BTC has crossed above the 100 EMA on the 1-hour chart, indicating potential bullish momentum. We can expect a strong upward move from the current level.
Regards
hexa

BITCOIN Update !!The latest BTC/USDT chart update shows a significant zone marked as a "extreme zone" around the 64,000 - 65,000 level, highlighted in red.
This red-highlighted zone around 64,000 is being emphasized as a strong support level. If the price retraces to this area, BTC may find buying interest, potentially providing a solid base for a rebound.
The upper orange bar, near 72,000, represents a major resistance level. If BTC reaches this level, it may face selling pressure unless it can break above decisively.
The green arrow suggests a bullish outlook after a possible pullback to the strong support zone. This scenario implies that BTC could rebound from the 64,000 zone and make another attempt at breaking above the 72,000 resistance.
In summary, BTC appears to have a key support at 64,000, which could act as a pivot point for the next upward movement. A failure to hold this zone, however, might indicate a shift in momentum.
Disclaimer: This analysis is for informational purposes and is not financial advice. Always stay updated with market movements and adjust your trading strategies as needed.
You can DM us for information on any other coin.
@Peter_CSAdmin

$BTC - Possible 3-tap-setup CME gap at 66.8k has been filled and we swept below imbalances (poor low/singleprint)
If we can hold 67.4k (pwLow ), then will consider it as a valid swing point retest for a three-tap setup
67.4k - swing point
66.8k - deviation
67.4k - swing point retest
Looking for 70.3k (FriOpen) as initial target, next is around 71.8k (FriHigh/singleprint)
Invalidation is a break of local low 66.8k

Check support near 68393.48
Hello, traders.
If you "Follow", you can always get new information quickly.
Please click "Boost" as well.
Have a nice day today.
-------------------------------------
(BTCUSDT 1D chart)
The key is whether it can quickly rise to the 68393.48 area.
The next important support and resistance point is the 65920.71 point.
Therefore, if it continues to fall, we need to check support near 65920.71.
This volatility period is until November 5th, and the next volatility period is around November 10th (November 9th-11th).
-
BW indicator is an indicator that comprehensively evaluates MACD, StochRSI, OBV, and ATR indicators.
Currently, the BW indicator has touched the 50 point.
Therefore, when the BW(50) point is created, you can conduct an aggressive transaction depending on whether there is support near it.
-
StochRSI indicator has completely entered the oversold zone.
In addition, StochRSI EMA appears to have fallen below the 50 point zone.
Accordingly, you need to check where the StochRSI indicator is located when it rises in the oversold zone and maintains the state of StochRSI > StochRSI EMA.
-
In order to complete the pull back pattern, the uptrend must be maintained.
Therefore, the uptrend of the linear regression channel must be maintained.
To do so, you can see that the price must be maintained around 65920.71 or higher.
-
To summarize the above, in order to maintain and continue the uptrend, the price must be maintained above 68393.48.
-
Have a good time.
Thank you.
--------------------------------------------------
- Big picture
The real uptrend is expected to start after rising above 29K.
The expected range to touch in the next bull market is 81K-95K.
#BTCUSD 12M
1st: 44234.54
2nd: 61383.23
3rd: 89126.41
101875.70-106275.10 (overshooting)
4th: 134018.28
151166.97-157451.83 (overshooting)
5th: 178910.15
These are points where resistance is likely to occur in the future.
We need to check if these points can be broken upward.
We need to check the movement when this section is touched because I think a new trend can be created in the overshooting section.
#BTCUSD 1M
If the major uptrend continues until 2025, it is expected to start forming a pull back pattern after rising to around 57014.33.
1st: 43833.05
2nd: 32992.55
-----------------
