BTC – Stop Hunt at the Edge of ValueThis is what a liquidity raid looks like.
Price just swept the bottom of the range, tapped into the low-volume zone (as seen on the volume profile), and reclaimed — classic sign of a trap sprung.
Key points:
The downtrend line labeled “comp” = compression — bulls forced to capitulate into a thin zone
High probability deviation with stop run and reclaim — this fuels the next move up
The green box shows risk-defined entry off the sweep low
Targeting the prior high: 106,787
Volume imbalance filled = no inefficiency above — price can now move cleanly
Execution mindset:
Trap spring → retrace into structure → expansion
Risk is clear, liquidity is engineered, structure remains
Late shorts just became the fuel.
Watch the reclaim of the box top. If that flips support, we ride momentum.
📈 For more setups like this — including pre-breakout traps — check the description in the profile.
1-BTC

BTCUSD: Nowhere near a top yet.Bitcoin remains neutral on its 1D technical outlook (RSI = 47.257, MACD = 443.000, ADX = 29.912) due to high volatility recently but the bullish long term trend is intact and even more so, hasn't yet started the year-end rally. The Mayer Multiple Bands have always priced a Cycle's Top on their red trendline so no matter how high that may seem from the current market price, the TP zone should be between the orange (2 Stdev above) and red (3 Stdev above) trendines. Minimum TP = 200,000 for this Cycle.
## If you like our free content follow our profile to get more daily ideas. ##
## Comments and likes are greatly appreciated. ##

SUI Long Swing Setup – Confluence of Support and Fibonacci LevelSUI has pulled back into a key confluence zone, aligning with both the 61.8% Fibonacci retracement and horizontal support. We’re now eyeing the $2.70–$2.80 area for a potential long entry.
📌 Trade Setup:
• Entry Zone: $2.70 – $2.80
• Take Profit Targets:
o 🥇 $3.40 – $3.60
o 🥈 $4.00 – $4.20
• Stop Loss: Daily close below $2.65

BTC on the Daily: Bearish Structure Locked In?So, on the daily, price is in a clear bearish context.
PSAR is bearish
MLR < SMA < BB center
We're about to close below the 50MA
Price already broke below the Higher Lows trendline and the December 2024 top
At this point, it all depends on the macro situation and the FOMC tone tonight.
If the outcome is positive, there's a chance price rebounds.
If not, the chart looks ready to dive.

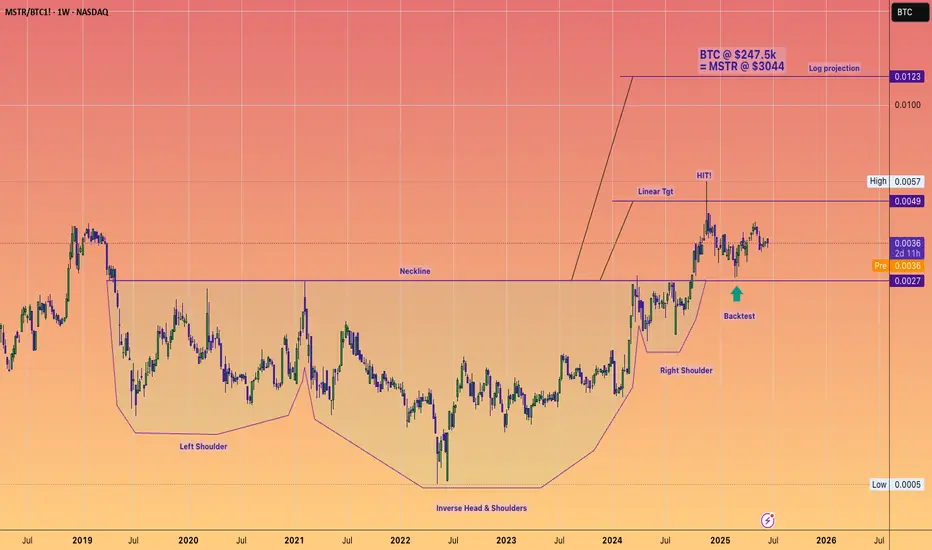
Could Microstrategy be a 1 Trillion dollar mcap company?!Microstrategy and Michael Saylor evoke a spectrum of opinions, with analysts offering a diverse range of potential future valuations.
High risk, high reward!
The destiny of Microstrategy’s market capitalization is clearly linked to Bitcoin’s performance. The company has been utilizing debt to acquire the cryptocurrency, aiming to create significant spreads. This leverage is the reason why the stock has significantly outperformed Bitcoin throughout 2024.
I am confident that Bitcoin can indeed reach $200k, with a potential upper price target of $250K for this cycle, indicating a potentially explosive Q3 and Q4.
The lingering question is how much additional FOMO and premium Saylor can cultivate for his leveraged vehicle in such an environment?
That's why charting is such a key component to any personal investing strategy IMHO, as we navigate these markets.
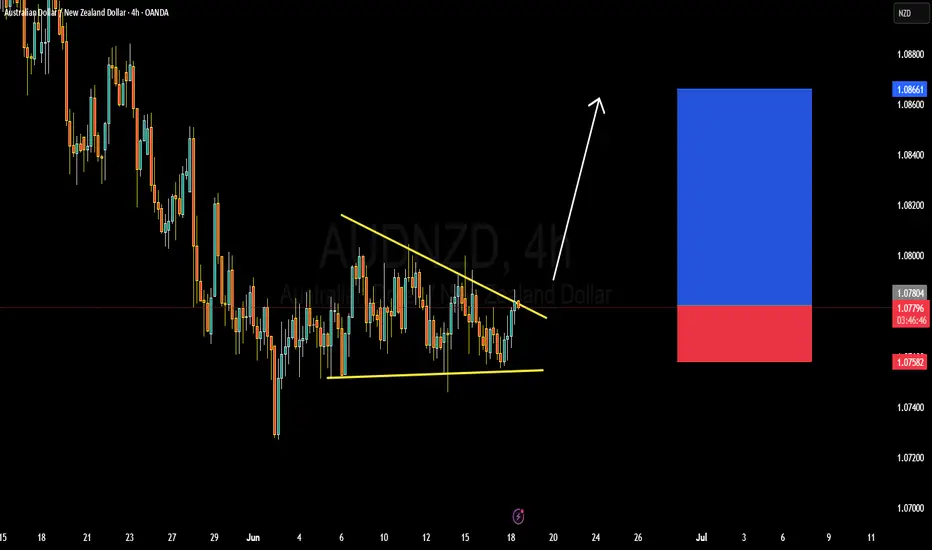
AUDNZD BULISH OR BEARISH DETAILED ANALYSISAUDNZD is currently trading around 1.078 and is on the verge of a classic falling wedge breakout, which is a bullish reversal pattern typically seen after a downtrend. Price action has been compressing within this wedge formation, suggesting an imminent breakout as market pressure builds. A decisive close above the descending trendline would be a powerful signal of bullish continuation, with a near-term upside target of 1.086. The structure has held multiple rejections at both resistance and support, highlighting strong accumulation behavior from institutional participants.
Fundamentally, the Australian dollar is gaining relative strength due to the Reserve Bank of Australia maintaining a hawkish tone, supported by persistent inflation and labor market resilience. In contrast, the Reserve Bank of New Zealand recently surprised the market by signaling a potential end to its hiking cycle, citing slower growth and inflation moderation. This divergence in monetary policy outlook is creating favorable conditions for AUDNZD bulls, particularly as global risk appetite improves and commodity-linked currencies gain traction.
Technically, this 4-hour chart pattern aligns perfectly with recent AUD strength across the board, particularly in pairs like AUDUSD and AUDJPY which have broken key resistance levels. The tight consolidation near the wedge’s upper boundary, coupled with bullish candlestick formations, suggests buyers are stepping in ahead of the breakout. With a clean invalidation below 1.075, the risk-reward ratio here is compelling, especially for momentum traders looking to catch an impulsive leg higher toward 1.086 and beyond.
This setup is high-conviction. AUDNZD is poised for a breakout that aligns with both technical and macro fundamentals. As a professional trader, I’m tracking this setup closely, and any confirmation candle above the trendline will trigger my entry. I expect bullish continuation in line with AUD’s broader strength and NZD’s underperformance.
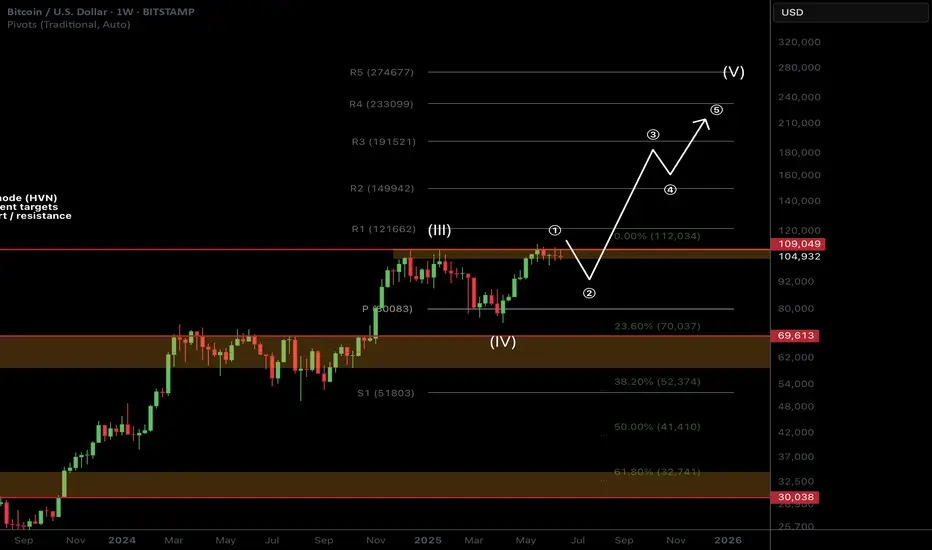
BTC Macro Analysis☕ 𝙂𝙈. CRYPTOCAP:BTC macro analysis update...
📈 𝙇𝙤𝙣𝙜 𝙩𝙚𝙧𝙢 outlook remains unchanged and recent price action is barely a blip on the weekly chart. SD+2 target is still $211k as a blow off top.
📉 𝙎𝙝𝙤𝙧𝙩 𝙩𝙚𝙧𝙢 outlook has investors looking lower towards the $92K target but this isn't guaranteed to be reached and price action may front those who wait.
War escalation's and retail selling are keeping price suppressed as price changes hands to private companies and large wallets.
The time for patience continues. Money is made in the sitting, weathering volatility, not flipping in and out of trades on every bit of news and price movement
𝙏𝙚𝙘𝙝𝙣𝙞𝙘𝙖𝙡 𝘼𝙣𝙖𝙡𝙮𝙨𝙞𝙨
Price is consolidating under all time high resistance. Consolidation under resistance has high probability of breaking out, the longer it remains the higher the probability.
Elliot Wave (EW) analysis suggests a motif wave ended with the poke above all time high (per the EW rules), with a wave 2 retracement underway. Price remains above the daily pivot (bullish) but below the DEMA (bearish). A triangle could still be forming but this is not my preferred EW count.
Safe trading
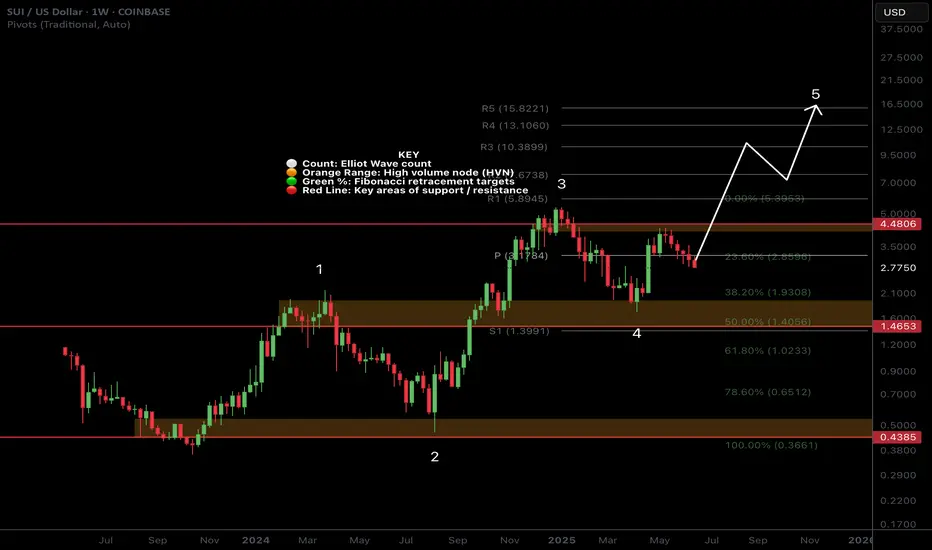
SUI Macro AnalysisCRYPTOCAP:SUI macro analysis update...
📈 𝙇𝙤𝙣𝙜 𝙩𝙚𝙧𝙢 outlook shows price action still outperforming most alts with a great rally recently. Target remains the R5 weekly pivot at $15
📉 𝙎𝙝𝙤𝙧𝙩 𝙩𝙚𝙧𝙢 outlook has price pulling back, looking to find a bottom between $2.3-2.65
War escalation's and retail selling are keeping price suppressed as price changes hands to private companies and large wallets.
The time for patience continues. Money is made in the sitting, weathering volatility, not flipping in and out of trades on every bit of news and price movement
𝙏𝙚𝙘𝙝𝙣𝙞𝙘𝙖𝙡 𝘼𝙣𝙖𝙡𝙮𝙨𝙞𝙨
Price is testing the weekly pivot and daily S1 pivot as support
Elliot Wave (EW) analysis was a strong, textbook motif wave with a wave 2 retracement underway. Wave 2 often extends to the 61.8 Fibonacci retracement of $2.4 but the alt-coin golden pocket is the 78.6 at $2.03. No surprises if we see that area revisited and could be a great buying opportunity.
Price has lost the daily 200EMA and DEMA which is bearish short term.
Safe trading
BTCUSDT – Price Poised to Break Descending ChannelBTCUSDT has been maintaining a series of higher lows since early May, consistently rebounding from its dynamic support trendline. Currently, the price is consolidating just below the descending channel resistance around the 108,000 USDT level. A clear double-bottom pattern accompanied by solid recovery momentum suggests a potential breakout from the prolonged correction phase that has persisted throughout June.
If BTC breaks above the descending trendline, the next target could be the major resistance zone near 113,000 USDT.
On the news front, the market is reacting positively to BlackRock’s announcement of expanding investment in crypto ETF products. At the same time, recent soft U.S. inflation data has strengthened expectations that the Fed may halt its tightening cycle. This combination is improving investor sentiment and driving renewed interest in risk assets like Bitcoin.

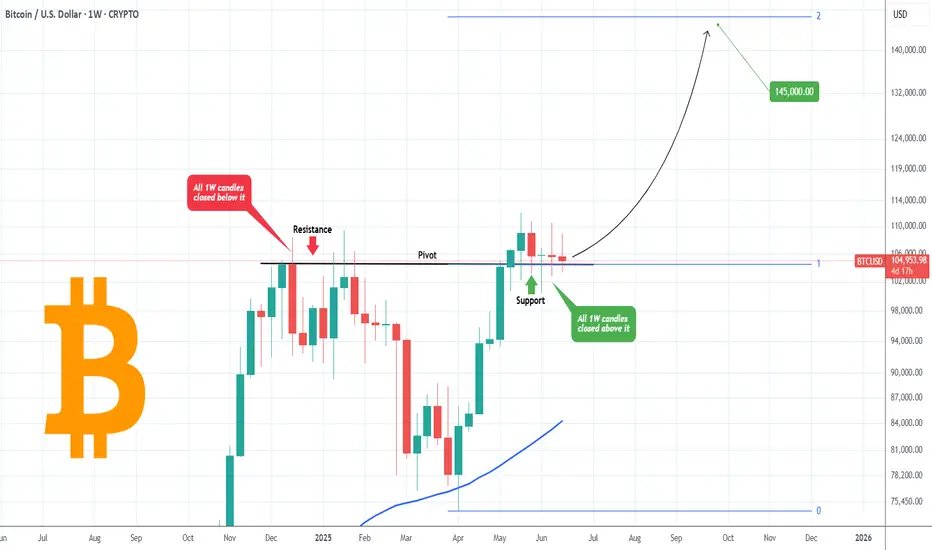
BITCOIN The secret trend-line that no one notices..Bitcoin (BTCUSD) was under heavy selling pressure yesterday and even the 1D time-frame turned marginally bearish. What most seem to ignore however is the larger picture. On the 1W time-frame, BTC has managed to close the last 5 weeks above the Pivot trend-line.
What that trend-line is? It is the level that initially started as a Resistance from December 09 2024 to January 27 2025, closing all 1W candles below it, despite occasional candle wicks breaking above it. That confirmed it's status as a Resistance at the time.
Now we see the opposite, five straight 1W candles closing above that Pivot line. Check in particular, how flat the last two 1W candles closed, showcasing no just the high volatility that the market is under in the past weeks, but also the same amount of sellers and buyers existing in the market (neutral).
This is an indication that this is a consolidation phase, preparing BTC for the next rally. If we place the top Fibonacci level (1.0) on that Pivot, we get the 2.0 Fib extension just above the $145000 mark. That gels perfectly with various other studies we've conducted showing a similar long-term Target.
So do you think the Pivot line will hold and push Bitcoin to $145k? Feel free to let us know in the comments section below!
-------------------------------------------------------------------------------
** Please LIKE 👍, FOLLOW ✅, SHARE 🙌 and COMMENT ✍ if you enjoy this idea! Also share your ideas and charts in the comments section below! This is best way to keep it relevant, support us, keep the content here free and allow the idea to reach as many people as possible. **
-------------------------------------------------------------------------------
💸💸💸💸💸💸
👇 👇 👇 👇 👇 👇
BTC/USDT in Consolidation: How To Trade the RangeBitcoin (BTC/USDT) is currently in a clear consolidation phase on the 4-hour chart 📊. Price action is trapped within a well-defined range, and for now, no dominant trend has emerged — we’re simply trading sideways between key support and resistance levels 🔁
In the video, we dive into how to tactically approach this kind of environment by trading the lower time frame trend shifts within the range — focusing on lower timeframe moves from range highs to range lows, and vice versa ⬆️⬇️
We also reference the broader macro picture — looking at the NASDAQ (US100) and the Magnificent 7 (MAGS) for potential clues about Bitcoin’s next directional move 🧠💡. Risk-on or risk-off sentiment in these key tech equities often correlates with Bitcoin’s momentum, making them critical confluence factors for BTC traders.
For now, the strategy is to remain range-conscious and reactive, rather than predictive. Until we get a confirmed breakout or breakdown, patience and precision remain key 🎯

Bearish reversal?The Bitcoin (BTC/USD) is rising towards the pivot which is a pullback support and could reverse to the 1st support which is also a pullback support.
Pivot: 106,391.59
1st Support: 103,654.27
1st Resistance: 108,761.68
Risk Warning:
Trading Forex and CFDs carries a high level of risk to your capital and you should only trade with money you can afford to lose. Trading Forex and CFDs may not be suitable for all investors, so please ensure that you fully understand the risks involved and seek independent advice if necessary.
Disclaimer:
The above opinions given constitute general market commentary, and do not constitute the opinion or advice of IC Markets or any form of personal or investment advice.
Any opinions, news, research, analyses, prices, other information, or links to third-party sites contained on this website are provided on an "as-is" basis, are intended only to be informative, is not an advice nor a recommendation, nor research, or a record of our trading prices, or an offer of, or solicitation for a transaction in any financial instrument and thus should not be treated as such. The information provided does not involve any specific investment objectives, financial situation and needs of any specific person who may receive it. Please be aware, that past performance is not a reliable indicator of future performance and/or results. Past Performance or Forward-looking scenarios based upon the reasonable beliefs of the third-party provider are not a guarantee of future performance. Actual results may differ materially from those anticipated in forward-looking or past performance statements. IC Markets makes no representation or warranty and assumes no liability as to the accuracy or completeness of the information provided, nor any loss arising from any investment based on a recommendation, forecast or any information supplied by any third-party.

BTC- Can it reach 97Kish?As thing suggests the move can only be done when heavy fall is there, but as suggests lets small scalp things to our best!

Next Volatility Period: Around June 22
Hello, traders.
If you "Follow", you can always get new information quickly.
Have a nice day today.
-------------------------------------
(BTCUSDT 1M chart)
The morning star candle that we often heard about when studying candles appeared.
However, since the candle has not closed yet, the shape of the candle may change.
In stock charts, there were cases where the movement could be predicted with the shape of these candles, but in the coin market, it is impossible to predict.
The reason is that trading is possible 24 hours a day.
Most candle shapes occur with gaps, allowing for a comprehensive interpretation, but in the coin market, gaps are not likely to occur, so I think there is nothing that can be known from the shape of the candles.
Therefore, it is recommended not to try to analyze the chart with the actual shape or pattern of the candles.
However, you need to study to be able to read the arrangement of the candles in order to set support and resistance points.
Even this is not difficult to indicate support and resistance points because there are indicators that indicate support and resistance points.
-
(1W chart)
The 104463.99 point is the DOM (60) indicator point, which corresponds to the end of the high point.
Also, the 99705.62 point is the HA-High indicator point, which corresponds to the middle of the high points.
Therefore, the 99705.62-104463.99 section can be interpreted as the high point boundary section.
The actual trend is likely to occur while falling from 99705.62.
The importance of the 99705.62 point is increasing because the M-Signal indicator on the 1W chart is rising near the HA-High indicator point.
If it falls below the M-Signal indicator on the 1W chart, it is possible that the trend will be determined again when it meets the M-Signal indicator on the 1M chart.
Also, if it falls from the HA-High indicator, it can meet the HA-Low indicator.
Therefore, if the price starts to fall, you should check whether the HA-Low indicator is generated.
The fact that the HA-Low indicator was created means that it rose from the low range.
That is, just as the HA-High indicator corresponds to the midpoint of the highs, the HA-Low indicator corresponds to the midpoint of the lows.
The end point of the lows corresponds to the DOM(-60) indicator point.
-
(1D chart)
For this reason, it is important to see support around 104463.99-106133.74.
The trend is likely to appear after the next volatility period, around June 22nd (June 21st-23rd).
Therefore, we should consider the 104463.99-106133.74 range as the middle range,
- and see if it falls below 99705.62,
- or rises above 108316.90.
Accordingly, we should create a response strategy and be prepared not to panic when a trend appears.
-
The OBV is currently below the Low Line.
Therefore, if it does not receive support at the 104463.99 point, it is likely to fall again.
Since the OBV oscillator is still below the 0 point, we can see that the selling pressure is strong.
However, looking at the overall movement of the oscillator, we can see that the selling pressure is decreasing.
Therefore, if there is another decline, the key issue is whether there is support near 99705.62.
-
In summary, the area around 104463.99 is playing an important role as support and resistance.
Therefore, after the next volatility period, around June 22, we need to check and respond to the direction in which it deviates from the 99705.62-108316.90 range.
-
Thank you for reading to the end.
I hope you have a successful trade.
--------------------------------------------------
- This is an explanation of the big picture.
(3-year bull market, 1-year bear market pattern)
I will explain more details when the bear market starts.
------------------------------------------------------

Bitcoin Short-Term 4H Timeframe, Still Bullish But...Bitcoin continues bullish on the 4H timeframe and we have some positive signals coming out of the most recent swing and shakeout.
» The action went below 0.618 but is back above this level.
» The higher low did not reach 0.786 Fib. retracement support, which is a signal of strength.
» Trading volume continues to rise and as the action happens above $100,000, this signal works in favor of the bulls.
Short-term, Bitcoin continues green with the bulls in full control of the chart. When in doubt, zoom out; Crypto is going up.
This is obviously a consolidation pattern because we have higher lows but also lower highs. The revealing signal of course comes from the altcoins, look at Bitcoin Cash and you can get a good example.
The market will resolve bullish once the consolidation ends.
I say this based on market data and the charts.
If you agree leave a comment.
Thank you for reading.
Namaste.

Bitcoin Mid-Term, 4H Timeframe, Bullish ($119,165 Next Target)On the 4H timeframe we have a consolidation pattern with a bullish bias. Bitcoin is aiming higher after a close above EMA8 & 13 with higher lows.
The drop 13-June found support perfectly at 0.786 Fib. retracement on a wick. The session closed above 0.618. The action turned bullish immediately and we are seeing slow but steady growth.
The recent drop was a market reaction due to a geopolitical situation. As soon as the event is priced in, the market seeks balance and goes back to its previous trend.
Bitcoin's bullish bias is not only supported by strong prices, $105,600 is very strong, but also by the altcoins and the cyclical nature of the market.
While Bitcoin already produced several new all-time highs this year the altcoins are yet to do the same. A bull market happens every four years or the year after the halving. For Bitcoin this is already true but this is a marketwide event and the altcoins are yet to go there and this is a bullish factor and soon this will be obvious on the chart.
We are 5-6 days away only from very strong bullish action. Notice that this isn't a long time, it is less than a week. The altcoins will reveal this bullish bias much sooner than Bitcoin but Bitcoin will also grow and hit a new all-time high soon. This new all-time high will be the catalyst for everything to boom.
» Ignore the short-term it is all noise—crypto is going up.
The next target is $107,558, followed by $109,508 on this timeframe. The latter being a mild resistance.
The main target here is $119,165 and this is a good resistance zone. It can be rounded up to $120,000. If this level gets hit it will only confirm additional growth. The target that follows is $130,000 and the minimum for this cycle is $160,000 but we are aiming higher.
Feel free to follow for more.
I will continue to detail Bitcoin on all the timeframes as well as many of the top, mid- and small altcoins.
Thank you for your support.
It is appreciated.
Namaste.

BTCUSD: 1D MA50 and 100k form a strong support base.Bitcoin has turned neutral again on its 1D technical outlook (RSI = 45.783, MACD = 629.200, ADX = 20.857) and is about to get bearish as it hit its 1D MA50 today, erasing the gains of the last 3 days. The 1D MA50 has held two times since June 5th and another one might be what Bitcoin needs to justify the next rally. Besides this however, we got a heavier Support on the P1 trendline, which on the previous ATH (Dec 17th 2024) was a Resistance and since May 12th 2025 it turned into Support. Technically, as long as 100,000 holds, we expect a strong rebound into August that may repear the inverse of December 2024 - March 2025 (-31%) and rise by +31% (TP = 132,000).
## If you like our free content follow our profile to get more daily ideas. ##
## Comments and likes are greatly appreciated. ##

BTCUSD 1DI invite you to look at the current situation example, where you can see a lower high formation that has been formed, which could potentially lead to a larger price correction and the formation of a lower low in one of the 3 potentially designated locations.

Bitcoin - Levels of the Range On the hourly time frame it is clear that BTC is within a rangebound environment. Using key levels such as the weekly highs and lows with Mondays highs and lows to to paint a picture of where support and resistance may be.
In the "weekly outlook" post for this week I suggested a retest of the $108,500 area, an orderblock that pushed prices lower and is notorious for protecting Stop losses of the shorts that pushed price lower, nearly instantly as the week starts we get that move to sweep the supply zone and stop hunt the short trades.
After a successful sweep the swing fail pattern typically follows when in a rangebound environment or absent of a trend. This structure plays out and the sell-off follows.
Price breaks through the Monday low with zero fight so momentum is with the bears in the low time frame. Should momentum continue the previous week low is @ $102,500 which is in line with HTF key level too.
RSI is also entering the oversold zone and in a rangebound environment can be when price reverses direction, as seen by the previous Monday High and Previous week low.
With FOMC just over 24 hours away volatility usually follows. No rate cut forecast however many think the interest rate should be brought down in line with inflation as the ECB has already done.
In conclusion, BTC is in a clear rangebound environment on the hourly time frame.
Stop loss hunt/supply zone sweep and then SFP, the LTF momentum is with the bears going into FOMC.
Next point of support at $102,500 (Previous week low) and could be boosted by the oversold RSI.
An FOMC rate cut should be bullish although currently thought to be unlikely.

$DXY Dollar stays weak but is it bottommed?Have not many ANY trades based on the US Dollar. Have not been convinced in either way, yet.
TVC:DXY has been weaker lately but not by much. Well, at least compared to its previous low.
However, LONGER TERM we see it's biz as usual.
It is currently fairly oversold on the weekly chart & could be primed to change direction.

Bitcoin Symmetrical Triangle & another pattern formingBTC is currently trading in a Symmetrical Triangle formation.
This is generally a continuation pattern.
There's also a longer term BTC pattern FORMING.
Do you see it?
Inverse Head & Shoulder.
But it is a ways off, time will tell.
Bitcoin Crypto

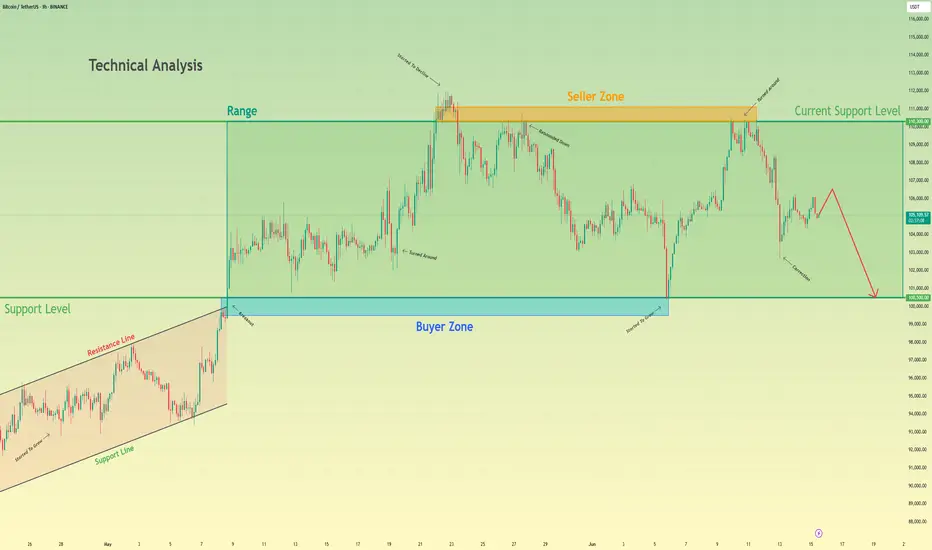
Bitcoin will make a small upward move and then continue to fallHello traders, I want share with you my opinion about Bitcoin. Earlier, the price was confidently growing inside an Upward Wedge, showing a series of higher highs and higher lows. This rising structure was supported by consistent momentum until BTC reached the seller zone between 110300 and 111100, where the growth slowed down and started to fade. From there, the price rejected this resistance and shifted into a Range, bounded by 100500 and 110300. BTC has been fluctuating inside this horizontal structure for some time, unable to break above the seller zone or below the buyer support. Now BTC is showing signs of weakness, forming a minor correction and struggling to reclaim previous highs. Given this structure and rejection from the seller zone, I expect BTC to make a small upward move and then start a decline toward the support level at 100500, which also coincides with the bottom of the range and acts as a strong psychological level. For this reason, I set my TP at 100500 points. Please share this idea with your friends and click Boost 🚀
HolderStat┆BTCUSD forming a triangleBINANCE:BTCUSDT is bouncing from the 104 k pennant foot on trend support, turning squeeze into bullish advance. Holding the rising line preserves upside bias; clearing 111 k unlocks 121 k and ATH chase 🏆
