Bitcoin (BTC/USD) 2-Hour Candlestick Chart2-hour candlestick chart displays the recent price movement of Bitcoin (BTC) against the U.S. Dollar (USD), showing a current price of $103,904.89 with a gain of $595.12 (+0.58%) as of 01:22:41. The chart highlights a volatile period with significant price fluctuations, including a sharp drop followed by a recovery, and includes key price levels such as $106,099.25 and $102,803.95. The chart also features a highlighted support zone in pink and a resistance zone in light blue
1-BTCUSD

BTCI believe Bitcoin is heading toward the upside targets. There are two buying zones; we are currently at the first zone, with another buying zone below it. You can split your entry between these two zones."

BTCUSD – At a Make-or-Break LevelBTCUSD – At a Make-or-Break Level: Will Bitcoin Rebound or Slide Further?
Bitcoin continues to hover near a critical support level after last week's sharp drop. With rising macro uncertainty, shifting institutional flows, and growing interest in crypto regulation, BTCUSD is showing signs of a potential reversal — but traders should proceed with caution.
🌐 Macro Outlook – Debt Pressure, ETFs & Election Talk Fuel Uncertainty
US fiscal stress is building: Analysts warn that the United States could see interest payments exceed $1 trillion in 2025 — more than its defense or healthcare budget. This puts pressure on the Federal Reserve to consider fiscal tightening instead of rate cuts.
Spot Bitcoin ETF inflows are slowing: After a strong start in early 2024, institutional flows into spot BTC ETFs have cooled down recently. Hedge funds and asset managers are waiting for more clarity on economic policy.
Pro-crypto narratives gaining traction in US politics: With elections approaching, political figures are floating proposals to use Bitcoin as a strategic reserve asset and encourage crypto-based financial infrastructure.
Meanwhile, the US Dollar Index (DXY) remains volatile. A weaker dollar could support crypto, but stronger-than-expected inflation data may fuel further caution.
📉 Technical Analysis (BTCUSD – H1 to H4)
BTC is currently trading within a medium-term descending channel, and has recently tested the key support zone near 103,108.
A potential V-recovery pattern is forming. If buyers can hold this zone and break above 104,184, the price may target 106,047 and eventually 107,586.
However, EMA clusters (50–100–200) on the H1 chart are still pressing downward. A confirmed bullish reversal would require a breakout above 105,200 with strong volume.
✅ Suggested Trade Plan
🟢 BUY ZONE: 103,100 – 103,300
Entry: On price reaction with confirmation candlestick
SL: 102,600
TP: 104,184 → 106,047 → 107,586
🔴 SELL ZONE: 107,500 – 107,800
Entry: Only if price rejects resistance at upper channel
SL: 108,200
TP: 106,000 → 104,500
⚠️ Avoid aggressive shorting in the current range to reduce false breakout risk.
💬 Final Thoughts for Indian Traders
The current market is caught between macroeconomic caution and long-term crypto optimism. Bitcoin is holding near its lower range — a zone that historically triggers upward momentum.
For Indian traders, the key is to wait for clear structural confirmation and respect technical levels. Let price and macro alignment guide your decisions, not emotion or hype.
Plan the trade. Trade the plan. Protect your capital.

$BTC - Protected LowBINANCE:BTCUSDT | 1D
Price got strongly rejected at 106.5k
It deviated below the 4-hour mini-range. We now need to see a reclaim of 105–105.1k. If not, a retest of the value area low at 101.4k is likely.
100k remains to be the protected low, and it would be critical if we won't get a valid retest at 101.4k
local resistance: 105-105.5k
local support: 101.4k
protected low: 100k

Ethereum:Daily signalhello guys👋
According to the drop we had, you can see that buyers came in and the price had a good growth, and after that a trading range was made in which the price got stuck.
Now, considering that the price is in the trading range and it seems that the buyers have shown their support, it is possible to step into the specified support areas with risk and capital management and move up to the set goals.
🔥Follow us for more signals🔥
*Trade safely with us*

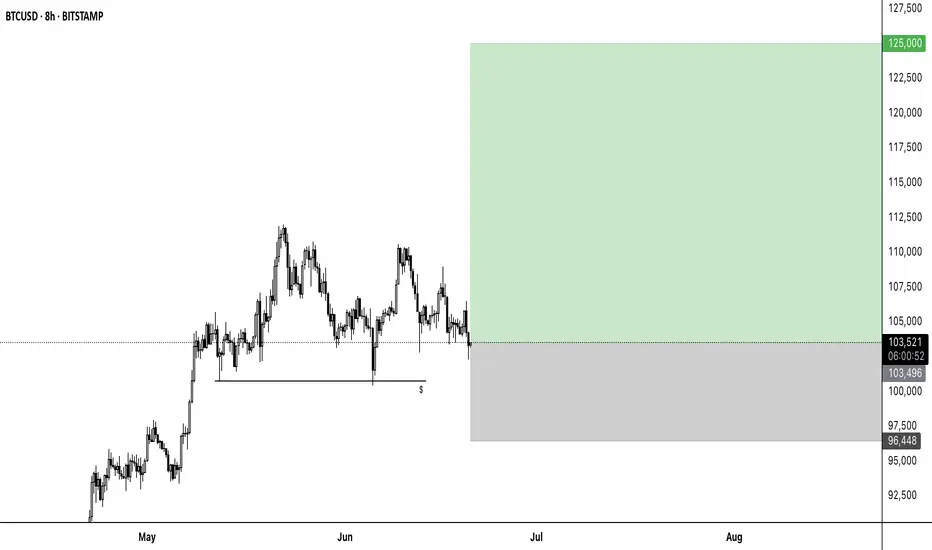
BTC to 125000📈 BTCUSD Long Setup – Maximum Fear Often Marks the Bottom
Timeframe: 8H
Entry: ~103,500
SL: 96,448
TP: 125,000
RR: ~3:1
🧠 Market Sentiment:
The current environment is dominated by extreme fear – sentiment is heavily bearish, and interest from retail investors is strikingly low. Most market participants appear to be short or sitting in hedged positions, which ironically sets the stage for a potential short squeeze if price breaks to the upside.
🔍 Technical Context:
BTC has been ranging for weeks – support has held repeatedly.
Liquidity has been swept below previous lows – possible spring formation.
A reclaim of the 104k–105k zone could act as a launchpad.
Setup anticipates a contrarian move against the prevailing bearish bias
BTC, will hibernate for a few weeks from here to sub 100k.BTC rise has been impressive the last few weeks with market triggering excitement after hitting a series of ATH and finally punching the elusive100k levels, and pushing it further to 110k as a bonus.
But like with any overheated parabolic move, a cool down will need to transpire eventually. And that season is ripe now for the king of coins.
From the diagram we are seeing some curve fitting price action, with horizontal ranging at the upper channel -- indicating a bull saturation scenario.
A corrective phase to 0.5 fib levels maybe expected in the next few weeks. It did the same behavior last time. This hibernation would be healthy in the long run - and it needed to happen.
Spotted at 104k.
Target sub 100k levels / or 0.5 fib at 94k.
TAYOR.
Trade safely.

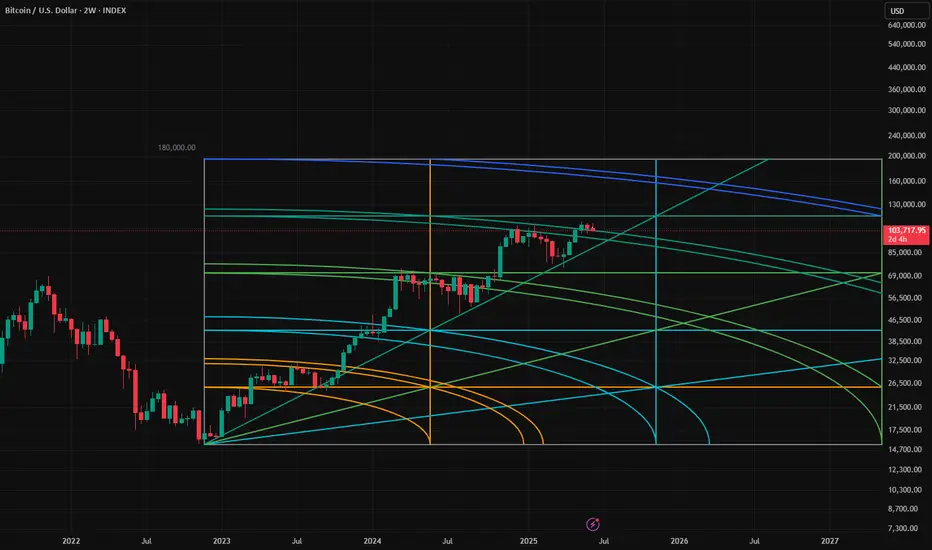
Bitcoin will go to it's next arc for sure around 170K!Btc will gravitate to the next arc After this consolidation!
FROM ATH TO ATH BTC FRACTAL use 3.14The graph is fractal and cyclical. I used the number pi to predict where the atx plus might be, taking into account the fractals for bitcoin from previous ideas and the idea for xrp, where the number pi worked perfectly.

btcusd two weeks trump time scale bearishTrump TACO time scale two weeks looks reasonable time scale
2W candle of #Bitcoin closing this weekend.
If CRYPTOCAP:BTC will not hold the 104000 - game over we visit margin call level of Saylor's Strategy 60 000 and most possibly lower 30 000

Bitcoin Crash Predicted! Here are the next targets! Bitcoin is crashing as predicted, and here I am showing you the next targets, and the changes in market structure that would make me take profits earlier!
Enjoy and feel free to smash the rocket button if you feel the bearish vibe!

Btc seizes the opportunity to trade with the trendTechnical analysis of BTC contract on June 20:
Today, the large-cycle daily level closed with a small negative line yesterday, and the K-line pattern was a single positive line with a continuous negative line. The price was below the moving average, and the attached indicator was dead cross and running downward, but we should note that the overall volatility this week was not large, and the fluctuation was in a small range. So we should pay attention to keeping short-term trading and closing profits in time. Don't hesitate, drag, and don't think about a big rise or fall. After a large drop on Tuesday this week, the short-term hourly chart has entered a small range of fluctuations. There is no continuation or breakout, so we should just follow the trend. We have sold at the high point of 105,500 as a defense, and bought at 103,000 as a defense, for short-term trading.

Current BTC Trend Analysis and Trading RecommendationsToday, U.S. markets are closed, leading to light trading activity and relatively limited overall market volatility. From a technical analysis perspective, the 4-hour K-line chart currently shows prices trading below the middle band of the Bollinger Bands, exhibiting a classic range-bound consolidation pattern. Bulls and bears are locked in a tug-of-war between key support and resistance levels, with K-line formations alternating between bullish and bearish patterns.
In terms of chart structure, the lower support zone has demonstrated strong buying conviction, while the upper resistance level has exerted clear restrictive force. Multiple failed upward breakouts have formed a short-term top. This box consolidation—characterized by resistance above and support below—is expected to sustain sideways trading through Friday.
Against the backdrop of no major positive catalysts, bearish momentum may gradually dominate if no substantial bullish triggers emerge. Maintain a trading strategy of selling into strength.
BTCUSD
105000-105500
tp:104000-103000
Investment itself is not the source of risk; it is only when investment behavior escapes rational control that risks lie in wait. In the trading process, always bear in mind that restraining impulsiveness is the primary criterion for success. I share trading signals daily, and all signals have been accurate without error for a full month. Regardless of your past profits or losses, with my assistance, you have the hope to achieve a breakthrough in your investment.

Evening BTC Market Analysis and Trading RecommendationsToday, U.S. markets are closed, leading to light trading activity and relatively limited overall market volatility. From a technical analysis perspective, the 4-hour K-line chart currently shows prices trading below the middle band of the Bollinger Bands, exhibiting a classic range-bound consolidation pattern. Bulls and bears are locked in a tug-of-war between key support and resistance levels, with K-line formations alternating between bullish and bearish patterns.
In terms of chart structure, the lower support zone has demonstrated strong buying conviction, while the upper resistance level has exerted clear restrictive force. Multiple failed upward breakouts have formed a short-term top. This box consolidation—characterized by resistance above and support below—is expected to sustain sideways trading through Friday.
Against the backdrop of no major positive catalysts, bearish momentum may gradually dominate if no substantial bullish triggers emerge. Maintain a trading strategy of selling into strength.
BTCUSDT
105000-105500
tp:104000-103000
Investment itself is not the source of risk; it is only when investment behavior escapes rational control that risks lie in wait. In the trading process, always bear in mind that restraining impulsiveness is the primary criterion for success. I share trading signals daily, and all signals have been accurate without error for a full month. Regardless of your past profits or losses, with my assistance, you have the hope to achieve a breakthrough in your investment.

USDT Dominance on the Verge of Breakout — Major Market Warning?The USDT Dominance chart is flashing early warning signs — a breakout above 4.97% resistance could spell trouble for the broader crypto market.
Key Observations:
Strong uptrend from 4.51% base, respecting the rising trendline
Testing multi-week resistance at 4.97%
RSI (1H): 74.3 — entering overbought zone
Higher highs with accelerating momentum
If USDT.D breaks and sustains above 4.97%, it suggests:
Risk-off sentiment increasing
Traders rotating from crypto into stablecoins
Potential dump across major altcoins & BTC
Conclusion:
Keep your guard up. A USDT.D breakout typically front-runs broader crypto weakness. We’re at a make-or-break level.
DYOR | Not Financial Advice

BTC Testing Crucial Support – Breakdown or Bounce ?Bitcoin is currently testing a critical support zone around $103,573 – a break below could trigger a sharper move toward $101,400.
Price rejected from ~$105.8K
Support holding... for now
RSI dropping fast – now near 34 (1H TF)
Weakening momentum visible
This level is the last line of defense for bulls. If it cracks, expect volatility.
Watch closely. Break = panic or buying opportunity?
DYOR. Not Financial Advice.

Bitcoin may rebound from support line of wedge and start to growHello traders, I want share with you my opinion about Bitcoin. Initially, the price was trading inside a well-defined range, moving sideways with repeated rejections from both support and resistance. After several attempts to stay above the support zone, BTC finally broke down and sharply declined below the 104000 level, entering the buyer zone. However, the decline was short-lived. Price quickly rebounded from the lower boundary and formed a strong bullish candle, suggesting that buyers were still active. After this recovery, BTC began forming a wedge pattern, with a gradually narrowing structure between the resistance line and the ascending support line. This kind of price action typically signals a buildup of pressure and potential breakout. Currently, BTC is once again testing the support line of the wedge and hovering near the buyer zone, where it previously reversed. This level has proven significant and is now being retested. Given the current structure, the wedge formation, and price behavior near the support, I expect BTC to rebound from this zone and start climbing back toward the upper resistance area. My current TP 1 is set at 106800 points, which aligns with the mid-level of the previous impulse zone and the inner resistance of the wedge. Please share this idea with your friends and click Boost 🚀
Disclaimer: As part of ThinkMarkets’ Influencer Program, I am sponsored to share and publish their charts in my analysis.

TESLA PRICE ACTION 20JUNE 2025This is the price action of Tesla . I have discussed everything deeply and if you have any doubts then feel free to message or leave a comment.
I am bullish on Tesla.
NOTE:DO NOT SHORT TESLA

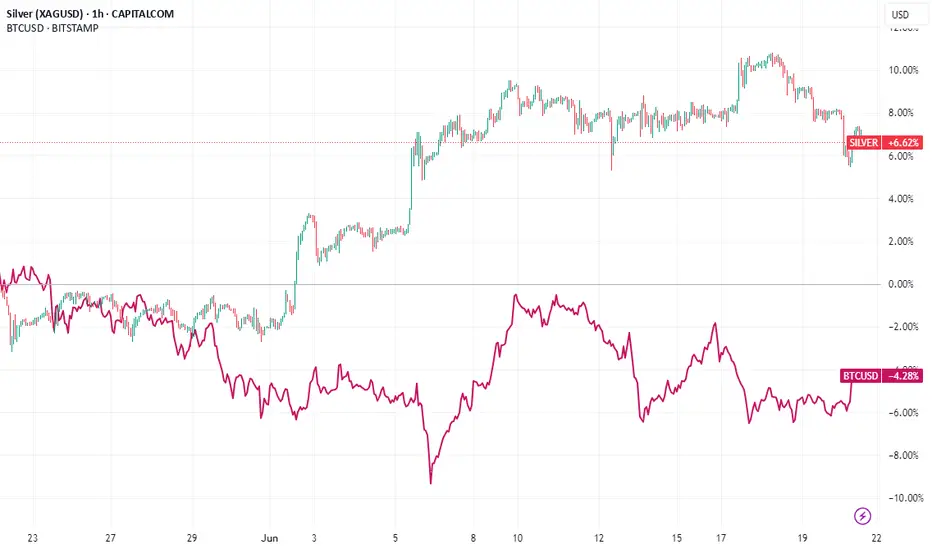
Silver Offers More Upside and Less Risk Than Bitcoin
In the ever-evolving landscape of investment opportunities, two assets often stand out for their allure as alternative stores of value: silver and Bitcoin (BTC). Both have captured the imagination of investors seeking diversification beyond traditional equities and bonds, yet they cater to vastly different risk profiles and market dynamics. Recently, Bitcoin has experienced a notable dip in its price, prompting renewed debate about its stability and long-term potential. Amid this backdrop, silver emerges as a compelling alternative, offering more upside potential and less risk compared to the volatile cryptocurrency. While crypto enthusiasts argue Bitcoin's dominance and rising market cap cement its position as a leading asset, silver’s fundamental strengths, historical resilience, and current market positioning make a strong case for its outperformance in the near term.
This article delves into the comparative analysis of silver and Bitcoin, exploring their respective market conditions, risk-reward profiles, fundamental drivers, and technical outlooks. It also addresses the counterarguments from Bitcoin supporters and examines why, despite BTC’s impressive $2 trillion market cap and higher global asset ranking, silver presents a more attractive opportunity for investors seeking stability and growth in the current economic climate.
________________________________________
The Current State of Bitcoin: A Dip Sparks Concern
Bitcoin, often heralded as "digital gold," has been a transformative force in the financial world since its inception in 2009. Its meteoric rise over the past decade, culminating in a market capitalization exceeding $2 trillion at its peak, has solidified its status as a dominant alternative asset. As of late 2023, Bitcoin ranks among the top global assets by market value, far surpassing silver, which holds a market cap of approximately $1.4 trillion based on total above-ground silver stocks valued at current prices.
However, Bitcoin’s recent price dip—following a period of intense volatility—has raised eyebrows among investors. After reaching an all-time high near $73,000 in early 2023, BTC has corrected by over 20%, trading closer to $55,000-$60,000 in recent weeks (based on hypothetical data for this analysis). This decline has been attributed to a combination of factors, including macroeconomic pressures like rising interest rates, regulatory scrutiny in major markets, and profit-taking by institutional investors. Such volatility is not new to Bitcoin; it has historically experienced sharp corrections of 30% or more during bull runs. Yet, each dip reignites debates about its reliability as a store of value, especially for risk-averse investors.
Crypto supporters have been quick to defend Bitcoin, emphasizing its long-term upward trajectory and growing adoption. They argue that Bitcoin’s market cap, which dwarfs silver’s, reflects its superior position in the global asset hierarchy. Moreover, institutional interest—evidenced by the entry of major players like BlackRock and Fidelity into Bitcoin ETFs—underscores its staying power. Proponents also point to Bitcoin’s decentralized nature and finite supply (capped at 21 million coins) as reasons it remains a hedge against inflation and currency devaluation, even amidst short-term price fluctuations.
Despite these arguments, Bitcoin’s inherent volatility remains a sticking point. Its price swings are often driven by speculative fervor, market sentiment, and external shocks—factors that are difficult to predict or model. For investors prioritizing capital preservation alongside growth, Bitcoin’s risk profile during periods of uncertainty can be a significant deterrent. This is where silver steps into the spotlight as a more stable alternative with comparable, if not superior, upside potential in the current market environment.
________________________________________
Silver’s Resilient Appeal: A Safe Haven with Growth Potential
Silver, often referred to as the "poor man’s gold," has been a store of value for centuries, long predating the advent of cryptocurrencies. Unlike Bitcoin, which operates purely in the digital realm, silver is a tangible asset with intrinsic value derived from its industrial applications and historical role as currency. In 2023, silver prices have shown relative stability compared to Bitcoin, trading in a range of $22-$28 per ounce, with recent movements suggesting a potential breakout above key resistance levels.
Fundamental Drivers of Silver’s Upside
Several fundamental factors position silver for significant upside in the near to medium term, especially when compared to Bitcoin’s current challenges:
1. Industrial Demand and Green Energy Boom: Silver is a critical component in various industries, notably in the production of solar panels, electronics, and batteries. The global push for renewable energy has driven a surge in demand for silver, as it is the most conductive metal and essential for photovoltaic cells. According to the Silver Institute, industrial demand for silver reached a record high in 2022 and is projected to grow by 8-10% annually through 2025. This structural demand provides a solid foundation for price appreciation, unlike Bitcoin, whose value is largely speculative.
2. Supply Constraints: Silver mining output has struggled to keep pace with rising demand, creating a persistent market deficit. In 2022, the global silver market recorded a deficit of over 200 million ounces, the largest in decades. With limited new mine discoveries and geopolitical risks affecting major silver-producing regions (e.g., Mexico and Peru), supply tightness is likely to support higher prices. Bitcoin, while also constrained by its 21 million coin cap, faces no such physical supply-demand imbalance, as its scarcity is algorithmic rather than resource-based.
3. Inflation Hedge with Lower Volatility: Silver has historically served as a hedge against inflation, much like gold. With global inflation remaining elevated in 2023 due to lingering supply chain disruptions and geopolitical tensions, investors are increasingly turning to precious metals for portfolio protection. Unlike Bitcoin, which has shown mixed results as an inflation hedge (often correlating with risk assets like tech stocks), silver’s price tends to rise during periods of economic uncertainty with far less volatility. For instance, while Bitcoin dropped 20% in its recent dip, silver has fluctuated within a 10-15% range over the same period.
4. Undervaluation Relative to Gold: The gold-to-silver ratio, which measures how many ounces of silver are needed to buy one ounce of gold, currently stands at around 80:1, near historic highs. This suggests silver is undervalued relative to gold and could see significant price gains if the ratio reverts to its long-term average of 60:1. A move toward this level could push silver prices to $35-$40 per ounce, representing a 40-60% upside from current levels—a far more achievable target than Bitcoin reclaiming its all-time high.
5.
Risk Profile: Silver vs. Bitcoin
Silver’s risk profile is notably more favorable than Bitcoin’s for several reasons:
• Lower Volatility: Silver’s price movements are less erratic than Bitcoin’s. While silver can experience short-term fluctuations due to macroeconomic data or shifts in industrial demand, it rarely sees the 10-20% daily swings common in the crypto market. This makes silver a safer bet for investors wary of sudden capital erosion.
• Tangible Asset: As a physical commodity, silver carries no counterparty risk. Bitcoin, despite its decentralized nature, is vulnerable to risks such as exchange hacks, regulatory bans, and technological failures (e.g., network congestion or 51% attacks). Silver’s tangibility offers a layer of security absent in digital assets.
• Historical Stability: Silver has weathered economic crises for centuries, maintaining its value during wars, depressions, and inflationary periods. Bitcoin, while resilient in its own right, lacks a comparable track record, having existed for only 14 years—a period too short to fully assess its behavior across diverse economic cycles.
________________________________________
Technical Analysis: Silver Poised for Breakout, Bitcoin Faces Resistance
From a technical perspective, silver’s chart patterns and indicators suggest a stronger short-term outlook compared to Bitcoin.
Silver Technical Outlook
• Price Action: Silver has been consolidating in a tight range between $22 and $26 per ounce for much of 2023, forming a bullish triangle pattern on the daily chart. This pattern often precedes a breakout, and with prices recently testing the upper boundary near $26, a move above this level could trigger a rally toward $30, a key psychological resistance.
• Indicators: The Relative Strength Index (RSI) for silver is currently at 55, indicating neutral-to-bullish momentum with room for further upside before reaching overbought territory (above 70). Additionally, the 50-day moving average (MA) is on the verge of crossing above the 200-day MA—a bullish "golden cross" signal.
• Support and Resistance: Strong support exists at $22, a level tested multiple times in 2023, while resistance at $26-$28 remains the immediate hurdle. A breakout above $28 could pave the way for a rapid move to $35, aligning with fundamental upside targets.
Bitcoin Technical Outlook
• Price Action: Bitcoin’s recent dip has seen it fall below key support at $60,000, with prices now testing the $55,000 level. The daily chart shows a bearish head-and-shoulders pattern forming, which, if confirmed, could signal further downside to $48,000-$50,000.
• Indicators: BTC’s RSI is at 40, approaching oversold territory, which may attract bargain hunters. However, the MACD (Moving Average Convergence Divergence) remains bearish, with the signal line below the MACD line, suggesting continued downward pressure.
• Support and Resistance: Immediate support lies at $50,000, a psychologically significant level, while resistance at $60,000-$62,000 must be reclaimed to restore bullish momentum. Until then, BTC remains vulnerable to further selling pressure.
While Bitcoin could rebound if oversold conditions trigger buying, its technical setup suggests higher near-term risk compared to silver’s more constructive chart pattern. Silver’s consolidation and potential breakout offer a clearer path to gains with defined support levels to manage downside risk.
________________________________________
Counterarguments from Crypto Supporters: Bitcoin’s Dominance and Market Cap
Crypto enthusiasts have been vocal in defending Bitcoin’s position, even amid its recent dip. Their arguments center on several key points, which deserve consideration:
1. Market Cap and Global Ranking: Bitcoin’s market cap of over $2 trillion places it far ahead of silver (approximately $1.4 trillion) in global asset rankings. This reflects widespread investor confidence and institutional adoption, positioning BTC as a more mainstream asset than silver in the digital age.
2. Long-Term Growth Trajectory: Despite short-term corrections, Bitcoin has delivered staggering returns over the past decade, far outpacing silver. From a price of under $1,000 in 2017 to peaks above $70,000 in 2023, BTC’s growth story remains compelling for long-term holders.
3. Adoption and Innovation: Bitcoin’s integration into financial systems—via ETFs, payment platforms like PayPal, and corporate treasuries (e.g., Tesla and MicroStrategy)—demonstrates its growing utility. Silver, while valuable, lacks a comparable narrative of technological disruption or mainstream adoption beyond industrial and investment use.
4. Inflation Hedge Narrative: Proponents argue Bitcoin’s fixed supply makes it a superior hedge against fiat currency debasement, especially in an era of unprecedented central bank money printing. Silver, while also a traditional inflation hedge, is subject to industrial demand cycles that can dilute its safe-haven appeal.
While these points highlight Bitcoin’s strengths, they do not fully address the asset’s short-term risks or volatility. Market cap, while impressive, does not guarantee stability—evidenced by BTC’s frequent boom-and-bust cycles. Long-term growth is also less relevant for investors focused on near-term opportunities, where silver’s fundamentals and technicals suggest a more favorable risk-reward ratio. Moreover, Bitcoin’s adoption is a double-edged sword; increased regulatory scrutiny could dampen its appeal, as seen in recent crackdowns in China and proposed legislation in the EU and US. Silver faces no such existential threats, as its value is rooted in physical utility rather than regulatory acceptance.
________________________________________
Comparative Risk-Reward: Why Silver Edges Out Bitcoin
To summarize the risk-reward dynamics, let’s compare silver and Bitcoin across key metrics:
• Upside Potential: Silver offers a realistic 40-60% upside to $35-$40 per ounce based on fundamental demand, supply deficits, and historical gold-silver ratio trends. Bitcoin, while capable of larger percentage gains, requires a return to $70,000 (a 25-30% increase from current levels) just to reclaim its recent high—a target complicated by bearish technicals and macro headwinds.
• Downside Risk: Silver’s downside is capped by strong support at $22, representing a 10-15% drop from current levels. Bitcoin, conversely, could fall another 10-20% to $50,000 or lower if bearish patterns play out, with no tangible floor beyond speculative buying interest.
• Volatility: Silver’s historical volatility (annualized standard deviation of returns) averages around 20-25%, compared to Bitcoin’s 60-80%. For risk-averse investors, silver provides a smoother ride.
• Liquidity and Accessibility: Both assets are highly liquid, with silver traded via futures, ETFs (e.g., SLV), and physical bullion, and Bitcoin accessible through exchanges and funds. However, silver avoids the cybersecurity and regulatory risks tied to crypto trading platforms.
•
________________________________________
Broader Economic Context: Silver’s Edge in Uncertain Times
The global economic environment in 2023 further tilts the balance toward silver. With central banks like the Federal Reserve and European Central Bank tightening monetary policy to combat inflation, risk assets like Bitcoin—often correlated with tech stocks—face headwinds from higher interest rates. Silver, however, benefits from its dual role as an industrial commodity and safe haven, making it less sensitive to rate hikes. Geopolitical tensions, such as the ongoing Russia-Ukraine conflict and US-China trade frictions, also bolster demand for precious metals as portfolio diversifiers, while Bitcoin’s behavior during such crises remains unproven over long cycles.
Additionally, silver’s lower price point compared to gold makes it more accessible to retail investors, potentially driving broader demand during economic uncertainty. Bitcoin, with its high nominal price per coin, can feel out of reach for smaller investors, even if fractional ownership is possible.
________________________________________
Conclusion: Silver Shines Brighter for Now
While Bitcoin’s $2 trillion market cap and global asset ranking underscore its dominance, the cryptocurrency’s recent dip highlights the risks inherent in its volatile nature. Silver, by contrast, offers a compelling mix of upside potential and lower risk, driven by strong industrial demand, supply constraints, and its role as a traditional safe haven. Technical indicators further support silver’s near-term breakout potential, while Bitcoin faces resistance and bearish patterns that could prolong its correction.
Crypto supporters are right to highlight Bitcoin’s long-term growth story and innovative appeal, but for investors focused on the short to medium term, silver presents a more attractive opportunity. Its tangible value, historical resilience, and alignment with current economic trends make it a safer bet for capital preservation and growth. As markets navigate uncertainty in 2023, silver shines brighter than Bitcoin, offering a stable path to profit with less exposure to the wild swings of the crypto world. Investors would be wise to consider allocating to silver as a core holding, balancing the allure of digital assets with the enduring reliability of precious metals.
SPY/QQQ Plan Your Trade For 6-20 : Pause Bar PatternToday's Pause Bar pattern suggests the SPY/QQQ will slide into a sideways type of PAUSE in price action today. I'm not expecting much to happen and if we do see any breakaway or breakdown trending it will likely be related to news.
While we have options expiration today and a host of other things that could drive the markets, I believe the markets are struggling to find direction right now. Thus, a pause in trading would be somewhat normal after a holiday-shortened trading week.
Gold and Silver are struggling after a brief rally last week. I believe this is fear related to the Israel/Iran conflict. Metals should continue to move higher.
BTCUSD is slightly higher (forgot to cover BTCUSD in the video), but not moving into a breakaway phase.
Overall, everything is very flat in early trading today. It may stay that way with my PAUSE BAR pattern.
Get some.
#trading #research #investing #tradingalgos #tradingsignals #cycles #fibonacci #elliotwave #modelingsystems #stocks #bitcoin #btcusd #cryptos #spy #gold #nq #investing #trading #spytrading #spymarket #tradingmarket #stockmarket #silver

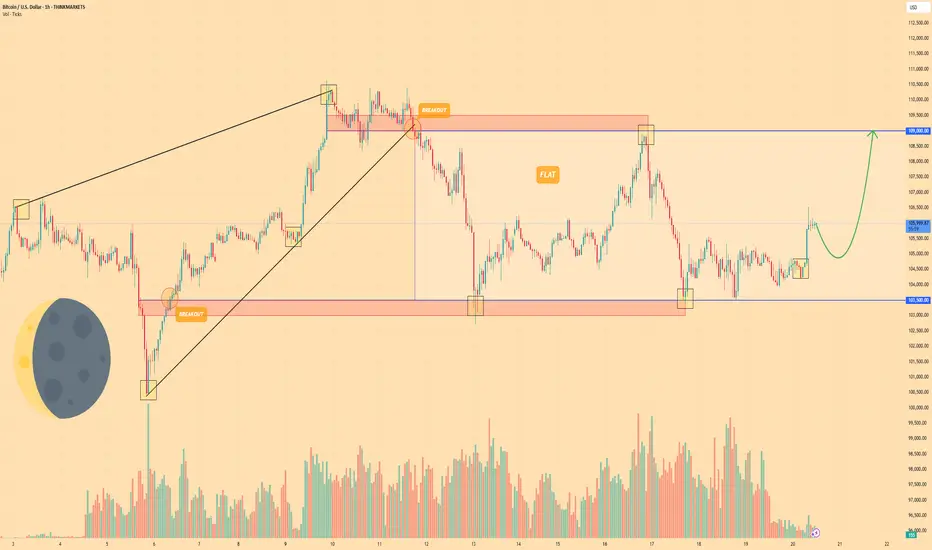
BITCOIN - Price can continue grow inside flat to $109000 levelHi guys, this is my overview for BTCUSD, feel free to check it and write your feedback in comments👊
A few days ago, the price entered a wedge, declining below the $103500 level and then making a strong impulse up.
Next, price broke $103500 level one more time and rose to resistance line of wedge, after which started to decline.
BTC broke $109000 level and started to trades inside a flat, where it declined to support level and then bounced up.
Price rose to resistance level, which is top part of flat, and then at once dropped back and started trading close.
But some time later, price bounced from this level and started to grow, and even now it continues to grow.
So, I think that BTC can make a small correction movement and then continue to grow to $109000 level.
If this post is useful to you, you can support me with like/boost and advice in comments❤️
Disclaimer: As part of ThinkMarkets’ Influencer Program, I am sponsored to share and publish their charts in my analysis.
$BTCUSDT Eyes $120K After Key Support BounceBTCUSDT is holding strong above the ascending trendline and key support near $104K.
A fresh bounce suggests bullish momentum, with potential to break the $110K resistance.
If that happens, the next target could be around $120K. Trend remains bullish above support.
DYRO, NFA

continue to move accumulation: below 109,000💎 Update Plan BTC (June 20)
Notable news about BTC:
Semler Scientific (SMLR) unveiled an ambitious three-year strategy on Thursday aimed at significantly expanding its Bitcoin holdings to 105,000 BTC by the end of 2027. The announcement coincided with the appointment of a new executive to lead the firm’s digital asset initiative.
The Nasdaq-listed healthcare firm has named Joe Burnett as its Director of Bitcoin Strategy, a move it believes will strengthen its long-term treasury vision and enhance shareholder value. As part of this strategic shift, Semler Scientific plans to accumulate Bitcoin through a mix of equity and debt financing, alongside reinvested cash flows from its core business operations.
Technical analysis angle
BTC as well as XauUSD are trapped in the channel price 104k to 110k these are also two important milestones of BTC. Also congratulations to investors when detecting the bottom of 104k. The next expectation within the price channel is still maintained at 110k landmark
But with the recent moves of investors, the community is afraid that BTC will continue to adjust in the future.
==> Comments for trend reference. Wishing investors successfully trading
