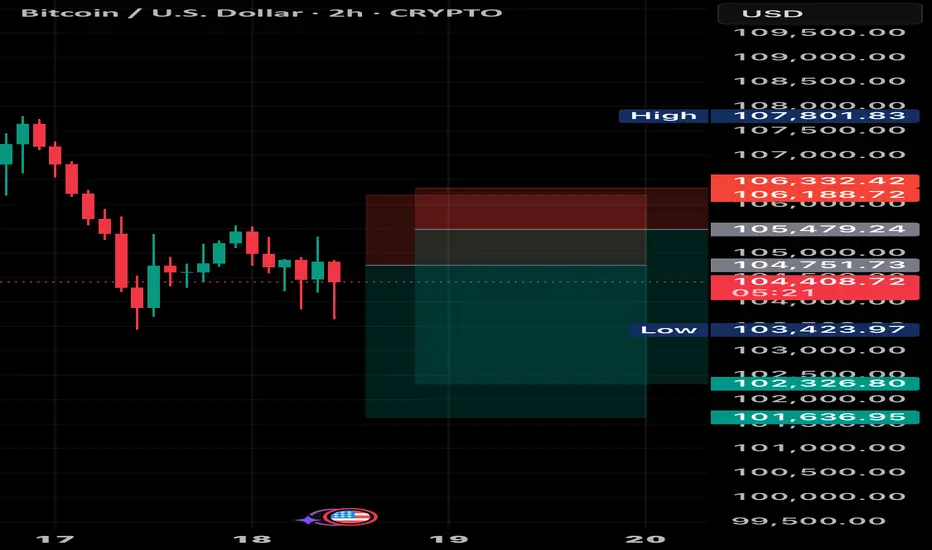
Bitcoin (BTC/USD) 2-Hour Candlestick Chart2-hour candlestick price movement of Bitcoin (BTC) against the U.S. Dollar (USD) as of June 20, 2025. The current price is $106,004.49, reflecting a 2-hour increase of $1,317.33 (+1.26%). The chart highlights a recent upward trend with a support level around $105,082.06 and resistance near $108,009.17. A shaded area indicates a potential price range, with a bullish projection suggested by the overlaid trendline.
1-BTCUSD

BTC SHORT TP:102,200 18-06-2025Let’s keep it simple: this pump looks fake.
I’m entering SHORT between 104,550 and 105,500, aiming for a target between 101,300 and 102,300. Average RR: 3.4 — solid and clean.
⏱️ Timeframe: 2H
⏳ Estimated duration: 12 to 24 hours
⚠️ Context: Bearish continuation — let’s ride the wave, not the noise.
Use your stop-loss based on your risk strategy. If price doesn’t move within the expected time, the setup is invalid.
We don’t use indicators, we’re not out here drawing lines or cute little shapes — I just give you a clean trade.
BITCOIN (BTCUSD): Strong Bullish Confirmation?!
Bitcoin has a high chance to rise more, following
a strong bullish reaction to a rising trend line on a 4H.
Goal - 108000
❤️Please, support my work with like, thank you!❤️

BITCOIN This is the long-term picture. Don't get distracted.Bitcoin (BTCUSD) has been consolidating lately after making a new All Time High (ATH) last month and this is already making part of the market nervous over whether that's the Cycle Top or not.
This is one of those times when it would be best to ignore the short-term noise/ volatility and stick to the long-term picture. And that's exactly what's shown on this chart, with BTC on the 1M time-frame showing the incredible symmetry among its 4-year Cycles, with Bear Markets lasting 12 - 13 months and Bull Markets 35.
Based on that, this Cycle's Top is expected to be priced by October (2025). This also matches the Sine Waves as implied by the 1M RSI, which as been trading within a Channel Down (diminishing returns) since Bitcoin's inception.
So do you also think that we have around 4 months before the market tops? Feel free to let us know in the comments section below!
-------------------------------------------------------------------------------
** Please LIKE 👍, FOLLOW ✅, SHARE 🙌 and COMMENT ✍ if you enjoy this idea! Also share your ideas and charts in the comments section below! This is best way to keep it relevant, support us, keep the content here free and allow the idea to reach as many people as possible. **
-------------------------------------------------------------------------------
💸💸💸💸💸💸
👇 👇 👇 👇 👇 👇

BTC is squeezing between descending resistance.📊 BTC/USDT – 1H Chart Analysis: The Calm Before the Storm?
Bitcoin is currently coiling within a symmetrical triangle on the 1-hour chart – a technical pattern that often signals a strong breakout is just around the corner. The market is compressing, and momentum is building.
🔍 Key Levels to Watch:
🔹 Symmetrical Triangle:
BTC is squeezing between descending resistance and ascending support. This equilibrium usually doesn’t last long – expect a sharp move soon.
🔹 Demand Zone ($$$ / BPR):
A solid floor is forming near the BPR (Bullish Price Range), signaling potential buyer interest and liquidity resting just below.
🔹 Fair Value Gap (FVG):
To the upside, BTC is facing a liquidity pocket (FVG) that could act as a magnet if bulls take control.
⚡ Potential Scenarios:
📈 Bullish Breakout: A break and close above the triangle could trigger a rally towards the $105K–$106K zone. Watch for volume to confirm!
📉 Bearish Breakdown: Losing the lower trendline support might send BTC into a deeper correction toward previous demand zones.
🧠 Final Thoughts:
We're approaching a critical inflection point. The triangle is narrowing, and Wednesday, June 25 could be the date the market decides. Both bulls and bears should prepare for volatility.
🚨 As always: This is not financial advice.
🧠 DYOR – Do Your Own Research.
Manage risk. Trade smart. Stay sharp. 💹

The Importance of the 104463.99 Point
Hello, traders.
Please "Follow" to get the latest information quickly.
Have a nice day today.
-------------------------------------
(BTCUSDT 1D chart)
This volatility period is around June 22nd (June 21-23rd).
Therefore, waves can be generated at any time during the volatility period.
The 104463.99 point is the DOM (60) indicator point of the 1W chart, which corresponds to the end of the high point of the 1W chart.
Therefore, it seems that the price defense is being done well.
I think that defending the price at the high point is significant because it raises expectations for further increase.
-
If it falls after a period of volatility, there is a possibility that it will meet the M-Signal indicator of the 1W chart, and I think the important point at that time is the 99705.62 point.
Therefore, when it falls, you need to check whether the M-Signal indicator of the 1W chart rises to around 99705.62 and whether it is supported.
-
Even if it rises after receiving support near 104463.99, the key is whether it can maintain the price by rising above 108316.90.
The 108316.90 point is the HA-High indicator point of the 1D chart, which corresponds to the middle value of the high point range.
Therefore, in order to continue the uptrend, it must be supported and rise in the 108316.90-111696.21 range.
Currently, both the Low Line and High Line of the auxiliary indicator OBV are showing a downward trend.
Therefore, in order for the uptrend to begin, OBV must rise above the High Line and be maintained.
If not, it is highly likely that it will fall due to selling pressure.
One hopeful(?) thing is that the PVT oscillator is showing an overall upward trend.
(Changed from OBV oscillator to PVT oscillator.)
Therefore, we can see how important the area around 104463.99 is playing a role of support and resistance.
-
In my chart, the basic trading strategy is to buy near the HA-Low indicator and sell near the HA-High indicator.
Therefore, it is virtually impossible to create a trading strategy at the current price level.
In such cases, you should conduct trading through day trading or quick response.
If not, you may experience a lot of psychological fear and anxiety.
The basic time frame chart of all indicators is the 1D chart.
Therefore, if you cannot read the flow of the 1D chart, you are likely to end up getting faked and suffer losses.
Therefore, you should read the flow of the 1D chart and create a big picture of how to create a trading strategy, and respond in detail on the time frame chart below the 1D chart.
-
Thank you for reading to the end.
I hope you have a successful trade.
--------------------------------------------------
- This is an explanation of the big picture.
(3-year bull market, 1-year bear market pattern)
I will explain more details when the bear market starts.
------------------------------------------------------

BTC Triangle Squeezing Toward $100 K — Sellers Press🎯 TL;DR
A four-week contracting triangle is coiling price just under $105 K.
Measured move ⇒ $100 506
Both W.ARITAS Quantum RSI flash strong selling pressure while QSP shows a weak trend.
On-chain: miners dumped ≈30 000 BTC since late May, yet spot-ETF inflows have stayed positive eight days straight.
Base case: price breaks lower into $100 K-97 K, where I expect a sharp bounce.
🗺️ Chart at a Glance
Element Detail
Pattern Symmetrical / contracting triangle (late-Apr → present)
Immediate pivot $104 800 – reclaimed as resistance (red circle)
Target 1 $100 506 – triangle measured move
Demand block $96 900 – $95 000 – weekly support & June VWAP
Invalidation 6-h close > $106 000
🔧 Technical Internals
Momentum 🟣
Quantum RSI: −23 / −41 and falling → sellers dominate.
QSP: muted blue histogram sub-zero → trend itself is still weak, so expect whipsaws near support.
Structure 🔵
Three successive lower-highs (113 K → 110 K → 109 K) tighten the squeeze.
Price is riding the underside of the triangle, a common “kiss-of-death” before resolution.
🔍 Fundamental / Flow Backdrop
Miners on the offer – Wallet balances down ~30 000 BTC over 20 days (≈ $3.1 B)
Source: IntoTheBlock via CoinDesk, 19 Jun 2025
ETF demand refuses to quit – U.S. spot ETFs pulled $388.3 M on 18 Jun, marking 8 consecutive inflow days
Source: CoinTelegraph, Cryptonomist, 19 Jun 2025
Regulatory clarity incoming – U.S. Senate passed a bipartisan stablecoin bill on 17 Jun; House vote next
Source: Reuters, 17 Jun 2025
Net: structural sellers (miners, profit-takers) vs. structural buyers (ETFs).
Right now, technicals side with the sellers.
📈 Trade Map (3-8 Week Horizon)
106 000 – 104 800 Triangle top & failed breakout zone Bias flips bullish only on sustained reclaim
100 506 Measured-move target + psychological $100 K Primary TP / bounce watch
96 900 – 95 000 Weekly demand, June VWAP Secondary TP if 100 K gives way
110 000 + Pattern invalidation Opens road to 113 K-115 K ATH cluster
🛠️ Execution Idea (Not Financial Advice)
Trigger: 6-hour close < $103 500 confirms breakdown.
Entry Bias: Short retest of 104.8 K-105.5 K.
Targets:
TP1 – $100 500
TP2 – $97 000 (only if momentum stays bearish)
Stop / Invalidation: 6-hour close > $106 000 and Quantum RSI flips back to green.

BTCUSD: Israel-Iran conflict like October 2024.Despite the Middle East tension, Bitcoin remains long term bullish on its 1W technical outlook (RSI = 63.167, MACD = 6883.200, ADX = 33.150). It remains supported on its 1D MA50, in fact in the same manner it was during the previous Israel-Iran conflict. I was on October 26th 2024, when Israel launched three waves of strikes against 20 locations in Iran and other locations in Iraq, and Syria. Simila to the June 13th 2025 attacks. It is more than striking how similar the two price patterns are. Assisted by the U.S. elections on November 5th 2024, a massive rally followed the Middle East conflict. A repeat of that may very well send Bitcoin to $150,000 and above.
## If you like our free content follow our profile to get more daily ideas. ##
## Comments and likes are greatly appreciated. ##

Will Bitcoin Try New All Time High?Bitcoin's Volume Profile Support at 103,900 is holding.
Hold here (again) and likely another test for new ATH.
Breaking it means retrace down to the 94k-93k 50% Retracement + Volume Profile region.
Then, time comes into play with the tried and tested Bitcoin Daily Ichimoku Cloud Strategy. If Chikou (used as momentum) does not clear the cloud at the same time as price the bull trend is neutral but still intact.
If the move happens quickly the Support region is likely to hold and retest the highs once more in weeks to come...
2 situations reverse the trend to bearish:
1. Price moves quickly to sub-90k
2. Price moves more slowly to the 50%-VP region.
Both situations get Chikou out at the same time as price. Timing and price come together to flip the trend to bearish.
Trade Wisely

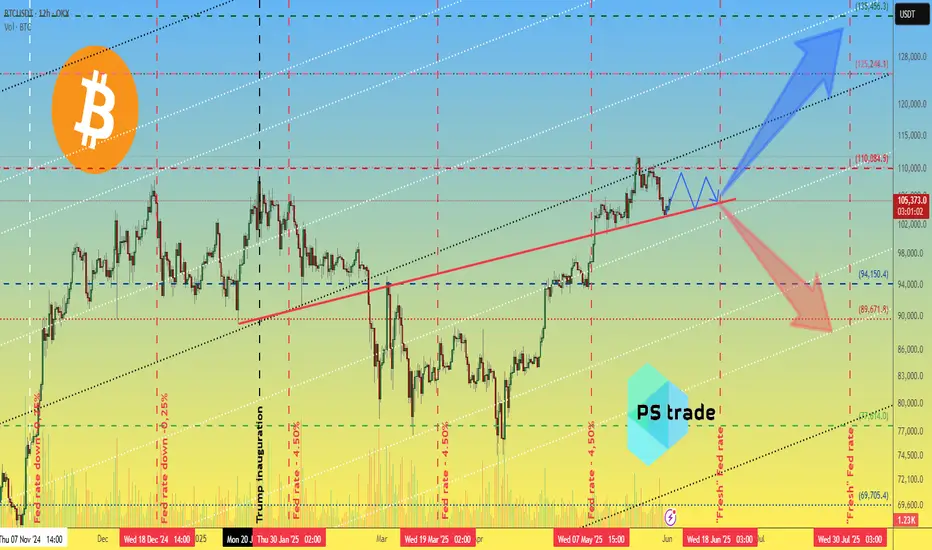
Bitcoin BTC price analysis🍿 At the OKX:BTCUSDT chart, we show one of the scenarios that could play out in the first half of June.
Much will be decided today with the opening of the US market. It is very likely that there will be a downward movement at the opening in response to the new tariffs announced by Trump on Friday after the markets closed.
🕯 Well, then we'll have to “keep our fingers crossed” that market players show their strength and hold on and buy back the drop — like say: we're tired of shaking with every crazy statement from Trump.
💰 If the price of CRYPTOCAP:BTC stays above $103k, there is a chance that it will be “stuck” in the $103-110k consolidation. The market needs to digest and redistribute the results of two months of #BTCUSD price growth from $75k to $112k.
And considering the position of the BTC.D and USDT.D indices, there is a chance that the “little bit” of capital will pass to the altcoins, and they will shoot up a little.
⁉️ Probably, the safest thing to do would be to watch the altcoins and buy only those that have started a significant upward movement with volume.
What do you think?
SPY/QQQ Plan Your Trade For 6-19: GAP Reversal Counter TrendToday's pattern is a GAP Reversal in Counter Trend mode. I believe this could represent a breakdown in the ES/NQ as the US stock market is closed for the Juneteenth holiday.
Obviously, after the Fed comments yesterday (stating "uncertainty") and with the continued Israel/Iran conflict playing out, it makes sense to me that the US markets would move into a pre-weekend consolidation phase.
Even though the US stock market will be closed, the futures market will likely stay open and will carry some general market sentiment and reactions to news.
Watching Gold/Silver and Bitcoin should be very interesting today. I suspect the markets will continue to consolidate downward today - leading to a potential breakdown seeking support day on Friday.
Buckle up. We'll likely have 3-5+ days of news related to the Israel/Iran conflict and other issues over this weekend. It could be very interesting to see how the global markets move through this news.
Get some.
Happy Juneteenth
#trading #research #investing #tradingalgos #tradingsignals #cycles #fibonacci #elliotwave #modelingsystems #stocks #bitcoin #btcusd #cryptos #spy #gold #nq #investing #trading #spytrading #spymarket #tradingmarket #stockmarket #silver

BTC-----Buy around 104900, target 106000 areaTechnical analysis of BTC contract on June 19:
Today, the large-cycle daily level closed with a small positive line yesterday, the K-line pattern was a single positive line with continuous negative lines, the price was below the moving average, and the attached indicator was dead cross. The general trend of the decline was still relatively obvious, but in trading, we should pay more attention to the rhythm of the price range in the shock, so the operation should be decisive, not greedy, and do a good job of risk control; the short-cycle hourly chart yesterday's intraday support was corrected upward, the European session fell but did not continue to break down, the price support rebounded in the early morning, the current K-line pattern was a single positive line with continuous positive lines, and the attached indicator was golden cross, so it is highly likely to break through yesterday's high of 105500 area within the day.
Today's BTC short-term contract trading strategy:
Buy at the current price of 104900 area, stop loss at 104000 area, and target 106000 area;

₿itcoin: Holding steadySince our last update, Bitcoin has traded in a relatively stable range. As expected, there's still a strong case for the crypto leader to climb into the upper blue Target Zone between $117,553 and $130,891. However, a deeper pullback below the $100,000 mark remains a real possibility before that move unfolds. Regardless of the path it takes, we continue to expect Bitcoin to reach this upper zone, completing green wave B. From there, a corrective wave C—also in green—is likely to follow, driving the price down toward the lower blue Target Zone between $62,395 and $51,323. This move would mark the end of the broader orange wave a. For now, we’re watching for a potential b-wave recovery before the final leg lower toward the bottom of blue wave (ii) takes shape. That said, there's still a 30% chance that blue wave (i) isn’t done yet and could extend significantly above $130,891 before any meaningful correction begins.
📈 Over 190 precise analyses, clear entry points, and defined Target Zones - that's what we do.

HolderStat┆BTCUSD forms a triangleBYBIT:BTCUSDT trades inside a narrowing flag between 104 k and 108 k. A push past 108 k activates the pole projection toward 112–114 k and possibly the ATH rail; rejection sends price to retest 102 k support before the next offensive.

Ascending Inverse H&S on the BTC weekly chartThe longer it takes to break above this neckline the higher the breakout target will be. I have arbitrarily placed the measured move line at July 18th 2025. If the breakout were to happen on that day the measured move target is around 208k, which could take quite awhile to reach or if we entered a truly hyperparabolic blow off top we could reach such a target way quicker than when the dotted measured move line reaches it. *not financial advice*

BITCOIN All boxes checked. Couldn't be more bullish than this!Bitcoin (BTCUSD) has filled numerous bullish conditions with the latest being holding the 1D MA50 (blue trend-line) as Support. This is basically the 3rd time testing and holding it since June 05. Even if that doesn't hold, we have the 1D MA200 (orange trend-line) directly below it as the ultimate long-term Support.
This trend-line just so happens to be exactly on the neckline of the Right Shoulder on the long-term Inverse Head and Shoulders (IH&S) pattern that has been in development since December 17 2024.
On top of all these, the market also formed a 1D Golden Cross a month ago, always a strong long-term bullish signal. IH&S patterns typically target their 2.0 Fibonacci extension, which sits at $168000.
Is that another indication that Bitcoin is going after 150k at least on its next run? Feel free to let us know in the comments section below!
-------------------------------------------------------------------------------
** Please LIKE 👍, FOLLOW ✅, SHARE 🙌 and COMMENT ✍ if you enjoy this idea! Also share your ideas and charts in the comments section below! This is best way to keep it relevant, support us, keep the content here free and allow the idea to reach as many people as possible. **
-------------------------------------------------------------------------------
💸💸💸💸💸💸
👇 👇 👇 👇 👇 👇

BTCUSD H4 I Bearish Reversal Off the 50% FibBased on the H4 chart, the price is rising toward our sell entry level at 106,291.54, a pullback resistance that aligns with the 50% Fib retracement.
Our take profit is set at 103,781.90, a swing low support.
The stop loss is set at 109.135.79, an overlap resistance.
High Risk Investment Warning
Trading Forex/CFDs on margin carries a high level of risk and may not be suitable for all investors. Leverage can work against you.
Stratos Markets Limited (tradu.com ):
CFDs are complex instruments and come with a high risk of losing money rapidly due to leverage. 63% of retail investor accounts lose money when trading CFDs with this provider. You should consider whether you understand how CFDs work and whether you can afford to take the high risk of losing your money.
Stratos Europe Ltd (tradu.com ):
CFDs are complex instruments and come with a high risk of losing money rapidly due to leverage. 63% of retail investor accounts lose money when trading CFDs with this provider. You should consider whether you understand how CFDs work and whether you can afford to take the high risk of losing your money.
Stratos Global LLC (tradu.com ):
Losses can exceed deposits.
Please be advised that the information presented on TradingView is provided to Tradu (‘Company’, ‘we’) by a third-party provider (‘TFA Global Pte Ltd’). Please be reminded that you are solely responsible for the trading decisions on your account. There is a very high degree of risk involved in trading. Any information and/or content is intended entirely for research, educational and informational purposes only and does not constitute investment or consultation advice or investment strategy. The information is not tailored to the investment needs of any specific person and therefore does not involve a consideration of any of the investment objectives, financial situation or needs of any viewer that may receive it. Kindly also note that past performance is not a reliable indicator of future results. Actual results may differ materially from those anticipated in forward-looking or past performance statements. We assume no liability as to the accuracy or completeness of any of the information and/or content provided herein and the Company cannot be held responsible for any omission, mistake nor for any loss or damage including without limitation to any loss of profit which may arise from reliance on any information supplied by TFA Global Pte Ltd.
The speaker(s) is neither an employee, agent nor representative of Tradu and is therefore acting independently. The opinions given are their own, constitute general market commentary, and do not constitute the opinion or advice of Tradu or any form of personal or investment advice. Tradu neither endorses nor guarantees offerings of third-party speakers, nor is Tradu responsible for the content, veracity or opinions of third-party speakers, presenters or participants.

BTC - 106k now, whats next?106k is a rotational move, means the top liquidity get inside at first hence and then it goes down, watch it for

BVOL: Volatility Compression Before the Final ExpansionThis chart might not get as much attention as BTC dominance or TOTAL, but Bitcoin volatility (BVOL) is one of the cleanest leading indicators when it comes to identifying market tops and bottoms.
Just look at the history — every major macro top or bottom in BTC price has correlated with a peak or trough in this chart. Whether it was the ATH in March 2024, the October 2024 breakout, or the deep pullbacks into key lows, BVOL has nailed the timing with precision.
Right now, we’re seeing volatility compressing hard — currently sitting around 13.17 — and heading into my targeted demand zone which has historically marked major inflection points.
🧠 What does this mean?
Volatility this low = market indecision + positioning. It’s when liquidity gets sucked dry before a major expansion move.
My expectation is:
- BVOL will soon hit demand and reverse
- BTC will complete its current correction
- Once volatility expands again, it likely aligns with a reversal and move into new ATHs — the final bullish phase of this cycle
Just like in past cycles, low volatility precedes explosive directional moves. This current compression is setting the stage — once the lid comes off, the move is usually fast and decisive.
⚠️ Watch this closely. BTC correcting into demand + BVOL hitting this low = confluence for the next trending leg.
Big picture context:
We’re deep into the 4-year cycle structure, with a macro top expected into Q3/Q4 2025. This setup supports the idea that after this consolidation and volatility reset, BTC could make one final leg up before distribution begins.
Let the volatility tell the story — it usually whispers before it roars.

Final Shakeout Before BTC’s Last Leg Up?BTC Update
Well due update here...
Since my last forecast, price pushed higher without giving the pullback I was anticipating — instead sweeping liquidity above the prior ATH.
After taking that BSL, price stalled and has since been ranging, showing clear signs of bearish momentum creeping in. We're seeing bearish orderflow on the LTF and daily, and volume is thinning out up at these highs — not ideal for bulls.
USDT.D is also pushing higher and showing strength, which typically leans bearish for BTC in the short term. The structure on that chart is bullish and supports the idea of a BTC pullback being likely before any continuation higher.
That said, I'm still pro-trend bullish overall — as I mentioned in April — thanks to the clean bullish shift from the range lows and clear signs of accumulation. We’ve got textbook last points of support (LPS) and unmitigated demand sitting below current price, which are prime candidates for a reversal.
Right now I’m eyeing two key levels:
Upper demand zone / LPS — lining up with the top of the prior accumulation range. This has strong confluence as a breakout-retest zone.
Lower refined weekly/2W demand — valid if we see a deeper flush or capitulation leg, though less likely in the short term.
My focus is on the first level. I’ll be watching for reactions and reversal signals if price taps into it. Same logic applies to USDT.D as it approaches nearby supply zones.
Overall, I see this as a healthy correction — overdue after an extended leg — and expect BTC to push higher and break ATHs once demand is retested and confirmed.
Zooming out: the 4-year cycle is approaching its final stages, with data suggesting a cycle top could form around Q3/Q4 2025 — likely between August and October, if past cycles rhyme. I’ll be monitoring major assets against that timeline and will look to scale out and risk-off when the confluences begin aligning with that macro cycle window.
Just think...
1 last BTC leg up...
Final altseason hype to drag in latecomers...
Then the cycle ends — and the trap shuts as we re-enter bear territory.
Charts:
1D:
3D:
1W:
Extra:
1M:

Bitcoin 4-Year Cycle Structure – Technical BreakdownBitcoin 4-Year Cycle Structure – Technical Breakdown
This chart examines Bitcoin’s historical 4-year cycle behaviour, focusing on the repeating market structure observed across the last three cycles: Bull Market → Bear Market → Accumulation/Recovery → Halving → Expansion.
Key Observations:
🔹 Cycle Timing Consistency
Each of the past three cycles has shown a consistent duration between the halving and the final bull market peak—typically between 500–550 days. Based on that timing, the current cycle suggests we are still ~100 days away from a potential macro top.
🔹 Post-Halving Correction is Expected
Corrections shortly after the halving have historically marked mid-cycle retracements, not macro tops. The current pullback is structurally aligned with the 2017 and 2021 expansions, where Bitcoin consolidated before pushing to final highs.
🔹 Altcoin Market Segments Lagging
TOTAL2 (Total Market Cap excluding BTC)
TOTAL3 (Excluding BTC & ETH)
OTHERS (Altcoins excluding top 10 by market cap)
All remain below their prior cycle all-time highs, which historically occurs before the full market cycle concludes. These segments often accelerate after BTC has established dominance, typically in the later stages of the bull market.
🔹 USDT Dominance Suggests More Upside
USDT.D is still trending down, which historically reflects increasing risk appetite and capital rotation into crypto assets. Prior cycle tops have aligned with much lower dominance levels, indicating further downside risk for USDT.D, and potential upside for crypto markets.
Conclusion:
Despite short-term volatility, the technical structure across Bitcoin and broader market indicators suggests the cycle remains in its expansion phase. Timing models, altcoin lag, and dominance signals all point to further upside potential before a full cycle peak is in.
1W:
1M:

Bitcoin Crash to $93k is Progressing Well! But be Careful Now!I have explained the price action of Bitcoin, shared my insights on what will happen next, and updated my previous idea on $BTC!
Smash the rocket button if you feel the Bitcoin bearish vibe!

SOL/USDT Rejected at Key Fib Zone – Bulls’ Last Stand at SupportRecap and Bias
The short-term bullish “orange” bounce scenario from the previous analysis failed to materialize. Solana’s price was rejected near 150, printing a lower high, and has since dropped back into the mid 140s. This confirms that the recent rally was a dead-cat bounce rather than a trend reversal.
The updated bias is cautiously bearish. This stems from rejection at resistance, weakening momentum, and a deteriorating volume profile. Unless price reclaims the 148 to 150 zone with strength, the bears remain in control. Only a decisive breakout above that level would shift the short-term outlook back to bullish.
Macro Context
Global risk sentiment remains fragile. The sudden escalation between Israel and Iran in early June, including reports of missile strikes, sparked a flight to safety. Solana’s rally quickly reversed, with price dropping over 15 percent since June 11.
Other geopolitical flashpoints also continue to weigh on investor confidence. The protracted war in Ukraine and ongoing disruptions in Red Sea trade routes have fueled broader market caution. This is contributing to periodic risk-off moves and spikes in volatility across both traditional and crypto markets.
On the economic side, uncertainty around US monetary policy is adding to pressure. Although May inflation cooled slightly, investors remain cautious ahead of upcoming Fed decisions. Crypto assets have traded weakly into these events, reflecting a wait-and-see approach.
Taken together, this geopolitical and macroeconomic backdrop is driving elevated short-term volatility and a higher risk premium in the crypto space. In this context, market participants are increasingly hesitant to take large directional bets without a clear catalyst.
One such catalyst may be the potential approval of a Solana ETF. Optimism has grown, with prediction markets now placing the likelihood of approval near 76 percent by late July. If approved, this could be a game-changing event that re-rates SOL’s medium-term valuation and breaks it out of its current downtrend.
Until then, traders should remain cautious and assume headline risk is elevated.
Multi-Timeframe Technical Outlook
Daily and 4H Trend
The high timeframe structure shows a clear downtrend. Lower highs and lower lows are intact. A double top formation from May broke down cleanly. Most recently, Solana was rejected at a key Fibonacci confluence zone around 149 to 151, which included the 0.618 retracement, the 20-day SMA, and a well-defined supply zone.
After that rejection, SOL has traded along the lower Bollinger Band with increasing volatility. The 20 SMA is now acting as dynamic resistance. All major trendlines have broken.
2H, 1H, and 30m Perspective
Shorter-term charts show SOL attempting to base near 143 to 145 support. Several oversold RSI conditions have triggered bounces, but these have lacked momentum. Harmonic pattern recognition shows that a bearish Deep Crab completed near 152, which marked the local top.
Currently, price remains pinned below descending trendlines and the 1H 20 EMA. Bullish momentum has yet to reappear in any meaningful way.
Key Technical Factors
Resistance: 149 to 151
This zone holds multiple levels of confluence. It includes the 50 to 61.8 percent retracement of the last swing, a 1.272 Fib extension, the 20-day SMA, and prior supply. The rejection at 151.7 was sharp and decisive. Unless price reclaims this zone, it remains a ceiling.
Support: 142 to 145
This is the last meaningful support zone holding price up. It is the neckline of a 12H Head and Shoulders pattern and the base of a previous multi-week range. It also coincides with the lower bound of a prior rising channel. The 50-day MA and 0.236 Fib retracement are also near this zone. If this area breaks, sellers will likely target 130 to 135 next.
Momentum: RSI 14 with MA Overlay
Daily RSI rolled over from above 70 with bearish divergence as price topped. RSI is now below its MA across all timeframes, reflecting negative momentum. On the 4H chart, RSI dipped below 30 and remains weak despite minor relief bounces. Lower timeframes show early divergence but no confirmed reversal signals.
Trend Structure
Price continues to make lower highs and lower lows. The 200-day MA was lost weeks ago. The 50-day is now flattening near 140. A death cross recently printed on the 12H chart, confirming bearish short-term pressure.
Volume and PVT
Volume favors the bears. PVT is in decline, showing more volume on down days than up days. The rally to 150 occurred on weak volume, while selloffs continue to show increasing size. This signals distribution, not accumulation.
Harmonic Patterns
A bearish Deep Crab pattern completed at the recent high. No bullish harmonics are confirmed yet. Traders should monitor the 130 to 125 zone for potential bullish completion patterns like a Gartley or Bat. If those form with oversold signals, they could mark the bottom.
Green Scenario: Bullish Breakout Path
Bias
Only valid on confirmed breakout
Trigger
Break and hold above 150. Ideally, an hourly close above 150 or daily close above 152 confirms the move.
Confirmation
Rising volume, RSI reclaiming 50, and a PVT uptick. A retest of 148 to 150 from above would reinforce the breakout.
Targets
First target is 155, which aligns with the 12H 50 EMA.
Second target is 162 to 165.
Extended targets include 170 to 180 and eventually the 200 psychological level if ETF news hits.
Stop Loss
Below 147 or back inside the 143 zone would invalidate the breakout and suggest a failed move.
Logic
If bulls reclaim 150 with strength, this would invalidate the lower-high structure. Shorts would begin covering and momentum could quickly shift. Breakout entries should focus on confirmation and volume expansion.
Red Scenario: Bearish Breakdown Continuation
Bias
Default scenario
Trigger
Clean break below 142. Daily close under 140 confirms the H and S neckline break.
Confirmation
Failing retests of 142, rising sell volume, and RSI staying suppressed. Price action showing impulsive red candles validates the move.
Targets
First target is 130 to 135.
Second target is 115 to 120.
Final measured move would project into the 100 to 110 zone if trend acceleration continues.
Stop Loss
Any reclaim of 145 to 148 would likely invalidate the breakdown and trap late sellers.
Logic
If this support fails, shorts will press. Bounces will likely be sold into. Traders can enter on the break or the first failed retest of 142. Consider scaling out near 135 and trail stops from there.
Strategy Summary
Current Bias
Leaning bearish unless bulls reclaim 150
Key Levels
148 to 150 is breakout zone
142 to 140 is breakdown zone
Trading Strategy
Range traders can play 144 to 150 but must be nimble
Breakout traders should wait for confirmation above 150
Breakdown traders can short under 140 with stops over 145
Risk Management
Volatility is elevated. Trade smaller size. Use tight stops and trail them. Wait for confirmation, not anticipation. Watch ETF news closely. If delayed, expect continued weakness.
