Bitcoin Update: Key Levels, Geopolitics & Cautious Trading Ahead
📈💥 Bitcoin Update: Key Levels, Geopolitics & Cautious Trading Ahead 💭🌍
Hey Traders,
Many of you asked for a fresh Bitcoin update — so here we go. 🚀
Last time, we caught that breakout, but it turned out to be a fakeout. Since then, the situation has become more complex. Geopolitical tensions between Iran and Israel, combined with uncertainty in the Middle East, are weighing heavily on sentiment. 🕊️💣
On the macro side, the Federal Reserve is expected to keep rates unchanged for now — no cuts yet. Building permits data has disappointed again, but inflation is cooling slightly. For now, the big market mover is clearly geopolitics.
👉 Key Levels to Watch:
✅ Support:
$102,400 – $102,700 — If Bitcoin dips here, watch for a bounce.
✅ Resistance:
$106,000 — Major resistance.
Next Resistance: $108,350
Ultimate target: $113,000–$115,000, IF momentum returns.
So how am I approaching it?
📌 Long above $106K → first stop $108K → target $113K–$115K.
📌 Short below $106K → watch support zones carefully.
📌 If we lose $102K, next big supports are $97,700, $89,000 — and even $79,000 if things worsen.
🚫 Big Picture:
We’re still stuck in a broad sideways range — roughly $100,000–$110,000 — until a clear breakout or breakdown occurs. Without a Fed pivot or de-escalation in the Middle East, momentum may stay muted.
🙏 My Advice:
Be cautious. Size your positions wisely. Respect levels. And above all, stay safe — mentally and emotionally — in these uncertain times.
I’ll keep you updated step-by-step. Trade smart, stay kind.
One Love,
The FXPROFESSOR 💙
Disclosure: I am happy to be part of the Trade Nation's Influencer program and receive a monthly fee for using their TradingView charts in my analysis. Awesome broker, where the trader really comes first! 🌟🤝📈
1-BTCUSD

₿itcoin: SetbackBitcoin has come under selling pressure in recent hours. We cannot rule out that a deeper dip may precede the next leg higher into the upper blue Target Zone between $117,553 and $130,891. Once green wave B concludes in this range, we anticipate a wave C decline into the lower blue Target Zone between $62,395 and $51,323 to complete the larger orange wave a. From there, a corrective rally in orange wave b is expected, which should set the stage for a final leg lower to finalize blue wave (ii). Meanwhile, we’re still monitoring the alternative scenario (30% probability), in which blue wave alt.(i) is still in progress. In this case, BTC would stage an immediate breakout above resistance at $130,891.
📈 Over 190 precise analyses, clear entry points, and defined Target Zones - that's what we do.

It's an Evacuation Through Green Candles💥 "One Last Leap of Faith?" - What Bitcoin Might Be Hiding Before September
The world’s on fire: Israel, Iran, Strait of Hormuz, oil, elections, the dollar, rates, black swan whispers.
And someone’s out here saying Bitcoin might still go up?
Yes. We are. Not because we believe - but because we see.
📉 Everyone’s afraid. The whales aren’t.
When the crowd goes into survival mode, the real game begins.
Whales aren’t exiting - they’re accumulating.
ETFs aren’t pausing - they’re inflowing.
The technical setup isn’t breaking - it’s compressing like a spring.
$104,000. Coil building.
If we break out - targets at $132K–$140K are absolutely in play.
👉 But that’s not the point.
The point is why this is happening while the world is burning.
🧠 The idea: Bitcoin isn’t a safe haven. It’s a distribution machine.
Gold is for panic.
Bitcoin is for structure.
Institutions don’t ask “is it scary?” - they ask “where’s liquidity?”
Everything is aligning for one last upside move.
Until September. After that - chaos is back on the table.
💣 The Global Playbook:
Now (Summer) - Consolidation, ETF flows, geopolitical fear - Strategic entries, low exposure
Breakout - FOMO panic, retail rushes in - Profit-taking via options
September–Fall - Macro/geopolitical shock - Already in cash or hedged
📌 Bottom Line
Yes, Bitcoin might pump. Not because the world is fine - but because someone needs to exit beautifully.
If you're reading this - you're early enough to think.
Markets don’t reward justice. They reward positioning.
🛠 What to do right now:
Watch the $104,000 level - it's the pivot
Breakout = final upside push to $132K–140K
Keep your eyes on September - reversal zone
Think in scenarios: entry, exit, protection
Follow EXCAVO - we don’t guess, we read the game
I've been talking about this scenario for a long time

Bitcoin - The Elevated Cycle and the Silence Before Powell.⊢
⟁ BTC/USD – Bitstamp – (CHART: 1M) – (June 18, 2025).
⟐ Analysis Price: $104,044.00
⊢
⨀ I. Temporal Axis – Strategic Interval – (1M):
▦ EMA90 – ($39,909.00):
∴ Rising steadily, serving as long-cycle structural support since 2020;
∴ Price remains well above this average, with no signs of downward pressure;
∴ The positive slope confirms ongoing bullish macro structure.
✴️ Conclusion: EMA90 holds the foundational base of the long-term uptrend with ample buffer.
⊢
▦ SMA50 – ($48,924.00):
∴ Key axis of mid-to-long-term structure, validated by multiple touches during 2022–2023;
∴ Current price distance suggests technical room for retracement;
∴ Still rising with no sign of flattening or decay.
✴️ Conclusion: SMA50 confirms trend integrity, though overextension calls for caution.
⊢
▦ Ichimoku (Kumo & Lines) – (85,434 | 68,378 | 104,044 | 76,906 | 63,740):
∴ Price remains well above the Kumo cloud – full bullish confirmation;
∴ Tenkan and Kijun are aligned in bullish configuration, widely spread;
∴ Future cloud projects bullish momentum continuation.
✴️ Conclusion: Complete Ichimoku structure signals dominant cycle strength.
⊢
▦ MACD (12,26,9) – (2,344 | 16,426 | 14,083):
∴ MACD line remains above the signal, maintaining a monthly buy signal;
∴ Histogram shows mild expansion, but slower than previous bull cycles;
∴ Momentum is positive but decelerating.
✴️ Conclusion: Momentum remains intact, but peak cycle force may have passed.
⊢
▦ RSI (14) – (68.82 | MA: 67.35):
∴ RSI approaching overbought threshold, hovering near 70;
∴ Momentum is firm but shows resistance to further extension;
∴ Historical comparison to 2020 suggests possible ignition or exhaustion point.
✴️ Conclusion: RSI signals potential tension zone - breakout or reversal ahead.
⊢
▦ VPT (14,8) – (100):
∴ Volume Price Trend has plateaued at its max threshold;
∴ Lack of new highs despite price advance suggests fading directional volume;
∴ Often a signal of accumulation slowdown or redistribution.
✴️ Conclusion: Buyer strength may be waning beneath the surface.
⊢
🜎 Strategic Insight - Technical Oracle:
∴ Market structure remains bullish across all core indicators;
∴ Overextension from key moving averages and flattening momentum call for tactical caution;
∴ Any macroeconomic pressure could trigger a local top, without compromising the broader trend.
⊢
∫ II. On-Chain Intelligence – (Source: CryptoQuant):
▦ Realized Price & LTH – ($47,000):
∴ Market price is well above the realized price baseline;
∴ Indicates majority of holders are in profit — structurally bullish;
∴ However, this also creates a risk of profit-taking if confidence drops.
✴️ Conclusion: Strong support floor, but latent pressure exists.
⊢
▦ SOPR - (Spent Output Profit Ratio) – (1.013):
∴ Above 1 means active profit-taking;
∴ Downward slope shows this is starting to cool;
∴ Critical to monitor for a break below 1 - would shift dynamic.
✴️ Conclusion: Still healthy, but at the edge of distribution risk.
⊢
▦ NUPL – (Net Unrealized Profit/Loss) - (0.554):
∴ Unrealized profit remains dominant;
∴ Readings above 0.5 historically precede consolidation or pullbacks;
∴ Still distant from euphoric tops, but entering alert zone.
✴️ Conclusion: Market still in profit expansion phase - but under surveillance.
⊢
▦ MVRV - (STH vs LTH) – (STH: 1.0 | LTH: 3.1 | Global: 2.2):
∴ STH neutral, LTH moderately elevated but not excessive;
∴ Market is mature, but not overheated;
∴ Still in a zone that supports further upside with restraint.
✴️ Conclusion: Healthy balance between holders - no imminent top confirmed.
⊢
▦ CME Futures Open Interest:
∴ Sharp rise in open interest across expiry horizons;
∴ Sign of speculative leverage building;
∴ Historically correlates with volatile price action post-FOMC or macro events.
✴️ Conclusion: Liquidity pressure is rising - extreme caution warranted.
⊢
🜎 Strategic Insight - On-Chain Oracle:
∴ On-chain structure mirrors technical signals - strong trend, but cautious undertone;
∴ No major signs of reversal, but profit saturation could act as gravity if macro shocks occur;
∴ Market is exposed, not exhausted.
⊢
⧉ III. Contextvs Macro–Geopoliticvs – Interflux Economicus:
▦ Fed Chair Powell (Upcoming):
∴ Powell speaks today (June 18); core expectation is rate hold;
∴ Market bracing for hawkish tone: fewer projected cuts and emphasis on inflation resilience;
∴ Historically, Bitcoin has reacted with -2% to -5% dips to hawkish FOMC tone.
✴️ Conclusion: Macro tension peak. Powell’s tone may dictate the next 30-day candle.
⊢
⚜️ 𝟙⟠ Magister Arcanvm – Vox Primordialis!
⚖️ Wisdom begins in silence. Precision unfolds in strategy.
⊢
⊢
⌘ Codicillus Silentii – Strategic Note:
∴ The technicals are strong, the on-chain base is stable, and the macro setup is explosive;
∴ This is a tension point, not a resolution point - silence before decision;
∴ Precision now is not found in action, but in observation.
⊢
⌘ Market Status:
✴️ Position: " Cautiously Bullish. "
✴️ Tactical Mode: Observation Priority – No immediate entry without Powell clarity.
⊢

SPY/QQQ Plan Your Trade For 6-18 : GAP Potential PatternToday's GAP Potential pattern suggests the SPY/QQQ may GAP a bit higher at the open, then move into a melt-up phase, trying to identify resistance, then roll into a topping pattern and move downward.
I believe the recent "rollover" of the markets (initiating last Friday with the Israel/Iran conflict) is still dominating the markets and news related to the ongoing conflict could drive a moderate pullback in US assets.
Headed into the Juneteenth holiday (Thursday, June 19), I suggest traders prepare for the US markets to move into somewhat of a SETTLEMENT mode today - where traders don't want to hold too many open positions into Friday's trading.
Additionally, Gold and Silver could move into a very strong upward price move over the next 4-5+ days. So be prepared for metals to hedge risks when the US stock market is closed.
BTCUSD seems to be struggling into the FLAG APEX. I'm waiting to see if my FLAG count is correct and if we get the breakdown in BTCUSD as I expect.
Get some.
#trading #research #investing #tradingalgos #tradingsignals #cycles #fibonacci #elliotwave #modelingsystems #stocks #bitcoin #btcusd #cryptos #spy #gold #nq #investing #trading #spytrading #spymarket #tradingmarket #stockmarket #silver

June 17 Bitcoin Bybit chart analysisHello
This is Bitcoin Guide.
It's been a while.
I took a break recently because the participation rate was not good.
Since it's been a while since I did an analysis, I did it in a short form,
I hope you enjoy it.
If you "follow"
You can receive real-time movement paths and comment notifications on major sections.
If my analysis was helpful,
Please click the booster button at the bottom.
Here is the Bitcoin 30-minute chart.
I created a strategy based on the possibility of sideways movement in Nasdaq and the rebound of Tether Dominance.
* When the blue finger moves,
It is a two-way neutral short->long switching strategy.
1. $106,792.2 short position entry point / stop loss price when orange resistance line is broken
2. $105,082.8 long position switching / stop loss price when green support line is broken
3. $107,579.9 long position 1st target -> Top 2nd target price
If it goes down from the current position,
Check the bottom section -> up to $103,194.3.
Please use my analysis as a reference only
I hope you operate safely with principle trading and stop loss price.
Thank you.

BTC Macro Analysis☕ 𝙂𝙈. CRYPTOCAP:BTC macro analysis update...
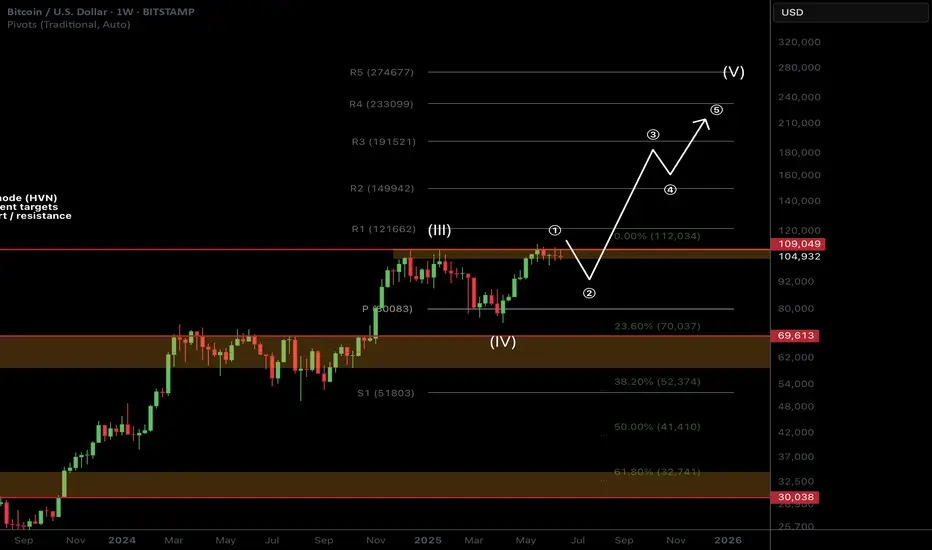
📈 𝙇𝙤𝙣𝙜 𝙩𝙚𝙧𝙢 outlook remains unchanged and recent price action is barely a blip on the weekly chart. SD+2 target is still $211k as a blow off top.
📉 𝙎𝙝𝙤𝙧𝙩 𝙩𝙚𝙧𝙢 outlook has investors looking lower towards the $92K target but this isn't guaranteed to be reached and price action may front those who wait.
War escalation's and retail selling are keeping price suppressed as price changes hands to private companies and large wallets.
The time for patience continues. Money is made in the sitting, weathering volatility, not flipping in and out of trades on every bit of news and price movement
𝙏𝙚𝙘𝙝𝙣𝙞𝙘𝙖𝙡 𝘼𝙣𝙖𝙡𝙮𝙨𝙞𝙨
Price is consolidating under all time high resistance. Consolidation under resistance has high probability of breaking out, the longer it remains the higher the probability.
Elliot Wave (EW) analysis suggests a motif wave ended with the poke above all time high (per the EW rules), with a wave 2 retracement underway. Price remains above the daily pivot (bullish) but below the DEMA (bearish). A triangle could still be forming but this is not my preferred EW count.
Safe trading
Current BTC Trend Analysis and Trading RecommendationsThe daily candlestick chart of BTC shows a three - day consecutive bearish retracement, having fallen back to the vicinity of the starting point of the previous pinbar rebound and currently remaining in a recent low - level sideways consolidation zone. However, the 4 - hour trend is pressured by the middle band of the Bollinger Bands, staying within a downward channel and forming a rebound - retracement wave pattern.
For short - term strategies, anticipate a further retracement first. Long positions should be initiated only after the support level is confirmed valid. This retracement represents a necessary consolidation phase before the bullish trend continues, and the current adjustment range does not pose a substantial threat of trend reversal to the overall uptrend. With the core upward trend intact and the direction remaining clear, BTC is expected to resume its upward momentum after a brief consolidation. The operational approach remains to go long on retracements.
BTCUSD
buy@103500-104000
tp:105500-106500
Investment itself is not the source of risk; it is only when investment behavior escapes rational control that risks lie in wait. In the trading process, always bear in mind that restraining impulsiveness is the primary criterion for success. I share trading signals daily, and all signals have been accurate without error for a full month. Regardless of your past profits or losses, with my assistance, you have the hope to achieve a breakthrough in your investment.

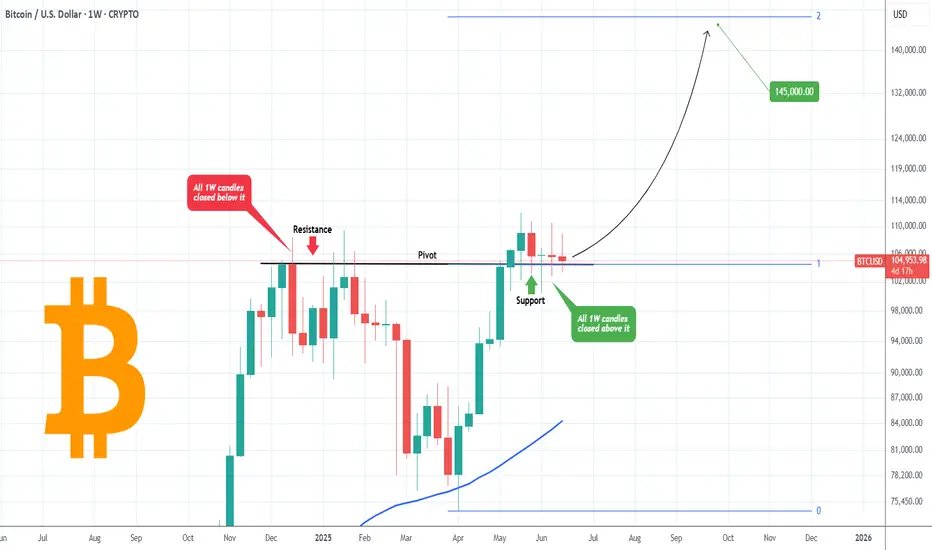
BITCOIN The secret trend-line that no one notices..Bitcoin (BTCUSD) was under heavy selling pressure yesterday and even the 1D time-frame turned marginally bearish. What most seem to ignore however is the larger picture. On the 1W time-frame, BTC has managed to close the last 5 weeks above the Pivot trend-line.
What that trend-line is? It is the level that initially started as a Resistance from December 09 2024 to January 27 2025, closing all 1W candles below it, despite occasional candle wicks breaking above it. That confirmed it's status as a Resistance at the time.
Now we see the opposite, five straight 1W candles closing above that Pivot line. Check in particular, how flat the last two 1W candles closed, showcasing no just the high volatility that the market is under in the past weeks, but also the same amount of sellers and buyers existing in the market (neutral).
This is an indication that this is a consolidation phase, preparing BTC for the next rally. If we place the top Fibonacci level (1.0) on that Pivot, we get the 2.0 Fib extension just above the $145000 mark. That gels perfectly with various other studies we've conducted showing a similar long-term Target.
So do you think the Pivot line will hold and push Bitcoin to $145k? Feel free to let us know in the comments section below!
-------------------------------------------------------------------------------
** Please LIKE 👍, FOLLOW ✅, SHARE 🙌 and COMMENT ✍ if you enjoy this idea! Also share your ideas and charts in the comments section below! This is best way to keep it relevant, support us, keep the content here free and allow the idea to reach as many people as possible. **
-------------------------------------------------------------------------------
💸💸💸💸💸💸
👇 👇 👇 👇 👇 👇
BTC/USDT in Consolidation: How To Trade the RangeBitcoin (BTC/USDT) is currently in a clear consolidation phase on the 4-hour chart 📊. Price action is trapped within a well-defined range, and for now, no dominant trend has emerged — we’re simply trading sideways between key support and resistance levels 🔁
In the video, we dive into how to tactically approach this kind of environment by trading the lower time frame trend shifts within the range — focusing on lower timeframe moves from range highs to range lows, and vice versa ⬆️⬇️
We also reference the broader macro picture — looking at the NASDAQ (US100) and the Magnificent 7 (MAGS) for potential clues about Bitcoin’s next directional move 🧠💡. Risk-on or risk-off sentiment in these key tech equities often correlates with Bitcoin’s momentum, making them critical confluence factors for BTC traders.
For now, the strategy is to remain range-conscious and reactive, rather than predictive. Until we get a confirmed breakout or breakdown, patience and precision remain key 🎯

Bitcoin Bounced from a High-Volume Area at the 103,363 Support.FenzoFx—Bitcoin dipped to $105,175, creating a bearish fair value gap that highlights selling pressure. Immediate support is at $103,463, backed by high volume, while resistance stands at $107,792. If support holds, BTC/USD could rise toward $112,000.
A drop below $102,185 may accelerate the downtrend toward $93,363, the previous monthly low.

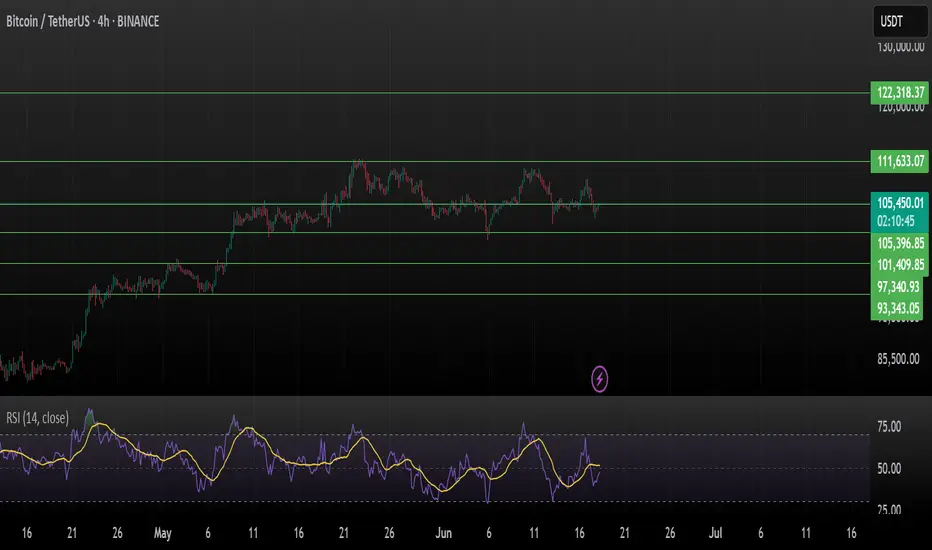
Bitcoin (BTCUSDT) 4H AnalysisBitcoin is currently consolidating around $105,523 after a strong rally and forming a short-term sideways structure. It is still unable to break the immediate resistance of $ 111 K.
Key Technical Observations:
BTC has been ranging between $101,409 and $105,523
RSI at ~51.38 indicates a neutral zone, signaling indecision in momentum
Support holding at $105,396, but price action is flat
Bulls need to reclaim $111,633 to regain momentum
Major Levels to Watch:
Resistance: $111,633 → $122,318
Support: $105,396 → $101,409 → $97,340 → $93,343
A break above $111,633 could trigger bullish continuation, while a fall below $101,409 might open the path to deeper support zones.
Patience is key — wait for breakout confirmation before making moves.
This is not financial advice. Always DYOR and manage risk.
Like, share & comment if you find this analysis helpful!
#Bitcoin #BTC #BTCUSDT
weekly BULL-FLAG!it looks like after the rally bitcoin had since early April, now this is a bull-flag pattern on weekly and that can push bitcoin to $140k.

$banana PARALLEL CHANNEL ON BANANA GUN$banana parallel channel on banana gun.
Have we bottomed?
Do we now go to the top of the parallel channel?
I think we go there in june.
Q3 aka july, aug, sep going to be consolidation
Q4 we begin the bull run.

Bearish reversal?The Bitcoin (BTC/USD) is rising towards the pivot which is a pullback support and could reverse to the 1st support which is also a pullback support.
Pivot: 106,391.59
1st Support: 103,654.27
1st Resistance: 108,761.68
Risk Warning:
Trading Forex and CFDs carries a high level of risk to your capital and you should only trade with money you can afford to lose. Trading Forex and CFDs may not be suitable for all investors, so please ensure that you fully understand the risks involved and seek independent advice if necessary.
Disclaimer:
The above opinions given constitute general market commentary, and do not constitute the opinion or advice of IC Markets or any form of personal or investment advice.
Any opinions, news, research, analyses, prices, other information, or links to third-party sites contained on this website are provided on an "as-is" basis, are intended only to be informative, is not an advice nor a recommendation, nor research, or a record of our trading prices, or an offer of, or solicitation for a transaction in any financial instrument and thus should not be treated as such. The information provided does not involve any specific investment objectives, financial situation and needs of any specific person who may receive it. Please be aware, that past performance is not a reliable indicator of future performance and/or results. Past Performance or Forward-looking scenarios based upon the reasonable beliefs of the third-party provider are not a guarantee of future performance. Actual results may differ materially from those anticipated in forward-looking or past performance statements. IC Markets makes no representation or warranty and assumes no liability as to the accuracy or completeness of the information provided, nor any loss arising from any investment based on a recommendation, forecast or any information supplied by any third-party.

Ethereum (ETH/USDT) – Breakdown From Ascending TriangleEthereum failed to hold above the crucial resistance of $2,849 and has broken down from the ascending triangle on the 4H timeframe — invalidating the bullish breakout structure.
It seems to be consolidating and moving sideways in the range. The move is possible only if we break the channel either upside or downside.
Key Observations:
Ascending triangle fakeout followed by sharp rejection
RSI dropped from overbought (~70) to neutral zone (~46), showing weakening momentum
Current price: $2,537, testing local support at $2,384.90
Next major support zones: $2,242.98 and $1,852.48
Watch for further weakness below $2,384 — could accelerate downside toward $2,242 or lower.
Caution advised: Wait for the structure to rebuild before positioning it long.
This is not financial advice, please do your research before investing, as we are not responsible for any of your losses or profits.
Please like, share, and comment on this idea if you liked it.
#ETH #Ethereum #ETHUSDT

BTC/USDT Long Trade Setup – 1H Chart AnalysisBTC/USDT Long Trade Setup – 1H Chart Analysis
BINANCE:BTCUSDT
Hello traders! Sharing a recent long entry I took on Bitcoin (BTC/USDT) based on price action and liquidity concepts. This trade is taken on the 1-hour timeframe and aligns with my strategy of combining liquidity sweeps, support zones, and market structure shifts.
---
🔍 Trade Overview:
Entry Price: 104,704 USDT
Stop Loss: 103,660 USDT
Take Profit (Target): 108,349 USDT
Risk-to-Reward Ratio (RRR): Approximately 1:3
---
🧠 Trade Idea Behind the Entry:
As you can see on the chart, BTC had been in a downtrend and recently made a strong move into a key liquidity zone. This zone had previously seen multiple touches and rejections, making it an area of interest for both buyers and sellers.
The price swept liquidity below the previous low (labelled as “Liquidity Sweep $$$”), grabbing stop losses of early buyers and triggering limit orders of smart money. This move into the liquidity zone was followed by a strong bullish reaction – a signal that buyers may be stepping in.
Additionally, the "Break of Structure" (BOS) confirms a potential shift in market direction. The reaction from the liquidity zone indicates that this level is holding as new support.
---
🛠️ Why I Took the Trade:
1. Liquidity Sweep: The wick that pierced the liquidity zone signals stop-hunting and accumulation. These moves often precede a strong reversal.
2. Demand Zone Reaction: After the sweep, the candle closed bullish inside the demand box. This shows buyer strength.
3. Risk Management: The stop loss is set just below the liquidity zone to protect from deeper sweeps while keeping the RR healthy.
4. High Probability Target: The target is placed near the next resistance level around 108,349, which also aligns with a clean imbalance that price may want to fill.
---
📊 Technical Confidence:
Confluence Factors:
✅ Liquidity sweep
✅ Demand zone reaction
✅ Market structure shift
✅ High RR
✅ No immediate resistance till target
This type of setup reflects smart money behavior – first pushing price below structure to grab liquidity and then reversing sharply. The bullish momentum after the sweep gave extra confirmation.
---
🧭 What I’m Watching Now:
I will continue monitoring how price reacts around the 105,500–106,000 range. If momentum continues with higher highs and higher lows, I may trail my stop loss to lock in profits.
---
Let me know what you think of this setup! Have you taken a similar trade or are you waiting for confirmation? Drop your thoughts or charts below 👇
Stay disciplined, manage your risk, and trust the process. 🚀
#Bitcoin #BTCUSD #PriceAction #LiquiditySweep #SmartMoney #CryptoTrading #TradingSetup #TechnicalAnalysis #TradeJournal

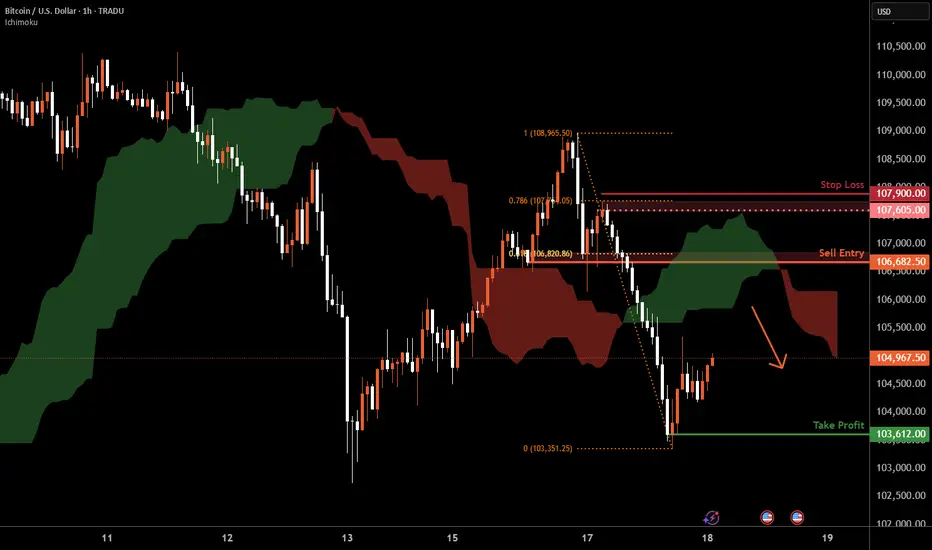
Bitcoin H1 | Pullback resistance at 61.8% Fibonacci retracementBitcoin (BTC/USD) is rising towards a pullback resistance and could potentially reverse off this level to drop lower.
Sell entry is at 106,682.50 which is a pullback resistance that aligns with the 61.8% Fibonacci retracement.
Stop loss is at 107,900.00 which is a level that sits above the 78.6% Fibonacci retracement and a swing-high resistance.
Take profit is at 103,612.00 which is a swing-low support.
High Risk Investment Warning
Trading Forex/CFDs on margin carries a high level of risk and may not be suitable for all investors. Leverage can work against you.
Stratos Markets Limited (tradu.com ):
CFDs are complex instruments and come with a high risk of losing money rapidly due to leverage. 63% of retail investor accounts lose money when trading CFDs with this provider. You should consider whether you understand how CFDs work and whether you can afford to take the high risk of losing your money.
Stratos Europe Ltd (tradu.com ):
CFDs are complex instruments and come with a high risk of losing money rapidly due to leverage. 63% of retail investor accounts lose money when trading CFDs with this provider. You should consider whether you understand how CFDs work and whether you can afford to take the high risk of losing your money.
Stratos Global LLC (tradu.com ):
Losses can exceed deposits.
Please be advised that the information presented on TradingView is provided to Tradu (‘Company’, ‘we’) by a third-party provider (‘TFA Global Pte Ltd’). Please be reminded that you are solely responsible for the trading decisions on your account. There is a very high degree of risk involved in trading. Any information and/or content is intended entirely for research, educational and informational purposes only and does not constitute investment or consultation advice or investment strategy. The information is not tailored to the investment needs of any specific person and therefore does not involve a consideration of any of the investment objectives, financial situation or needs of any viewer that may receive it. Kindly also note that past performance is not a reliable indicator of future results. Actual results may differ materially from those anticipated in forward-looking or past performance statements. We assume no liability as to the accuracy or completeness of any of the information and/or content provided herein and the Company cannot be held responsible for any omission, mistake nor for any loss or damage including without limitation to any loss of profit which may arise from reliance on any information supplied by TFA Global Pte Ltd.
The speaker(s) is neither an employee, agent nor representative of Tradu and is therefore acting independently. The opinions given are their own, constitute general market commentary, and do not constitute the opinion or advice of Tradu or any form of personal or investment advice. Tradu neither endorses nor guarantees offerings of third-party speakers, nor is Tradu responsible for the content, veracity or opinions of third-party speakers, presenters or participants.
$RPL 4H AnalysisGETTEX:RPL 4H Analysis 🔥
RPL is currently trading at the lower boundary of a parallel ascending channel, which has acted as strong support multiple times in the past. The price action shows a clear higher high, higher low structure, indicating an ongoing uptrend.
Currently, the price is hovering around the key horizontal demand zone ($5.5–$5.8). This level has previously acted as a launchpad for aggressive bullish moves, and we are seeing early signs of accumulation again.
Bullish Scenario:
If the support holds, RPL is likely to retest the midline of the channel around $7, followed by a potential breakout toward the upper trendline near $9 – $9.5.
The risk/reward setup here is highly favorable for swing traders.
What to watch:
Hold above $5.5 = bullish continuation likely 🚀
Break below $5.5 = invalidation of structure ⚠️
📈 Conclusion:
Structure remains bullish. This is a textbook channel bounce setup with targets of $7 → $8.5 → $9.5 if momentum kicks in. Volume confirmation will be key.
#RPL #RocketPool #CryptoTrading #Altcoins #BreakoutSetup #TechnicalAnalysis

Next Volatility Period: Around June 22
Hello, traders.
If you "Follow", you can always get new information quickly.
Have a nice day today.
-------------------------------------
(BTCUSDT 1M chart)
The morning star candle that we often heard about when studying candles appeared.
However, since the candle has not closed yet, the shape of the candle may change.
In stock charts, there were cases where the movement could be predicted with the shape of these candles, but in the coin market, it is impossible to predict.
The reason is that trading is possible 24 hours a day.
Most candle shapes occur with gaps, allowing for a comprehensive interpretation, but in the coin market, gaps are not likely to occur, so I think there is nothing that can be known from the shape of the candles.
Therefore, it is recommended not to try to analyze the chart with the actual shape or pattern of the candles.
However, you need to study to be able to read the arrangement of the candles in order to set support and resistance points.
Even this is not difficult to indicate support and resistance points because there are indicators that indicate support and resistance points.
-
(1W chart)
The 104463.99 point is the DOM (60) indicator point, which corresponds to the end of the high point.
Also, the 99705.62 point is the HA-High indicator point, which corresponds to the middle of the high points.
Therefore, the 99705.62-104463.99 section can be interpreted as the high point boundary section.
The actual trend is likely to occur while falling from 99705.62.
The importance of the 99705.62 point is increasing because the M-Signal indicator on the 1W chart is rising near the HA-High indicator point.
If it falls below the M-Signal indicator on the 1W chart, it is possible that the trend will be determined again when it meets the M-Signal indicator on the 1M chart.
Also, if it falls from the HA-High indicator, it can meet the HA-Low indicator.
Therefore, if the price starts to fall, you should check whether the HA-Low indicator is generated.
The fact that the HA-Low indicator was created means that it rose from the low range.
That is, just as the HA-High indicator corresponds to the midpoint of the highs, the HA-Low indicator corresponds to the midpoint of the lows.
The end point of the lows corresponds to the DOM(-60) indicator point.
-
(1D chart)
For this reason, it is important to see support around 104463.99-106133.74.
The trend is likely to appear after the next volatility period, around June 22nd (June 21st-23rd).
Therefore, we should consider the 104463.99-106133.74 range as the middle range,
- and see if it falls below 99705.62,
- or rises above 108316.90.
Accordingly, we should create a response strategy and be prepared not to panic when a trend appears.
-
The OBV is currently below the Low Line.
Therefore, if it does not receive support at the 104463.99 point, it is likely to fall again.
Since the OBV oscillator is still below the 0 point, we can see that the selling pressure is strong.
However, looking at the overall movement of the oscillator, we can see that the selling pressure is decreasing.
Therefore, if there is another decline, the key issue is whether there is support near 99705.62.
-
In summary, the area around 104463.99 is playing an important role as support and resistance.
Therefore, after the next volatility period, around June 22, we need to check and respond to the direction in which it deviates from the 99705.62-108316.90 range.
-
Thank you for reading to the end.
I hope you have a successful trade.
--------------------------------------------------
- This is an explanation of the big picture.
(3-year bull market, 1-year bear market pattern)
I will explain more details when the bear market starts.
------------------------------------------------------

BTC-----Sell around 105500, target 104000 areaTechnical analysis of BTC contract on June 17:
Today, the large-cycle daily level closed with a small positive line yesterday, and the K-line pattern was a single positive line with continuous negative lines. The price was consolidating at a high level, but the attached indicator was dead cross, and the closing line yesterday was a long upper lead, and the high point was near the 109,000 area. Why is it difficult to continue the rise? The price did not break the previous high point, the continuity was poor, the technical indicators were not obvious, etc., which are all reference data; the short-cycle hourly chart showed that the European session rose yesterday, and the US session continued to break the weekend correction high position. The price fell under pressure, the intraday high was 109,000 area, and the intraday retracement low was 106,000 area. There is no obvious direction at present, so the European and American sessions are the focus, so pay attention to the strength and weakness of the European and American sessions and the breakout situation, and then we will layout according to the real-time trend. The European and American sessions are currently showing a downward trend.
Today's BTC short-term trading contract strategy:
The current price is 105,500 and directly short, stop loss in the 106,000 area; the target is the 104,000 area;

BTCUSD: 1D MA50 and 100k form a strong support base.Bitcoin has turned neutral again on its 1D technical outlook (RSI = 45.783, MACD = 629.200, ADX = 20.857) and is about to get bearish as it hit its 1D MA50 today, erasing the gains of the last 3 days. The 1D MA50 has held two times since June 5th and another one might be what Bitcoin needs to justify the next rally. Besides this however, we got a heavier Support on the P1 trendline, which on the previous ATH (Dec 17th 2024) was a Resistance and since May 12th 2025 it turned into Support. Technically, as long as 100,000 holds, we expect a strong rebound into August that may repear the inverse of December 2024 - March 2025 (-31%) and rise by +31% (TP = 132,000).
## If you like our free content follow our profile to get more daily ideas. ##
## Comments and likes are greatly appreciated. ##
