Bitcoin Consolidation: Easy, Walk Away.Bitcoin consolidation in progress. The easiest thing to do in these situations is avoid taking any trades until a new trend is established. Even smaller time frames will be harder to trade unless you are employing mean reversion strategies. At some point the market will choose which way it wants to go but trying to guess in advance is a coin flip. The broader trend is bullish but the 110K and 113K area is a tough resistance. If price struggles to break this area over the next few weeks, then a broader retrace may be more likely.
In this situation it pays to wait for specific levels to take any action at all. What type of action you take will depend on your risk tolerance and time frame. In my opinion, the higher probability scenarios will be a test of the 102K area supports, followed by reversal patterns. Even if they don't follow through to new highs, at least there will be some attempt to maintain the support since Bitcoin is still generally strong.
IF Bitcoin breaks the support (anything is possible) that will confirm the broader corrective scenario which can see price testing 95K at minimum. There is no way to know the certainty of this scenario, it is all about how price action unfolds and confirms.
This time of year is typical of lower volume, lower momentum and less follow through. Often it is better to just sit it out and wait until the season shows clear signs of improvement. Seasonal volume does not typically get back to consistently high momentum levels until November. This does not mean there will be no opportunities at all, it just means if there is going to be a time to purposely be more selective, the next couple of months would be that time.
Thank you for considering my analysis and perspective.
1-BTCUSD

The FVG was the invitation. The OB was the entryBTC delivered exactly where it needed to. It didn’t break down. It rebalanced. The chart isn’t noisy — it’s speaking. And it’s pointing to 108.3k.
The logic:
Price printed clean displacement, returned to mitigate a 1H FVG stacked on top of a refined Order Block, then paused. That pause is structure — not indecision. Volume compression confirms it: absorption, not rejection.
A deeper OB sits below at 102.5k. If we tap it, it’s not invalidation — it’s refinement. But the primary play is already in motion.
The path:
Reclaim 105.7k range high
Break above intraday liquidity
Deliver to 108.3k inefficiency fill
Execution:
Entry: 104.8k–105.1k (current OB zone)
SL: Below 103.9k
TP: 108.3k
Don’t react to the candles. React to what they represent — engineered displacement followed by precision mitigation.
Final thought:
“This isn’t a trade setup. It’s a delivery route — and I’m already onboard.”

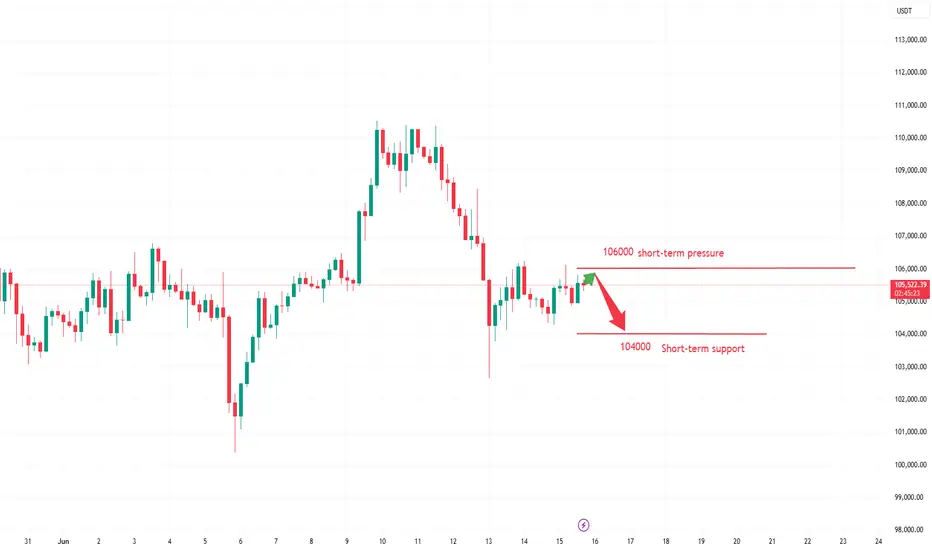
Analysis of Next Week's Market TrendsBitcoin is trading in a narrow range, with an intraday volatility of only 1.7% and trading volume shrinking by 18%, indicating market wait-and-see sentiment after key geopolitical events.
After the Israel-Iran conflict triggered $1 billion in liquidations, market panic has eased. Israel's preemptive strike on Iran on the 13th caused Bitcoin to flash crash to $102,000, but by the 15th, the market had partially digested the risks. The Fear & Greed Index stabilized at 60 (greed zone), showing that funds did not massively flee to safe havens.
Bitcoin is in a critical accumulation phase on the eve of a breakthrough. The digestion of geopolitical risks and institutional buying constitute supporting forces, but short-term attention should be paid to the risk of breakdown in the triangular pattern. It is recommended to strictly guard the defense level of $104,200 and the breakthrough point of $106,300.
Humans need to breathe, and perfect trading is like breathing—maintaining flexibility without needing to trade every market swing. The secret to profitable trading lies in implementing simple rules: repeating simple tasks consistently and enforcing them strictly over the long term.
Trading Strategy:
sell@105900-106000
TP:104000-1045000
BTCUSD - 1H. TECH.In this trading idea, we are reviewing the last price movement of Bitcoin/USD
I hope this video analysis will have a good and positive effect on your trading perspectives!
Wishing you profits in your trades.

BTCUSD: Bulls Are Winning! Long!
My dear friends,
Today we will analyse BTCUSD together☺️
The recent price action suggests a shift in mid-term momentum. A break above the current local range around 105,670.43 will confirm the new direction upwards with the target being the next key level of 106,057.41 and a reconvened placement of a stop-loss beyond the range.
❤️Sending you lots of Love and Hugs❤️

Technical Chart Analysis – BTC/USDT (4H Timeframe)📊 Current Price: ~105,108 USDT
---
🔵 Support Zone (Highlighted in Purple)
Zone Range: ~102,500 – 103,800 USDT
💡 Historical Significance:
This zone has acted as a strong support multiple times (📍June 13 & June 4), marking clear demand and buyer interest.
🛡️ Buyers stepped in strongly, causing sharp price reversals from this level.
---
🔴 Resistance Zone (Highlighted in Blue)
Zone Range: ~109,500 – 111,000 USDT
🔼 Marked with multiple failed breakout attempts (📍May 21 and projected again around June 18-20).
⛔️ Sellers dominate this zone, causing price rejection each time it was tested.
---
🔁 Rounded Bottom Formation (Cup Pattern?) ☕️
⚙️ A smooth rounded recovery pattern is forming, indicating accumulation and potential bullish continuation.
📈 If price sustains and retests the resistance again with momentum, we may see a breakout attempt.
---
🧭 Key Takeaways
Indicator Insight
🟣 Support Well-defined, historically respected zone. Good risk/reward for long entries.
🔵 Resistance Strong sell pressure zone. Needs breakout for bullish confirmation.
☕ Pattern Rounded bottom = bullish setup if volume supports the breakout.
📆 Watch Zone June 17–20 – potential resistance retest.
🔔 Risk Area Failure to hold mid-range (~105K) could lead to a retest of support.
---
🚀 Bullish Scenario
✅ Break and close above 111,000 USDT with volume.
📍 Target: 113,500–115,000 USDT 📈
🐻 Bearish Scenario
❌ Rejection at resistance again.
📍 Retest of support zone ~103,000 USDT or below.

$TOTAL2 and $USM2: Correlation never broken. What now? Today we dive into the world of crypto. We are looking into the recent rally in the Altcoins including CRYPTOCAP:ETH and §Sol and try to understand the reasons behind it and what is means for the future. CRYPTOCAP:TOTAL2 depicts the total market capitalization of all the Altcoins except CRYPTOCAP:BTC but including stable coins. When in doubt, zoom out. Today we are looking at the monthly candle stick charts for the CRYPTOCAP:TOTAL2 vs the $USM2. ECONOMICS:USM2 is the total M2 money supply from all the sources not only the banks but also other forms of cash within the economy. M2 money supply generally goes up and the economy grows and the Govt and Fed Balance sheets grow.
ECONOMICS:USM2 is primarily responsible for the increase in stock and asset prices. Crypto is no exception to it. Whenever the M2 Money supply goes up the Altcoins usually goes up. During the last Crypto cycle, the Altcoins peaked @ 1.7T $ in Nov 2021 and the ECONOMICS:USM2 peaked a few months after that in March 2022 @ 21.71T $. When the ECONOMICS:USM2 fell to 20.66T $ the Altcoins market suffered a bear market and lost 75% of the value. So, the question comes what happens to the CRYPTOCAP:TOTAL2 chart when the M2 money supply is expanding. We have clearly saw a recent surge in the Altcoin market but still below the ATH. Currently CRYPTOCAP:TOTAL2 at 1.16T $ is still below the 0.618 Fib retracement level plotted on the last cycle from top to bottom. Still CRYPTOCAP:TOTAL2 must cover a lot of ground and grow by 50% to reach its previous cycle top. In those cases, the ECONOMICS:USM2 must go up also by 1-2T $ to support such a jump in the $TOTAL2. But what will CRYPTOCAP:BTC do in that case?
Verdict : CRYPTOCAP:TOTAL2 can only go above $1.7T $ if ECONOMICS:USM2 expands by 1-2T $. Watch out for CRYPTOCAP:BTC in that case.

Current BTC Trend Analysis and Trading RecommendationsToday's overall BTC market rebounded after hitting a low of 102,614 in the early trading session, with Bitcoin's price maintaining a slow upward trend throughout the day. The intraday high reached 105,912 but encountered resistance. As the weekend approaches, historical market data shows limited volatility during weekends, so range-bound fluctuations are expected for the weekend.
From the current overall market rhythm, the price has rebounded slightly today after the previous decline. The hourly chart shows consecutive upward candles, though the price movement remains relatively slow. As time progresses, the price is expected to sustain an upward trend after pullbacks, and breaking through the short-term resistance level is only a matter of time. In terms of short-term structure and pattern, despite slight resistance and minor pullbacks, the downward momentum has weakened. We can still focus on long positions at lower levels, paying attention to the 106,000 resistance level.
BTCUSD
buy@104000-104500
tp:106000-107000
Investment itself is not the source of risk; it is only when investment behavior escapes rational control that risks lie in wait. In the trading process, always bear in mind that restraining impulsiveness is the primary criterion for success. I share trading signals daily, and all signals have been accurate without error for a full month. Regardless of your past profits or losses, with my assistance, you have the hope to achieve a breakthrough in your investment.

Support (Demand Zone): Around $90,000 — the projected downside .✅ Current Market Structure:
We’re seeing lower highs and lower lows, which typically signals a downtrend.
The price recently fell from a resistance zone (marked in green) near $110,000.
Currently, we’re bouncing upward (forming a small correction) before a potential further drop.
✅ Key Levels:
Resistance (Supply Zone): Around $108,000–$111,000 — strong selling pressure here.
Support (Demand Zone): Around $90,000 — the projected downside target.
The price might break down toward that $90,000 range after a small upward correction.
✅ Expected Scenario:
The price may rebound toward $106,000 or even up toward $108,000 (forming a lower high), then reverse and continue its descent toward $100,000, and ultimately toward $90,000.
This forms a zig-zag down — a classical downtrend structure with lower tops and lower bottoms.
✨ If you’d like, I can:
Provide entry, stop-loss, and take-profit for a short trade.
Perform a more granular technical analysis with indicators (RSI, MACD, or Fibonacci).

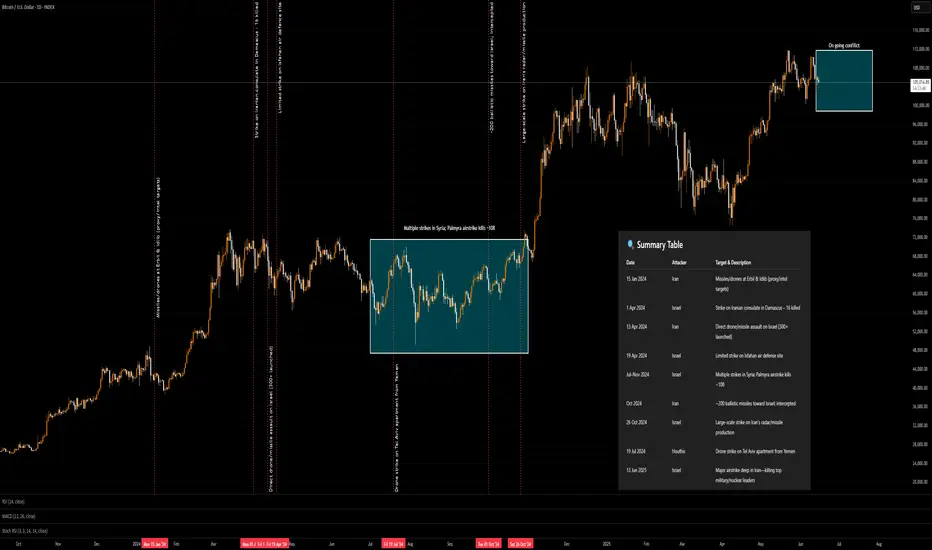
Major Conflict (Isreal - Middleeast and Iran) on CryptoAs you can see crypto is doing its own and what general markets are doing in general. I applied the dates thanks to ChatGPT to make a summary table. you can see these issues over the past two years did not make a huge impact.
The only problem is Iran's response might not be as short as the last time. therefore I am guessing a range of timeframe rather than a vertical line.
Remember any higher escalation will lead the risky assets to dump and off-risk assets rise, such as Oil and Gold.
Usually Summer time is not very profitable for crypto and as I stated in my last Youtube video I am expecting boring price action in June 2025.
This chart can clearly shows, as long as it not become a major international issue and world wide panic, such as 2019 and 2008 it would be scary moments for few weeks at top
#BTC Double Top Breakdown? Key Levels to Watch: 100K, 92K, 74Bitcoin has recently formed a double top pattern near its all-time high at $112K–$110K, signaling potential exhaustion in the bullish momentum. After a strong rejection from the $106K resistance — a critical zone that has historically failed to close above on the daily timeframe — BTC is showing increasing bearish pressure.
All major indicators — RSI, MACD, and Stochastic RSI — are aligning to confirm this potential downtrend.
Here’s the projected bearish scenario if key supports break:
A break below $100K could trigger a fall to $97K, followed by a bounce and retest.
Rejection from $100K again may lead to a drop toward $92K.
Failure to reclaim $95K–$90K could send BTC directly down to $88K.
Another failed attempt near $90K might push Bitcoin to crash toward $74K, echoing the 2024 summer correction pattern.
This setup mirrors past seasonal moves and could mark a significant shift in market structure if confirmed.
📉 Watch these key zones:
$106K – Major resistance
$100K – Psychological and structural support
$92K / $88K / $74K – Potential targets if bearish continuation plays out
⚠️ Stay alert for retests and confirmations before entries.

Bitcoin/US Dollar 1-Hour Price Chart (June 15, 2025)a 1-hour candlestick chart for Bitcoin (BTC) priced in US Dollars (USD), showing a recent price of $105,154.79 with a slight decline of -0.30% (-$311.19). The chart highlights a price range between $103,501.84 and $106,000.00, with a notable support level around $105,154.79 and a resistance zone shaded in pink between $105,217.91 and $105,767.97. The time frame spans from 10:00 to 20:00, with the current time at approximately 15:00.

Bitcoin: weekly gains and dipsThere has been a sort of roller coaster with BTCs weekly price movements during the previous week. The week started with a strong move toward $110K. Although it seemed like a fresh new momentum toward the higher grounds, or eventually new all time highest level, the price soon began to tumble down, ending the week above the $104K level. On charts, it looks more like a “pump and dump” strategy, imposing a potential for a further correction. However, the reaction of BTC market on the negative news regarding the new unrest in the Middle East was exposed shortly on Friday trading session, when the price shortly reached the $102,9K level.
The RSI modestly dropped below the 50 level, ending the week at the 47. The MA 50 currently stands as a supporting level for BTCs price, while the indicator continues to diverge from its MA200 counterparty.
As per current charts, there is a high probability that weekly gains and dips will continue. The line connecting the lowest level from the beginning of April this year and lows from the beginning of June and from the previous week shows that there is a high probability for $104K to be tested. It also perfectly combines with MA50 as a currently supporting line. In case that the $104K is breached toward the downside, then it might bring some short bearish movements with BTC. In this scenario, the $100K might be again the target. However, if the $104K sustains the selling pressure, then the BTC will return toward the $108K.

There is another Bearish BPR zone below the current price.BTC/USDT Market Update – Clear, Detailed, and Easy to Understand (Even for Beginners)
Let’s take a look at what’s happening with Bitcoin (BTC/USDT) right now explained in a way that even someone new to trading can follow along and understand.
Recently, Bitcoin hit a new high it was climbing up steadily. But then, due to negative global news related to war, the market took a hit and started dropping sharply.
Currently, BTC is trading at a (BPR) this is a technical area that often acts as a strong resistance zone, where the price tends to face rejection and reverse.
👉 Right now, Bitcoin is struggling to move higher and appears to be getting rejected from this BPR level.
But here’s where it gets more interesting:
🔻 There is another Bearish BPR zone below the current price, and the market has already touched that zone once before bouncing upward.
So what's the current situation?
📍 If Bitcoin is able to break above the current Bearish BPR (the level where it’s trading now) — it would be a bullish sign, and the market may start rising again.
📍 However, if BTC fails to break this resistance level, then we could see another strong move to the downside, possibly heading back to lower support zones.
🚨 Key Takeaway:
This level — the one BTC is currently interacting with — is very important.
📌 Traders should keep a close eye on it.
📌 Let the market reveal its direction before making any decisions.
Remember:
⚠️ This is not financial advice. Always Do Your Own Research (DYOR).

$Ginnan chart There’s a pretty simple chart. You can see what it is for yourself. See how this plays out.

Circle’s IPO and the Crypto Listing Wave: The Market EntersOn June 14, 2025, the U.S. stock market witnessed a pivotal moment for the crypto industry. Circle, issuer of the USDC stablecoin and a major player in the sector, successfully went public. Shares opened at $31 and soared to over $134 by the end of the first trading day—an explosive 330% gain.
This isn’t just a one-off success. It marks the beginning of a new chapter: the public crypto era, where leading crypto companies are stepping into the spotlight of traditional finance.
Why It Matters
Circle’s IPO signals the maturation of the crypto market. Just three years ago, crypto companies were seen as high-risk, unregulated tech startups. Now, they’re structured fintech firms with clear business models, institutional backing, and regulatory compliance.
Who’s Next in Line
Following Circle, a wave of major crypto firms is preparing for their own IPOs:
eToro – the social trading platform with crypto features has finalized its SPAC merger and is set to debut on NASDAQ.
Gemini – the exchange founded by the Winklevoss twins filed for an IPO in mid-May.
Galaxy Digital and Ripple – both confirmed listing plans for the second half of 2025.
Kraken is exploring a listing in Europe, where requirements are more flexible than in the U.S.
These companies are waiting for the right moment—regulatory clarity, growing interest in crypto ETFs, and progress in U.S. Congress (with the CLARITY and GENIUS bills gaining momentum).
What It Means for the Industry
Increased Investor Trust – Public companies must disclose financials, pass audits, and comply with regulations. This builds confidence in the broader crypto sector.
Institutional Capital Inflow – IPOs unlock access to capital from pension funds, hedge funds, and asset managers that cannot invest in private crypto startups.
Marketing Power – Going public draws media attention and boosts brand awareness. Every IPO is a PR win for the entire industry.
Risks and Challenges
Regulatory Uncertainty – Despite progress, the SEC could change direction, especially with potential political shifts.
Overvaluation Concerns – Circle’s stock is already raising eyebrows, with a P/E ratio over 200 and trading volume growing faster than revenue.
Crypto Market Dependency – If crypto prices crash, the valuations of these companies could quickly collapse.
What’s Next
Expect up to 10 more crypto IPOs over the next 6–12 months, including players in DeFi, blockchain infrastructure, and Web3. This is the next stage in crypto’s journey toward mainstream legitimacy.
What was once the domain of tech rebels and early adopters is now becoming a business—with a stock ticker and quarterly earnings. And that changes everything.

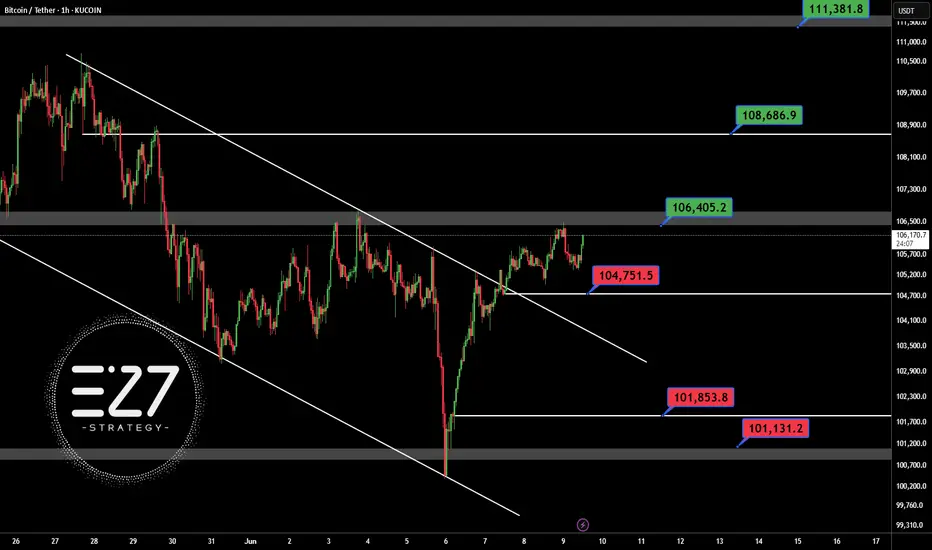
BTCUSDTSafe for open long position in BINANCE:BTCUSDT abow 106.400$ in H1 time frame.
First support: 104.750$
Best support: 101.850 - 101.131 $
First resistance: 106.400$
Best target this chart: 108.700 - 111.381$
Contol money management
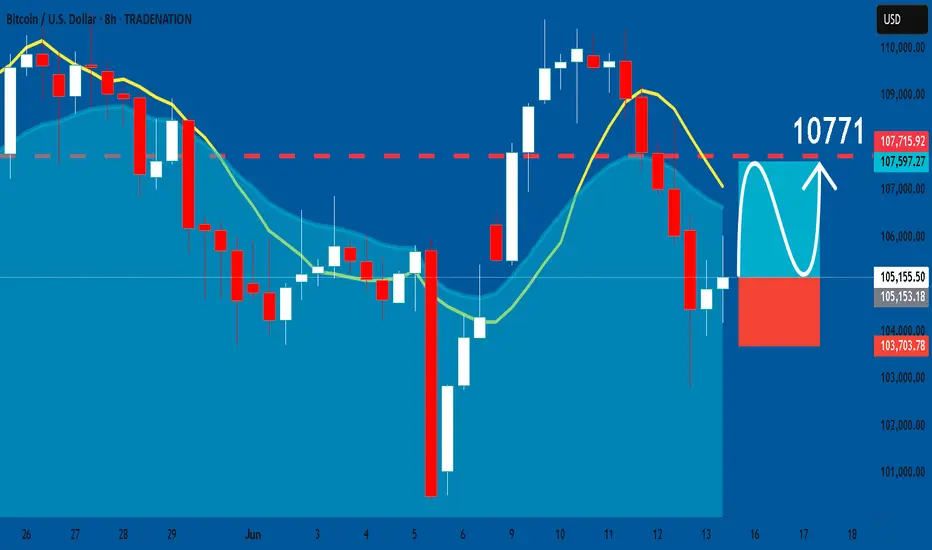
BTCUSD: Long Trading Opportunity
BTCUSD
- Classic bullish formation
- Our team expects growth
SUGGESTED TRADE:
Swing Trade
Buy BTCUSD
Entry Level - 10515
Sl - 10370
Tp - 10771
Our Risk - 1%
Start protection of your profits from lower levels
Disclosure: I am part of Trade Nation's Influencer program and receive a monthly fee for using their TradingView charts in my analysis.
❤️ Please, support our work with like & comment! ❤️
BTC-----Sell around 100500, target 103500 areaTechnical analysis of BTC contract on June 14:
Today, the large-cycle daily level closed with a small negative line yesterday, the K-line pattern continued to fall, the price was below the moving average, and the attached indicator was dead cross. The decline in the big trend was still very obvious. We should pay attention to the breakout and pressure signal of the high point of yesterday's correction and pullback in the 106200 area; the short-cycle hourly chart yesterday's price rebounded and corrected after hitting the low point, and retreated under pressure in the Asian morning today. The current K-line pattern continued to fall, and the attached indicator was dead cross. Then the trend is likely to fluctuate downward during the day, but the strength is not expected to be great over the weekend, so it is still short-term.
BTC short-term trading contract strategy:
Directly short in the 100500 area, stop loss in the 105500 area; target is 103500 area;

BTCUSD: Decoding the Price Action Through "Tape Reading"🚀 BTCUSD: Decoding the Price Action Through "Tape Reading" 🚀
Hey Traders,
Let's dive into a "tape reading" analysis of BTCUSD, breaking down the recent price movements and looking ahead. We've seen some fascinating patterns emerge, and understanding them could be key to our next moves.
🔍 A Look Back: The Bullish Flag Formations 🔍
Our journey begins on April 7th, 2025, with the establishment of a strong "Flag Pole" at $74,489.00. This was supported by a robust double bottom, setting the stage for what was to come.
First "Flag" Confirmation: We saw the first "Flag" form, confirmed by a powerful "Hammer" candle on April 20th, 2025. This Hammer, with its unique "bottom-less Marubozu" body, signaled significant underlying strength.
Second "Flag" Confirmation: Another "Flag" emerged, solidified by strong multi-day bottom support around $94,791.00. This resilience suggested continued upward momentum.
The Breakout: On May 8th, 2025, BTCUSD surged, breaking out of its previous patterns and entering a new "flag pole" formation.
Third "Flag" & All-Time High: May 15th, 2025, brought the third "Flag" formation, again supported by a "Hammer" and a bullish Marubozu. This momentum culminated in a breach of the $105,770.00 multi-month price level on May 20th, 2025, breaking the previous all-time high from December 17th, 2024! We then rocketed to a new all-time high of $112,000.
📉 Recent Developments: The Downtrend and Key Levels 📉
Since the all-time high, we've started to experience a shift:
Downtrend Begins: A downtrend initiated around May 22nd, 2025.
High-Low Formations: We observed a second high-low formation on May 27th, 2025, followed by another on June 9th, 2025.
Double Top & Hanging Man: A clear double top formation emerged, further supported by a "Hanging Man" candle on June 10th, 2025.
🔮 What's Next? The Critical Close 🔮
Today's candle close is absolutely paramount! As of now, the candle is still forming, but my current read suggests a potential move to fill the wick of the June 13th, 2025, "Hammer" candle.
The direction BTCUSD takes – North or South – will largely be dictated by how today's candle closes. This will be our prime dominant signal.
Monthly Candle Perspective:
Interestingly, the Monthly candle is showing similar "Flag" patterns. Check out the chart here for a broader perspective:
Let me know your thoughts in the comments below! Are you seeing the same patterns?
Trade safe!
_________________________________________________________________________________
⚠️ Disclaimer: This post is educational content and does not constitute investment advice, financial advice, or trading recommendations. The views expressed here are based on technical analysis and are shared solely for informational purposes. The stock market is subject to risks, including capital loss, and readers should exercise due diligence before investing. We do not take responsibility for decisions made based on this content. Consult a certified financial advisor for personalized guidance.

ETH UPDATE 🛡️ Ethereum Holds the Line — Critical Support Zone Tested Again
Because Ethereum has plummeted over 14% since Wednesday, traders and long-term holders are worried. Bullish investors expected ETH to break over $3,000 and confirm a wider cryptocurrency rise days earlier.
However, global turmoil has slowed markets. Israel's assaults on Iran and retaliations shook global markets on Thursday, causing crypto asset volatility and risk-off.
Historical trends between August 2021 and early 2024 suggest that keeping $2,500 has led to rallies reaching $4,000. Rekt believes Ethereum must maintain consistency around this zone to prevent a deeper retreat and maintain bullish momentum.
ETH has held $2,500 over five weeks, proving its stability despite numerous testing. In the weeks ahead, altcoins and the crypto market will depend on whether Ethereum can maintain this footing again.
Ethereum fell sharply from $2,830 this week to $2,556. On the daily chart, ETH has been rangebound between $2,500 and $2,830 for weeks. Ethereum has held above the 50-day and 100-day moving averages, which are rising, despite international threats.
The red 200-day moving average at $2,642 has provided resistance. A retracement followed ETH's short break above this level, which it failed to keep. Recent volumes have increased due to heightened attention and emotive price responses in the Israel-Iran conflict.
The $2,500–$2,520 support zone is important. This region has been a floor before and might rocket bulls if they recover control. A clear fall below $2,500 might turn sentiment negative and lead to $2,300.

BTC - FRACTAL!!!!I found a fractal, the price should rise to the range of 110888, and then there will be a sharp decline, a squeeze will form, with the price supposedly rising and crossing over, but in reality, the price will be pushed down sharply to a range below $90k. I have an idea related to this, I called it the dragon's wings pattern. At one point, I simply realized that the chart repeats what has already happened, and this is exactly what needs to be analyzed. I think the price will go exactly as I have drawn it. All the best and stay disciplined!

BTCUSD Hey everyone,
Taking a closer look at the BTCUSD chart, I've plotted some interesting price levels that could act as significant support and resistance in the coming weeks. This analysis aligns with what appears to be a trend-based Fibonacci time analysis, and I've also marked some crucial dates where we might see major market changes.
Based on our observations, we're seeing a range of important price action. For instance, notice the cluster of highs around the 112,048 to 113,343 area. These levels, particularly those marked with an asterisk such as 112,167, 112,503, and 113,006, have previously shown strong upward movements, suggesting they could serve as notable resistance if price attempts to push higher.
Conversely, on the downside, the levels from 111,952 down to 110,665, with points like 111,833, 111,499, and 110,832 highlighted, have historically seen bounces or significant slowing of downward momentum. These could very well act as crucial support areas, preventing further declines.
As we move forward, it will be crucial to observe how price interacts with these levels, especially around the following dates where we might see major market shifts:
July 4th, 2025
July 11th, 2025
July 26th, 2025
August 9th, 2025
August 16th, 2025
September 9th, 2025
The higher resistance points reaching up to 118,793 and lower support extending to 105,407 define a broader range we'll be watching closely.
Keep an eye on these zones for potential reversals or breakthroughs, particularly around the dates mentioned, which could signal the next significant move for Bitcoin. As always, manage your risk accordingly.
What are your thoughts on these levels and potential turning points? Share in the comments below!
Want to Level Up?
Join Shunya Trade’s Mentoring Program to master these strategies and sharpen your technical analysis skills.
Your Feedback Matters!
Let me know how this analysis works for you—your insights will shape future reports!
Let’s navigate the markets together—wisely and proactively.
Trade safely!
⚠️ Disclaimer: This post is educational content and does not constitute investment advice, financial advice, or trading recommendations. The views expressed here are based on technical analysis and are shared solely for informational purposes. The stock market is subject to risks, including capital loss, and readers should exercise due diligence before investing. We do not take responsibility for decisions made based on this content. Consult a certified financial advisor for personalized guidance.
Price High Price Low
112048 111952
112084 111916
*112167 *111833
*112335 *111666
*112503 *111499
*112670 *111332
*112838 *111165
*113006 *110998
*113174 *110832
*113343 *110665
114017 110001
*114693 *109339
115372 108678
116052 108020
116734 107364
*117419 *106709
118105 106057
118793 105407
