Bitcoin Dominance Will Drop To 60% SoonGood Morning Trading Family,
I really don't have much to say on this post. My last post on Ethereum showed us an inverse head and shoulders pattern, which plays out over 85% of the time. This is a clear sign that altcoins may rally within the next week or two. And here, on our Bitcoin dominance chart, you can see that the patterns are clear, BTC dom cannot last at this level much longer before a breakdown to 61% or lower occurs. Be prepared. FOMO will get real.
Best,
Stew
1-BTCUSD

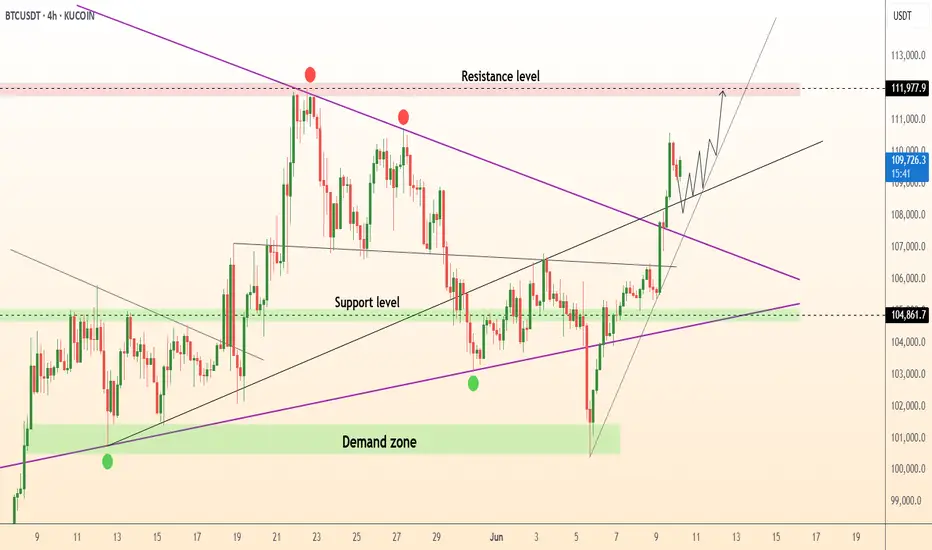
BTCUSDT – Bullish Continuation Setup (4H Chart)Bitcoin shows a strong bullish structure on the 4H timeframe after breaking and holding above key EMAs (20/50/100/200). Price is consolidating just above the breakout zone, suggesting potential continuation.
Support Levels:
$105,396
$101,409
$97,340
$93,343
Resistance Levels:
Immediate: $111,633
Major Target: $122,318 (+9.06% potential upside)
Indicators:
RSI: Holding at ~63.7, still below overbought — suggests room for momentum.
EMA Confluence: All major EMAs are aligned below price, acting as dynamic support.
If BTC holds above $109K, a move toward $122K looks likely. A clean breakout above $111.6K could ignite the next leg up.
Bullish bias intact
Target: $122,318
Risk Management: Watch for invalidation if price breaks below $105K.
This is not financial advice, please do your research before investing, as we are not responsible for any of your losses or profits.
Please like, share, and comment on this idea if you liked it.
#BTCUSDT #Bitcoin #Crypto #TradingView

BTC alternative scenarioThis Scenario is Possible,not a big fan of it but if I get a reaction on the level will go for a buy with small risk
levels highlighted
#BTC/USDT#BTC
The price is moving within a descending channel on the 1-hour frame, adhering well to it, and is heading for a strong breakout and retest.
We are experiencing a rebound from the lower boundary of the descending channel. This support is at 108883.
We have a downtrend on the RSI indicator that is about to be broken and retested, supporting the upward trend.
We are looking for stability above the 100 Moving Average.
Entry price: 109380
First target: 109948
Second target: 110800
Third target: 111670

BITCOIN Is 'Bullish June Seasonality' about to kick-in?Bitcoin (BTCUSD) has started June on a very promising note, recovering most of last week's losses and is potentially headed for a new All Time High (ATH). This however, should be no surprise as BTC has exhibited amazing strength during the month of June and onwards since 2013.
As this chart shows, the market has historically rallied on June, in fact it is the month that kick-started Bitcoin's final rallies towards the Top on its last three Cycles.
Based on the 2W RSI, which is ranging within the 0.236 - 0.618 Fibonacci levels, we can argue that the price action is closer to June 2017 than other Cycles. As to how high it can get to, we've analyzed that on other studies, the current analysis only serves to show you that historically we are set for a strong 'Bullish June Seasonality' effect.
Do you agree that this is about to kick-in? Feel free to let us know in the comments section below!
-------------------------------------------------------------------------------
** Please LIKE 👍, FOLLOW ✅, SHARE 🙌 and COMMENT ✍ if you enjoy this idea! Also share your ideas and charts in the comments section below! This is best way to keep it relevant, support us, keep the content here free and allow the idea to reach as many people as possible. **
-------------------------------------------------------------------------------
💸💸💸💸💸💸
👇 👇 👇 👇 👇 👇

Bullish bounce?Bitcoin (BTC/USD) has bounced off the pivot and oculd rise to the 1st resistance.
Pivot: 108,446.67
1st Support: 106,491.59
1st Resistance: 111,566.95
Risk Warning:
Trading Forex and CFDs carries a high level of risk to your capital and you should only trade with money you can afford to lose. Trading Forex and CFDs may not be suitable for all investors, so please ensure that you fully understand the risks involved and seek independent advice if necessary.
Disclaimer:
The above opinions given constitute general market commentary, and do not constitute the opinion or advice of IC Markets or any form of personal or investment advice.
Any opinions, news, research, analyses, prices, other information, or links to third-party sites contained on this website are provided on an "as-is" basis, are intended only to be informative, is not an advice nor a recommendation, nor research, or a record of our trading prices, or an offer of, or solicitation for a transaction in any financial instrument and thus should not be treated as such. The information provided does not involve any specific investment objectives, financial situation and needs of any specific person who may receive it. Please be aware, that past performance is not a reliable indicator of future performance and/or results. Past Performance or Forward-looking scenarios based upon the reasonable beliefs of the third-party provider are not a guarantee of future performance. Actual results may differ materially from those anticipated in forward-looking or past performance statements. IC Markets makes no representation or warranty and assumes no liability as to the accuracy or completeness of the information provided, nor any loss arising from any investment based on a recommendation, forecast or any information supplied by any third-party.

$BTC - Poor HighsBitcoin cleared the previous highs resting at 110k; however, it is still facing resistance at 110.3k.
We need to break above 110k to clear the significant highs at 112k.
Otherwise, I still expect a retest of 106k–107k before any further upward movement.

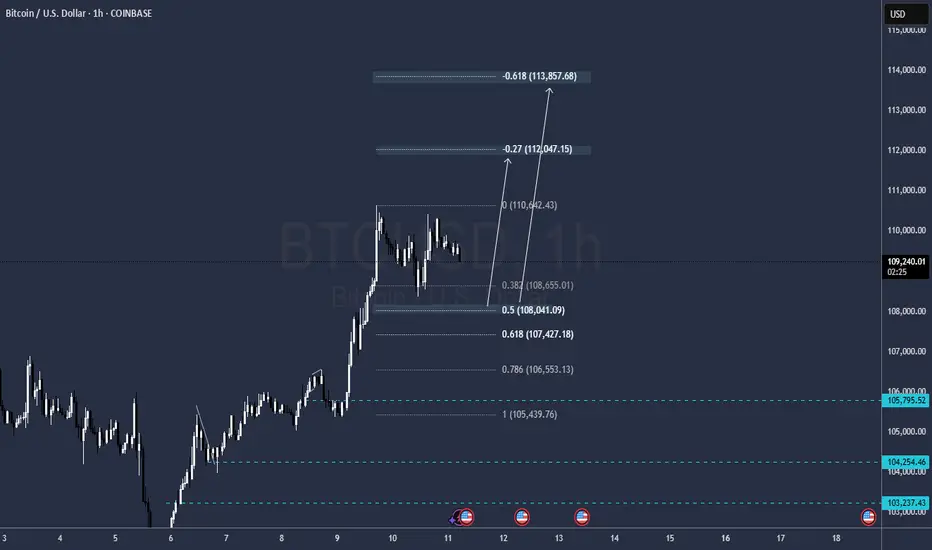
Do technical signals show Bitcoin’s path to $130K? Do technical signals show Bitcoin’s path to $130K?
Bitcoin briefly pushed above $110,000 for the second time this month, before pulling back slightly to trade around $109,500. The market consolidating just below the 61.8% Fibonacci extension level could be suggesting strong resistance is being tested near current levels.
Bitcoin remains within reach of its all-time high at $111,965, set on May 22.
The latest upward move may have been supported by comments from U.S. Commerce Secretary Howard Lutnick, who said trade talks with China in London were progressing well and likely to extend for a third day.
CNBC analyst Todd Gordon expects a breakout toward $130,000 according to his weekly chart analysis. According to our chart, A breakout above 111,897 could open the path to the 78.6% extension around $122,093, followed by the 100% extension target at $135,081

BTCUSD: Very aggressive rally to 130k has just started.Bitcoin turned bullish again on its 1D technical outlook (RSI = 61.233, MACD = 1503.700, ADX = 19.938) following yesterday's strong 1D candle, which is a result of the June 6th 1D MA50 rebound, and is even close to turning the day positive despite the correction early on. This rise is similar to the one that started after the April 7th rebound and eventually pearked just under the 2.382 Fibonacci extension. We remain bullish on Bitcoin, TP = 130,000.
## If you like our free content follow our profile to get more daily ideas. ##
## Comments and likes are greatly appreciated. ##

₿ Bitcoin: Push to the Upside! Bitcoin has made a significant push to the upside, which brought it closer to the upper blue Target Zone between $117,553 and $130,891, where we primarily expect the corrective rise of green wave B to conclude. We consider this price range an opportunity to take partial profits or to open short hedges for tactical protection of existing long positions — thus, we don't plan to sell all our Bitcoin holdings there. Potential short hedges could be secured with a stop 1% above the upper edge of the zone since there's a 30% chance that price could exceed this zone to develop a new high for blue wave alt.(i) before reversing later. Primarily, however, green wave C should commence in the upper blue zone and drive BTC down into the lower blue zone between $62,395 and $51,323—and thus to the low of orange wave a.
📈 Over 190 precise analyses, clear entry points, and defined Target Zones - that's what we do.

Bitcoin - Here we have the all time high!Bitcoin - CRYPTO:BTCUSD - is just getting started:
(click chart above to see the in depth analysis👆🏻)
It was really just a matter of time until we see a new all time high on Bitcoin. Consindering that over the past two months alone, Bitcoin rose another +50%, this was a clear indication that bulls are taking over. But this all time high is clearly not the end of the bullrun.
Levels to watch: $300.000
Keep your long term vision!
Philip (BasicTrading)

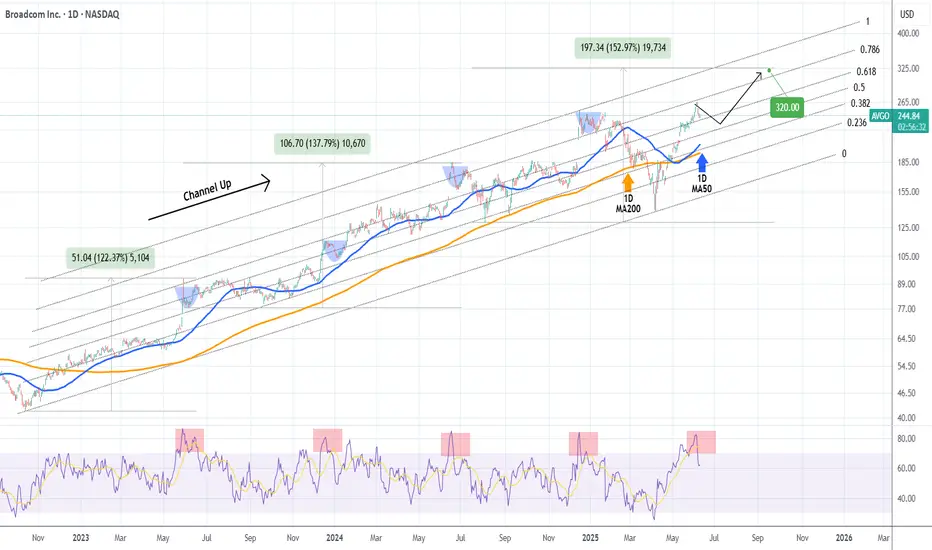
BROADCOM Pull-back to demand zone possible before new High.Broadcom Inc. (AVGO) is currently on a 3-day pull-back that started right on the 0.786 Fibonacci level of the 2.5 year Channel Up. The 1D RSI got heavily rejected from deep inside the overbought zone (>70.00) to back down below it and the only times that happened within this pattern, was during short-medium term pull-backs towards its 1D MA50 (blue trend-line).
As a result, the current pull-back can extend a little more towards the 1D MA50 and then rebound. Given a +15% added increas on each Bullish Leg of the Channel Up, we expect to see $320 next.
-------------------------------------------------------------------------------
** Please LIKE 👍, FOLLOW ✅, SHARE 🙌 and COMMENT ✍ if you enjoy this idea! Also share your ideas and charts in the comments section below! This is best way to keep it relevant, support us, keep the content here free and allow the idea to reach as many people as possible. **
-------------------------------------------------------------------------------
💸💸💸💸💸💸
👇 👇 👇 👇 👇 👇
Today's Bitcoin Signal: Time to be braveHello friends🙌
Given the good price movement from support and buyers entering, now we can enter the position with capital and risk management and move with it to the specified targets.
🔥Join us for more signals🔥
*Trade safely with us*

Inverse Head and Shoulders Now Clear On Bitcoin ChartTrading Fam,
It has now become apparent that Bitcoin has formed an inverse head and shoulders pattern on the daily. This is very bullish and should the pattern follow through, it gives some good long-range targets to shoot for by the end of this year and potentially, well into the next.
Calculating our first target is relatively simple. We draw a measurement from the bottom of the head (that largest dip) to the neckline. We then move that measurement line to an approximated breakout area. This then gives us an estimated target of around 150k. I will say that this is a fairly sure target before the end of the year if and when that neckline is broken to the upside.
Target number two should be that 350 DMA in my opinion. Bitcoin likes to kiss that 350 DMA in bullish markets. So, where ever that ends up being pricewise during this next upwards movement is a good target #2. I would estimate it will be at least 175-180k.
But if we break that 350 DMA to the upside, then you will know the end of our bull cycle is drawing close. Bitcoin may blow-off here and generally would stay above that 350 DMA for at least another month or two. In our last bull cycle it remained above the 350 DMA for 5 and a half months. Selling anytime we are significantly above that 350 DMA pricewise and timewise is not a bad strategy because you will know we are nearing the end of our bull cycle at this point.
I hope this post gives you some good long-term targets and trading strategies going forward. Personally, I will be looking to sell much if not most of my holdings once Bitcoin breaks above that 350 DMA. Of course, as always, I will keep you all posted when that time comes.
Best,
Stew

BTC INTRADAY Bullish breakout supported at 103850Trend Overview:
Bitcoin (BTC/USD) remains in a bullish trend, characterised by higher highs and higher lows. The recent intraday price action is forming a continuation consolidation pattern, suggesting a potential pause before a renewed move higher.
Key Technical Levels:
Support: 103,330 (primary pivot), followed by 100,680 and 97,700
Resistance: 113,040 (initial), then 115,510 and 117,510
Technical Outlook:
A pullback to the 103,850 level, which aligns with the previous consolidation zone, could act as a platform for renewed buying interest. A confirmed bounce from this support may trigger a continuation toward the next resistance levels at 112,360, 113,740, and ultimately 116,400.
Conversely, a daily close below 103,850 would suggest weakening bullish momentum. This scenario would shift the bias to bearish in the short term, potentially targeting 102,340 and 100,890 as downside levels.
Conclusion:
BTC/USD maintains a bullish structure while trading above the 103,850 support. A bounce from this level would validate the consolidation as a continuation pattern, with upside potential toward the 112,360 area. A breakdown below 103,850, however, would invalidate this view and suggest deeper corrective risk.
This communication is for informational purposes only and should not be viewed as any form of recommendation as to a particular course of action or as investment advice. It is not intended as an offer or solicitation for the purchase or sale of any financial instrument or as an official confirmation of any transaction. Opinions, estimates and assumptions expressed herein are made as of the date of this communication and are subject to change without notice. This communication has been prepared based upon information, including market prices, data and other information, believed to be reliable; however, Trade Nation does not warrant its completeness or accuracy. All market prices and market data contained in or attached to this communication are indicative and subject to change without notice.

SPY/QQQ Plan Your Trade For 6-10 : POP PatternToday's POP pattern suggests a potential big price move will take place. Given the overnight activity on the ES (rallying higher then rolling over), I suggest today's price move may attempt to retest these overnight highs, then repeat the breakdown phase into the close.
The markets continue to try to melt upward. This trend will continue until the markets decide to break downward.
After the deep low created by the tariff news, the markets continue to try to rally to new highs. It is very likely that Q2 earnings data may push the SPY to new ATH levels before we see any big rotation in price.
The markets have a tendency to move just above recent highs, then stall and revert downward as a pullback. This move may be no different.
The continued stalling of price trying to move higher recently suggests the markets are running into moderate resistance and I believe traders are actively pulling capital away from this rally.
The trend is still BULLISH. Stay cautious of this upward move as a breakdown could happen at any time.
Gold and Silver are moving into an impressive rally phase. Silver and Platinum have moved considerably higher over the past 10+ days. I believe Gold is lagging and will make a big move higher over the next 5 to 10+ days.
Silver is targeting $41-44+. Gold should target $3400 to $3500+ near the same time.
Bitcoin made a huge rally yesterday - reaching my 110,500 upper resistance level. Now, we see if Bitcoin has the momentum to carry higher or if it will fail and rollover into a downtrend.
It seems we are right as a MAKE or BREAK level in the markets. I'm still a believer of MELT UP until it fails.
I continue to watch for technical failure - but I've not seen it happen yet.
Get some.
#trading #research #investing #tradingalgos #tradingsignals #cycles #fibonacci #elliotwave #modelingsystems #stocks #bitcoin #btcusd #cryptos #spy #gold #nq #investing #trading #spytrading #spymarket #tradingmarket #stockmarket #silver

DeGRAM | BTCUSD fixed above the downtrend line📊 Technical Analysis
● Bulls pierced the descending purple trend-line and closed two candles above the 106 k pivot, confirming a pennant breakout and resetting higher-lows along the black mid-channel.
● Re-test of 104.8 k demand (green band) held as support; the new up-sloping flag projects to the 111.8 k-112 k red supply at the channel roof, with dynamic backup now rising to 103.8 k.
💡 Fundamental Analysis
● U.S. CPI whispers point to a softer June headline while spot-ETF cohort added another 3 200 BTC in two sessions and exchange reserves keep declining, underscoring supply squeeze amid easing rate fears.
✨ Summary
Long 104.8-106 k; sustained trade >107 k targets 111.8 k → 115 k. Bull thesis void on a 4 h close below 99 k.
-------------------
Share your opinion in the comments and support the idea with a like. Thanks for your support!
BTC Short. Its time to correctionStrong Sell Limits sitting at our entry level!
SELL LIMIT / SWING TRADE
ENTRY: 106106.3
SL: 109676.8
TP: 93409.1
Bearish trend is active and this would be the time for correction and even maybe for 91350 gap close .
Join our free DC group for more and faster news about market. Forex,Crypto,Stocks - Fifteenmin crypto group. Dm me if you enjoy this idea.

BTC 4H – Critical Support Zones Being TestedCRYPTOCAP:BTC is currently retesting its $107.2k support, which has now turned into resistance after a decisive breakdown.
Support Levels to Watch:
- Upper Support Zone: $105k – $104.4k
- Lower Support Zone: $101.4k – $100.7k
Bounce from $104.4k–$105k will be a temporary relief, but it needs strength to reclaim $107.2k.
If the upper zone is not held, the next leg will be towards the lower zone, near $101.4k—$100.7k.
Breakout confirmation only above $110k (previous rejection zone).
The market is showing signs of weakness, especially with increased selling around resistance. Avoid rushing into trades—better setups may come if key zones hold or break.
Tip: Watch for bullish divergences or strong volume at the lower support for potential reversal setups.

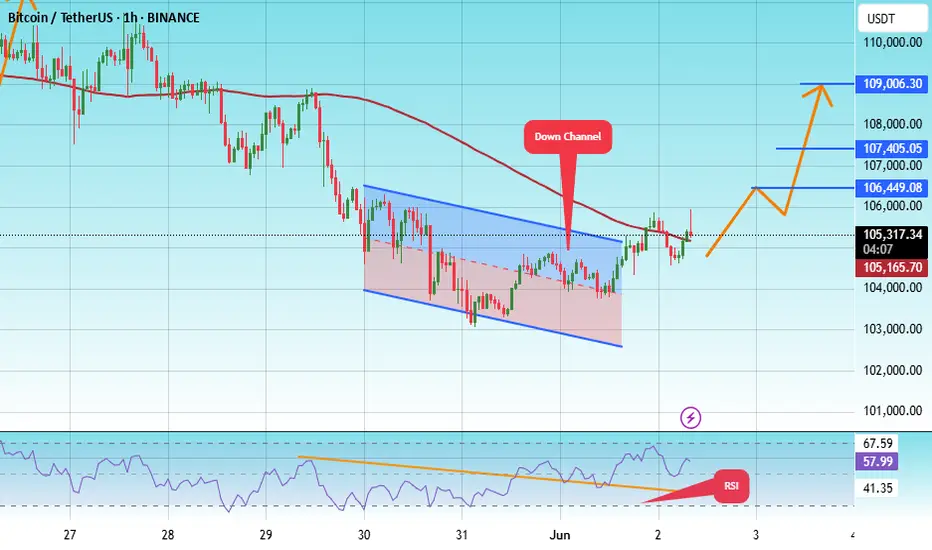
#BTC/USDT#BTC
The price is moving within a descending channel on the 1-hour frame, adhering well to it, and is heading for a strong breakout and retest.
We are experiencing a rebound from the lower boundary of the descending channel, which is support at 103141.
We are experiencing a downtrend on the RSI indicator, which is about to break and retest, supporting the upward trend.
We are looking for stability above the 100 moving average.
Entry price: 105268
First target: 106500
Second target: 107405
Third target: 109006
DeGRAM | BTCUSD held the $100k level📊 Technical Analysis
● Bounce from 99.8-100 k confluence (violet trend-line + former wedge top + horizontal demand) confirms the zone as fresh support.
● Price coils in a tight pennant under 106 k; 1.618 target of the pattern meets the rising-channel roof and red supply at 111-112 k, while RSI prints higher lows, flagging hidden bullish momentum.
💡 Fundamental Analysis
● CME futures basis widened above 10 % annualised as softer US claims cooled dollar bids, boosting carry appetite; meanwhile, on-chain reserves keep shrinking, hinting at supply squeeze.
✨ Summary
Buy 100-103 k; pennant break >106 k aims 111 k → 115 k. Bull view void on an H16 close below 99 k.
-------------------
Share your opinion in the comments and support the idea with a like. Thanks for your support!

Bitcoin Rally Overextended: Patience is Key for the Next Move💹 BTC/USDC – Bullish Outlook, heres my Trade Plan.
Bitcoin (BTC/USDC) is currently maintaining a strong bullish trajectory 🚀, showing impressive momentum after breaking through recent resistance levels 🔓.
However, price is now overextended from the last swing low, and I’m anticipating a pullback into value 🔄 — specifically targeting the 50%–61.8% Fibonacci retracement zone drawn from the latest swing low to swing high 📐. This zone often acts as a rebalancing point for institutional traders and provides confluence for smart entries 🎯.
I’ll be closely watching this retracement area for signs of support forming, and more importantly, a bullish break in market structure 🧠📊. Only after that confirmation, would I consider executing a long position — no structure break, no trade ✅.
This isn’t about predicting — it’s about reacting with discipline.
