1-BTCUSD

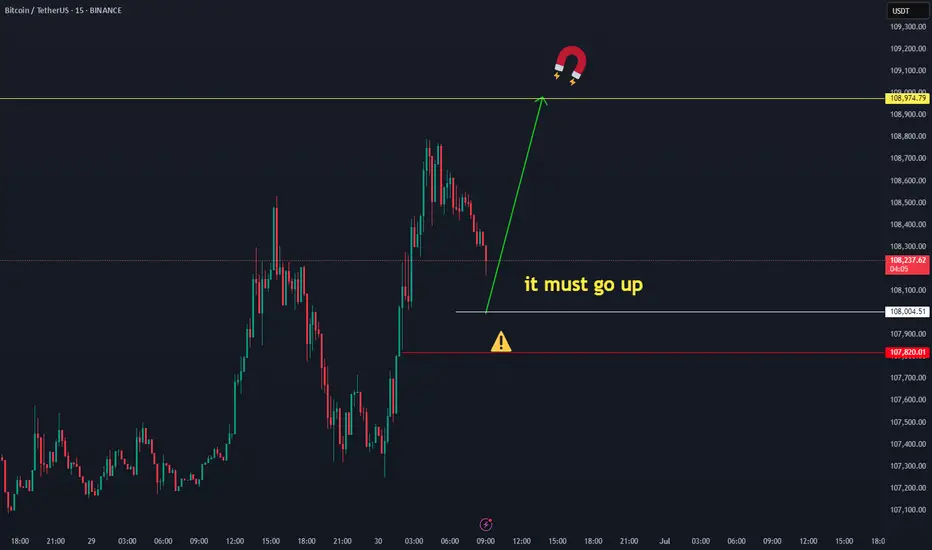
BTC at Critical Resistance… Drop Incoming!Hi traders! Currently analyzing BTCUSD on the 1H timeframe.
Price is reacting to the upper boundary of a descending channel, where sellers are showing strong pressure. This area has previously acted as a significant resistance, pushing price lower multiple times.
I'm now selling from 108,075.19, expecting a bearish move towards my target at the bottom of the channel.
Take Profit: 104,493.63
Stop Loss: 111,891.49
RSI is showing signs of bearish divergence near the resistance area, adding confluence to this setup.
Price may have performed a liquidity grab above the trendline before rejecting the area, which aligns with the current market structure.
I'm actively managing this trade, keeping an eye on how price behaves around this key level.
Disclaimer: This is not financial advice. This is my personal analysis shared for educational purposes only.

HolderStat┆BTCUSD forming the triangleBINANCE:BTCUSDT has reclaimed the $106,000 support and broken out of a triangle structure. The path now leads toward 111K, a major resistance zone. Similar setups have triggered strong rallies before, and bulls are defending levels aggressively.

June 30 Bitcoin Bybit chart analysisHello
This is Bitcoin Guide.
If you "follow"
You can receive real-time movement paths and comment notifications on major sections.
If my analysis was helpful,
Please click the booster button at the bottom.
This is the Bitcoin 30-minute chart.
There is no separate indicator announcement today.
The weekly and daily charts are being adjusted at the same time as they are created.
The strategy was carried out based on the Nasdaq pattern and the Tether dominance pattern.
The long position entry section on the 25th, $106,746, was connected as is.
*When the blue finger moves,
It is a two-way neutral
short->long switching or long waiting strategy.
1. $108,138.1 short position entry section / stop loss price when orange resistance line is broken
2. $107,507.9 long position switching / stop loss price when green support line is broken
3. $108,507.9 long position 1st target -> Good 2nd target price
You can also use the long position re-entry indicated in the middle.
If it comes down right away without touching the short entry section at the top,
it is a long waiting strategy at the gap section of 107,102.7 dollars,
and the stop loss price is the same.
And, if it succeeds in rebounding within the purple support line today,
the reason it is safe from a long position is
because the low point of the weekly and daily candles created this week is maintained without additional deviation.
Please note that the 1st section at the bottom is a sideways market / the 2nd section is open up to the bottom.
Please use my analysis article so far only for reference and use,
and I hope you operate safely with the principle trading and stop loss price.
Thank you.

BITCOIN - Price can continue grow inside flat to $107933 level#BTC
The price is moving within a descending channel on the 1-hour frame and is expected to break and continue upward.
We have a trend to stabilize above the 100 moving average once again.
We have a downtrend on the RSI indicator that supports the upward move with a breakout.
We have a support area at the lower boundary of the channel at 106500, acting as strong support from which the price can rebound.
We have a major support area in green that pushed the price upward at 106000.
Entry price: 106736
First target: 106996
Second target: 107434
Third target: 107933
To manage risk, don't forget stop loss and capital management.
When you reach the first target, save some profits and then change your stop order to an entry order.
For inquiries, please comment.
Thank you.

BTCUSD – Major Decision Point at The Edge📍 By: MJTrading |||
Bitcoin has rallied sharply from ~$98K and is now testing a critical confluence zone — the top of the descending channel and a strong supply area, known as "The Edge."
EMAs are turning up, supporting bullish momentum
⏳ What’s Next?
At this stage, two scenarios emerge:
⚠️ This is a make-or-break zone:
🟩 Breakout above the channel signals trend reversal → next resistance: $111K
🟨 Rejection leads to a move back to the $103K or $100K levels
This setup offers a high-RR opportunity for both breakout traders and mean reversion players.
🧠 Trade the reaction at the edge, not the prediction.
Thanks for your attention...
Share your thoughts...
—
#BTCUSD #Bitcoin #CryptoTrading #TheEdge #BreakoutOrBounce #CryptoSetup #DescendingChannel #SmartMoney #TechnicalAnalysis #PriceAction #SwingTrade #EMA #RiskReward #MJTrading #4hChart #TrendDecision #SupplyZone

BITCOIN DUMP TO $87,000?!According to my ‘Elliott Wave Theory’ strategy, BTC has now competed its 5 Wave Impulse run OR is very close to completion!
Is it time for price to start correcting and dump down towards $87,000?
Let me know in the comments what you think.

June 25 Bitcoin Bybit chart analysisHello
This is Bitcoin Guide.
If you "follow"
You can receive real-time movement paths and comment notifications on major sections.
If my analysis was helpful,
Please click the booster button at the bottom.
This is the Bitcoin 30-minute chart.
Nasdaq indicators will be announced at 11 o'clock shortly.
Nasdaq is rising vertically + renewing its all-time high.
Accordingly, I ignored the weekly MACD dead cross and
proposed the strategy for the pattern by substituting Tether dominance.
Although it is not visible on the screen,
I created today's strategy with the condition of maintaining the long position of $100,587.9 that was confirmed on the 23rd.
* One-way long position strategy when the red finger moves
1. $106,746 long position entry section / When the purple support line is broken
or when section 2 is touched, stop loss price
2. $108,66 long position 1st target -> Good 2nd -> Great 3rd target price
When section 1 at the top touches, it can be connected to an upward trend,
and section 2 is a sideways market.
At the very bottom and the very top,
I have indicated the maximum possible trend until tomorrow afternoon.
Up to this point, I ask that you simply use my analysis for reference and use only
I hope that you will operate safely with the principle of trading and stop loss.
Thank you.

Trading the Impulse Rally Retracement — Price and Time Symmetry The Stop Loss Triangle is back!
This time with BITSTAMP:BTCUSD coming off its recent impulse rally. For those of you that aren’t familiar with my strategy — let me start from the beginning…
This concept involves positioning against the opposing decline in price and time as a precursor to our theoretical projection. If the underlying enters our predetermined faded cross-section, the stop loss is triggered to prevent sideways consolidation and the erosion of contract premiums or leverage decay.
This inherently ‘sclene’ triangle is constructed by drawing a straight trend line through the bottoming reversal candle and the furthest projection in price and time symmetry (78.6%) of the retracement. Once connected, draw a vertically positioned straight line from the highest or lowest point in the previously identified retracement to the bottom reversal candle area once again. To create a ‘right triangle’, now turn 90 degrees towards the final point, which is determined by the nearest projection in price and time symmetry (38.2%). This allows time after the imposed price and time date, yet not enough for premium or leverage decay to become significant.
In its entirety, this forms the stop loss triangle.
I encourage my followers to identify and explore the system on their own. As always, feel free to ask me anything related to it. We’ll follow along and you’ll be amazed at the precision of Fibonacci symmetry.
CHEERS

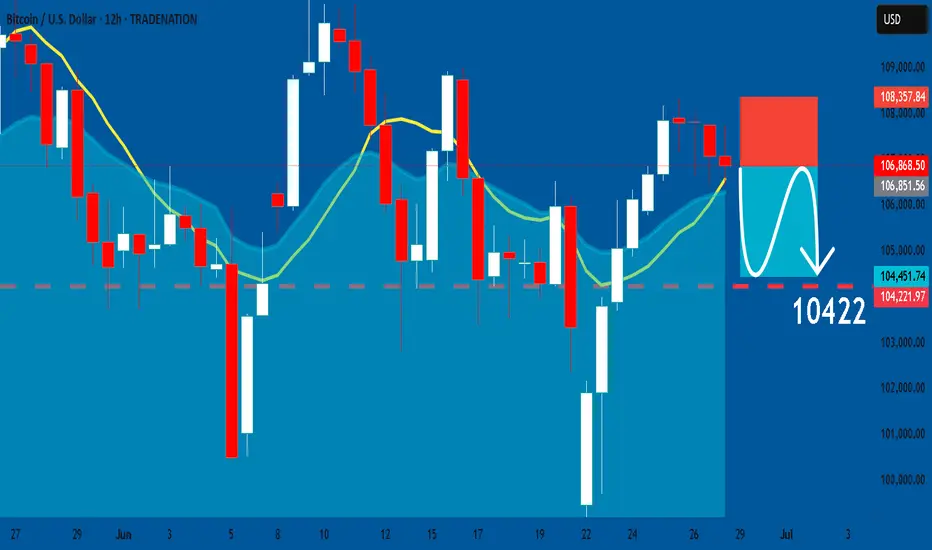
BTCUSD: Bearish Continuation & Short Signal
BTCUSD
- Classic bearish pattern
- Our team expects retracement
SUGGESTED TRADE:
Swing Trade
Sell BTCUSD
Entry - 10686
Stop - 10837
Take - 10422
Our Risk - 1%
Start protection of your profits from lower levels
Disclosure: I am part of Trade Nation's Influencer program and receive a monthly fee for using their TradingView charts in my analysis.
❤️ Please, support our work with like & comment! ❤️
Bitcoin Pressing Up But This Compression Could Crack LowerBitcoin has been steadily climbing for months, respecting that long-term trendline since last year. Each dip into it brought a strong bounce, showing bulls are still in control of the bigger picture.
But right now price is pressing into a tight descending resistance line. We can see it making lower highs while struggling to break above that red trendline. At the same time, it’s sitting just above a key horizontal range, where buyers stepped in before.
This compression is risky . If BTC fails to push above the descending resistance and breaks back below the box, it could drop toward the next demand zone around the low 100K region .
As long as the major trendline from last year holds, the broader uptrend is intact . But losing this structure would open the door for a deeper correction.
This is the kind of spot where patience pays. Let the breakout or breakdown show its hand before jumping in heavy.

BTC Is Replaying a Bullish Fractal >>> Are You Watching?Hello guys!
I see a deja vu here! Let’s look at the historical daily chart (Jan–May 2025):
What happened?
Initial Drop (Yellow Oval): Bitcoin approached a key S&D zone but didn't touch it, triggering a short-lived bounce before dropping again.
Second Drop (Red Ovals): This time, price precisely touched the demand zone, triggering a clean bullish reversal.
What followed was a strong trend breakout, sustained higher lows, and an eventual surge past prior resistance levels.
Current 4H Chart Setup: A Mirror Image?
Yellow Highlight: Once again, we saw a bounce that didn't quite touch the key demand zone ($98K–$100K).
Red Zone Prediction: If this mirrors the historical move, the price is likely to return and touch this S&D area before launching a bullish leg.
Blue Path Projection: A sharp reversal is expected post-touch, aiming toward $111K–$113K as the next key resistance zone.
The descending trendline adds confluence
___________________
History Doesn’t Repeat, But It Often Rhymes
Based on this fractal analysis, Bitcoin is likely forming the same bullish base seen earlier in 2025. The setup hinges on one key event: a return to the $99K–$100K zone, where demand is likely to step in aggressively.
If the pattern repeats, the current market may offer one last high-reward long opportunity before a parabolic rally.

BTCUSD: Bulls Are Winning! Long!
My dear friends,
Today we will analyse BTCUSD together☺️
The price is near a wide key level
and the pair is approaching a significant decision level of 107,630.73 Therefore, a strong bullish reaction here could determine the next move up.We will watch for a confirmation candle, and then target the next key level of 108,207.06.Recommend Stop-loss is beyond the current level.
❤️Sending you lots of Love and Hugs❤️


StochRSI indicator and support and resistance levels
Hello, traders.
If you "follow" me, you can always get the latest information quickly.
Have a nice day today.
-------------------------------------
The StochRSI indicator on the left chart is slightly different from the StochRSI indicator on the right.
The StochRSI indicator on the left chart is the StochRSI indicator provided by default in TradingView, and the StochRSI indicator on the right chart is an indicator with a modified formula.
The StochRSI indicator is a leading indicator that is reflected almost in real time.
Therefore, it reacts sensitively to price changes.
Although it is advantageous because it reacts sensitively, it also increases the possibility of being caught in a fake, so I thought that a slight delay(?) was necessary, and so I created the StochRSI indicator on the left chart.
If you look at the relationship between the K and D of the StochRSI indicators on the two charts, you can see that there is a big difference.
In the end, you can predict the movement by checking whether the movement of the K line has escaped the overbought or oversold section.
However, I think that you will receive information that can determine the sustainability of the trend depending on the positional relationship between K and D.
Therefore, it is important to distinguish the inflection points that occur in the StochRSI indicator.
This is because these inflection points provide important information for drawing trend lines.
Therefore, the StochRSI indicator on the left chart, which better expresses the inflection point, is being used to draw the trend line.
(Unfortunately, this indicator was not registered on TradingView because I did not explain it well.)
-
As a new candle was created, the StochRSI indicator on the left chart is showing an inflection point on the K line.
The StochRSI indicator on the right chart is showing a transition to a state where K < D.
We will have to check whether the inflection point was created only when today's candle closes, but I think that the fact that it is showing this pattern means that there is a high possibility of a change in the future trend.
Since the next volatility period is expected to start around July 2nd (July 1st-3rd), I think it has started to show meaningful movements.
-
It is true that you want to buy at the lowest price possible and sell at the highest price.
However, because of this greed, one mistake can lead to a loss that can overturn nine victories, so you should always be careful.
Therefore, if possible, it is better to check for support and respond.
In that sense, I think it is worth referring to the relationship between K and D of the StochRSI indicator on the left chart.
This is because the actual downtrend is likely to start when K < D.
-
In order to check for support, you definitely need support and resistance points drawn on the 1M, 1W, and 1D charts.
Ignoring this and checking for support at the drawn support and resistance points can result in not being able to apply the chart you drew to actual trading.
Therefore, you should draw support and resistance points first before starting a trade.
Otherwise, if you draw support and resistance points after starting a trade, you are more likely to set support and resistance points that reflect your subjective thoughts, so as I mentioned earlier, you are more likely to lose faith in the chart you drew.
If this phenomenon continues, it will eventually lead to leaving the investment market.
-
It is important to determine whether there is support by checking the correlation between the StochRSI indicator and other indicators at the support and resistance points drawn on the 1M, 1W, and 1D charts.
Even if the inflection point of the StochRSI indicator or other indicators occurs at a point other than the support and resistance points you drew, you should consider it as something that occurred beyond your ability to handle.
In other words, you should observe the price movement but not actually trade.
As I mentioned earlier, if you start to violate this, you will become less and less able to trust the chart you drew.
-
Accordingly, the basic trading strategy I suggest is to buy near the HA-Low indicator and sell near the HA-High indicator.
However, since the HA-Low and HA-High indicators are expressed as average values, they may move in the opposite direction to the basic trading strategy.
In other words, if the HA-Low indicator is resisted and falls, there is a possibility of a stepwise downward trend, and if the HA-High indicator is supported and rises, there is a possibility of a stepwise upward trend.
Therefore, the basic trading strategy mentioned above can be considered a trading strategy in the box section.
In the case of deviating from this box section, it is highly likely to occur before and after the volatility period indicated by the relationship between the trend line using the StochRSI indicator mentioned above and the support and resistance points drawn on the 1M, 1W, and 1D charts.
Therefore, special care is required when conducting new transactions during the volatility period.
This is because there is a high possibility of being caught in a fake when trading during the volatility period.
-
The DOM(60) and DOM(-60) indicators are good indicators to look at together with the HA-Low and HA-High indicators.
The DOM indicator is an indicator that comprehensively evaluates the DMI, OBV, and MOMENTUM indicators.
Therefore, the DOM(60) indicator is likely to be at the end of the high point range, and the DOM(060) indicator is likely to be at the end of the low point range.
In the explanation of the HA-Low and HA-High indicators,
- I said that if the HA-Low indicator receives resistance and falls, there is a possibility that a stepwise downtrend will begin,
- and if the HA-High indicator receives support and rises, there is a possibility that a stepwise uptrend will begin.
In order for an actual stepwise downtrend to begin, the price must fall below DOM(-60), and in order for a stepwise uptrend to begin, it must rise above DOM(60).
In other words, the DOM(-60) ~ HA-Low section and the HA-High ~ DOM(60) section can be seen as support and resistance sections.
-
If these correlations start to appear, I think you will be able to create a trading strategy that fits your investment style without being swayed by price volatility and proceed with trading.
The reason for analyzing charts is to trade.
Therefore, the shorter the time for chart analysis, the better, and you should increase the start of creating a trading strategy.
-
Thank you for reading to the end.
I hope you have a successful trade.
--------------------------------------------------

Whales Dump on Wall Street, Fueling Bitcoin's 'Inevitable' SurgeIn the high-stakes world of cryptocurrency, where fortunes are made and lost in the blink of an eye, a new narrative is taking shape. With Bitcoin's price hypothetically hovering around a robust $107,000, a significant portion of market analysis now suggests that a new all-time high is not just a possibility, but an inevitability. This confidence stems from a complex interplay of technical strength, unprecedented institutional demand, and a massive, yet healthy, transfer of wealth from early adopters to the new titans of finance.
The market is currently witnessing a fascinating dynamic: while the price consolidates above the monumental $100,000 psychological barrier, long-term holders, often referred to as "OG whales," are systematically selling their holdings. This activity, which could be misconstrued as bearish, is being interpreted by many as a necessary and constructive phase. Instead of suppressing the price, this distribution is meeting a voracious appetite from Wall Street, primarily through the mechanism of spot Bitcoin Exchange-Traded Funds (ETFs). This creates a state of equilibrium, a period of sideways consolidation where the market digests enormous gains and builds a foundation for its next explosive move. The target on the horizon is a liquidity cluster around $109,000, a key level that, if decisively flipped to support, could unlock a path to uncharted territory.
This article will delve into the multifaceted dynamics of this hypothetical market scenario. It will explore the significance of consolidating above $100,000, dissect the "great transfer" of Bitcoin from early believers to institutional giants, and analyze the technical and on-chain metrics pointing toward an imminent breakout. Finally, it will consider the potential risks and counterarguments that could challenge the prevailing bullish thesis, providing a comprehensive overview of a market at a pivotal crossroads.
Part 1: The New Paradigm - Consolidating Above $100,000
The act of breaking and holding a price level as significant as $100,000 represents more than just a numerical achievement; it is a profound psychological and structural shift for Bitcoin. In this hypothetical scenario, the market is not just visiting this level but is actively building a base above it, a process known as consolidation. This phase is crucial, characterized by sideways price movement within a defined range, often accompanied by decreasing trading volume, as the market takes a collective breath and establishes a new sense of fair value.
The Psychology of a Six-Figure Asset
For years, $100,000 was a distant, almost mythical target for Bitcoin. Surpassing and, more importantly, sustaining this level transforms market perception. It solidifies Bitcoin's status as a mature, global macro asset, moving it further away from its speculative past. This psychological victory attracts a new wave of capital from more conservative investors, wealth funds, and corporations who may have been hesitant to enter before such a milestone was reached. The consolidation phase above this level acts as a proof of stability, demonstrating that the asset can absorb significant profit-taking without collapsing, thereby building trust and confidence for the next wave of adoption.
Market Structure and Institutional Support
This period of stability is not happening in a vacuum. It is underpinned by a fundamental change in market structure, primarily the advent and overwhelming success of spot Bitcoin ETFs. These regulated financial products have provided a seamless bridge for Wall Street to pour billions of dollars into Bitcoin, creating a formidable wall of buy-side demand. In this scenario, where Bitcoin oscillates between $102,000 and $110,000, spot ETFs would be consistently recording massive net inflows, absorbing the supply being offered by sellers.
This dynamic is a textbook example of healthy consolidation. It is a tug-of-war where the immense selling pressure from profit-takers is effectively matched by the persistent buying pressure from new institutional entrants. This prevents a sharp price decline and allows the market to methodically transfer coins from one cohort to another without inducing panic. Technically, this phase often forms recognizable patterns like sideways ranges, bullish flags, or ascending triangles, all of which suggest that pressure is building for an eventual breakout to the upside. The decreasing volume during this time indicates that the market is reaching an equilibrium before the next major directional move.
Historical Precedent in a New Era
Bitcoin has experienced consolidation phases after breaking previous major milestones, such as $1,000 and $20,000. However, the current hypothetical consolidation above $100,000 is fundamentally different in both scale and participants. Previous cycles were largely driven by retail investors and a smaller group of early adopters. The current cycle is defined by the heavyweight presence of institutional players who bring not only massive capital but also a long-term strategic investment horizon.
The amount of capital required to absorb selling pressure at a six-figure price point is orders of magnitude greater than in any previous cycle. The fact that the market can achieve this stability highlights the depth and maturity it has developed. While past consolidations were precursors to further retail-driven mania, the current phase is about the systematic absorption of early investor supply by the largest financial institutions in the world, setting the stage for a rally built on a much stronger and more diverse foundation. This isn't just a pause; it's the construction of a launchpad for the next chapter in Bitcoin's story.
Part 2: The "Great Transfer" - Long-Term Holders vs. Wall Street
At the heart of the market's current dynamic is a historic transfer of wealth. This is the moment where the earliest and most steadfast believers in Bitcoin, the "OG Whales" or Long-Term Holders (LTHs), are realizing their life-changing gains by selling to the new behemoths of the financial world: Wall Street institutions. This process is not the bearish signal it might imply, but rather a critical market function that fuels the bull run's continuation.
Defining the Players: "OG Whales" and Long-Term Holders
Long-Term Holders (LTHs) are typically defined in on-chain analysis as addresses that have held their Bitcoin for more than 155 days (approximately five months). These are investors who have weathered significant volatility and have a deep conviction in the asset. "OG Whales" are a subset of this group, representing individuals or entities who accumulated vast amounts of Bitcoin in its nascent stages, often at prices of three figures or less. For them, selling at over $100,000 represents astronomical returns on their initial investment.
Their motivation to sell is rational and expected. It is a common market pattern for patient bottom buyers to take profits as the market approaches and surpasses new all-time highs. They understand that the euphoria surrounding these record prices is what attracts the necessary buy-side demand to absorb their large sell orders. This selling, or "distribution," is a hallmark of every Bitcoin bull market peak. The key question is whether the demand is strong enough to absorb this supply without crashing the price.
Deconstructing the "Dumping on Wall Street" Narrative
The essence of this transfer is that since the launch of spot Bitcoin ETFs, LTHs have been the primary source of selling pressure. They are, in effect, providing the liquidity that the newly launched ETFs require to meet the relentless demand from their clients.
This dynamic is precisely why the price has been able to stabilize at such high levels. The institutional buying frenzy is absorbing the supply unloaded by LTHs. This is not a malicious act of suppression but a symbiotic relationship: LTHs need massive buyers to sell to, and Wall Street needs massive sellers to source coins from. This is simply the natural ebb and flow of a market cycle where supply and demand are meeting at a new, higher equilibrium.
On-Chain Evidence of a Healthy Distribution
Several on-chain metrics provide a clear window into this phenomenon, confirming that the current selling is a sign of a healthy bull market, not an impending top.
• Spent Output Profit Ratio (SOPR): This metric shows the degree of realized profit for all coins moved on-chain. In this scenario, the LTH-SOPR would be extremely high, indicating that the coins being sold were acquired at a much lower cost basis and are now being sold for massive profits. While this signals profit-taking, it is typical of a bull market and, on its own, does not signal a top.
• Realized Profit: On-chain data would show a massive spike in realized profits, confirming that sellers are locking in gains. The market's ability to absorb these profits and continue consolidating is a sign of immense strength.
• Coin Days Destroyed (CDD) / Value Days Destroyed (VDD): These metrics measure the activity of older coins. A spike in VDD is synonymous with the LTH cohort spending their coins. This typically peaks shortly after breaking all-time highs because sellers need the liquidity that new buyers bring. The fact that this selling is being met with such strong institutional demand prevents it from turning into a bear market trigger.
• Long-Term Holder Supply: While some LTHs are selling, the overall supply held by this cohort may still be growing or stabilizing. This is because investors who bought six months prior are continuously "aging" into LTH status. This indicates that while the oldest hands are selling, a new generation of convicted holders is forming, providing a solid foundation for the market.
In essence, the "great transfer" is a feature, not a bug, of the current bull market. It is a sign of Bitcoin's maturation, where the asset is moving from the strong hands of early pioneers to the deep pockets of the global financial system. This process allows the market to de-risk, shed its over-leveraged players, and build a stronger base for what many believe is the inevitable next leg up.
Part 3: The Path to $109K and Beyond - Technical and Liquidity Analysis
With the market having established a strong foundation above $100,000, all eyes turn to the next key resistance levels. Technical and on-chain analysis points to a significant cluster of liquidity around the $109,000 mark, which is viewed as the final hurdle before Bitcoin can enter a new phase of price discovery. The argument for the "inevitability" of a new all-time high rests on a confluence of bullish technical patterns, resetting momentum indicators, and the overwhelming force of market liquidity.
Understanding Liquidity at $109,000
In financial markets, liquidity refers to the ease with which an asset can be bought or sold without causing a significant price change. On a price chart, liquidity is concentrated at levels with a high density of buy and sell orders. The area around $109,000 to $111,000 represents a major liquidity cluster. This is composed of:
• Sell Orders (Asks): A large number of investors who bought at lower prices have placed take-profit orders at this psychological and technical level.
• Short Position Liquidations: Traders who are betting against Bitcoin have placed their stop-losses above this resistance. If the price breaks through, these short positions are automatically closed with a buy order, creating a "short squeeze" that adds explosive fuel to the rally.
Analysis of order book data shows significant liquidation levels stacked just above this zone. Successfully breaking through and absorbing this sell-side liquidity would remove a significant barrier, clearing the path for a rapid move higher. A decisive flip of the $109,000 level from resistance to support is what bulls are watching for as the ultimate confirmation of upward momentum.
Bullish Technical Indicators
The consolidation phase has allowed Bitcoin's technical indicators to cool off and prepare for the next advance.
• Chart Patterns: On higher timeframes, the price action is forming classic bullish continuation patterns. There is potential for formations like an inverted head-and-shoulders pattern or a bullish engulfing candlestick, both of which have historically high success rates in predicting upward moves. A bullish engulfing pattern on the daily chart, for instance, has shown a high probability of leading to new local highs when appearing in a broader uptrend.
• Momentum Oscillators: Indicators like the Relative Strength Index (RSI) and the MACD (Moving Average Convergence Divergence) have likely reset from "overbought" conditions during the consolidation. This reset is healthy and necessary, allowing momentum to build again from a neutral base rather than an overheated one. It signals that the market has shed its speculative froth and is ready for a more sustainable trend.
• Moving Averages: Throughout the consolidation period, the price would find strong support at key moving averages, such as the 21-week exponential moving average (EMA) or the 50-day simple moving average (SMA). These levels act as dynamic support, with dip buyers consistently stepping in, reinforcing the strength of the underlying trend.
•
The "Inevitability" Thesis Synthesized
The argument that a new all-time high is "inevitable" is built on the convergence of these powerful forces:
1. Unprecedented Demand: The constant, price-agnostic inflows from spot Bitcoin ETFs provide a demand floor that the market has never experienced before.
2. Supply Absorption: The selling pressure from long-term holders, which would have crushed the market in previous cycles, is being successfully absorbed by this new institutional demand.
3. Healthy Reset: The market has undergone a healthy consolidation, allowing technicals to cool off, leverage to be flushed out, and a strong support base to be built.
4. Psychological Breakthrough: The conquest of the $100,000 level has fundamentally altered market perception and opened the door to price discovery, with the next logical target being the liquidity pool at $109,000.
While no outcome in financial markets is ever truly guaranteed, the confluence of persistent institutional buying, constructive on-chain dynamics, and bullish technical setups creates a powerful case that Bitcoin is coiling for a significant breakout. The move through $109,000 is seen not as a question of "if," but "when."
Part 4: Risks and Counterarguments
Despite the overwhelmingly bullish sentiment in this hypothetical scenario, a prudent analysis requires examining the potential risks and counterarguments that could challenge or delay the ascent to new all-time highs. The cryptocurrency market remains susceptible to a variety of internal and external shocks, and overconfidence can be a precursor to sharp corrections.
Macroeconomic Headwinds
Bitcoin's increasing integration into the global financial system means it is more sensitive to macroeconomic conditions than ever before. A sudden and severe global recession, an unexpected spike in inflation leading to aggressive monetary tightening by central banks, or major geopolitical conflicts could trigger a "risk-off" event across all asset classes, including Bitcoin. Investors might flee to the perceived safety of cash or government bonds, causing even the strong institutional demand for Bitcoin to waver. It is often noted that traders wait for clarity on key macroeconomic data and policy updates before committing to a trend, and any negative surprises could trigger a sell-off.
Overwhelming Profit-Taking
The thesis of a new all-time high hinges on the ability of institutional demand to absorb the selling from long-term holders. However, there is a risk that this supply could become too overwhelming. The profits held by early investors are immense, and there may be a price point—perhaps on the approach to $110,000 or just beyond—where profit-taking accelerates to a pace that even the ETFs cannot sustain. If a large cohort of whales decides to sell in unison, it could create a supply shock that temporarily breaks the market structure and forces a deeper correction.
Market Exhaustion and Valuation Metrics
While consolidation is healthy, a prolonged sideways period can sometimes signal exhaustion rather than accumulation. On-chain metrics that compare Bitcoin's market value to its realized value are crucial for gauging how overheated the market is. These tools help identify periods of extreme overvaluation. If such metrics were to enter their highest zones, it would suggest that the market is reaching peak froth, making it vulnerable to a sharp reversal, regardless of the positive narrative. It is understood that while Bitcoin's price has a strong correlation to global liquidity, internal market dynamics can cause it to decouple, especially during periods of extreme valuation.
Regulatory and Black Swan Risks
The risk of unforeseen "black swan" events always looms over the market. This could include a sudden and harsh regulatory crackdown in a major jurisdiction, the collapse of a major crypto exchange or institution, or the discovery of a critical flaw in the Bitcoin protocol itself. Furthermore, the concentration of Bitcoin within a few large ETF products, while providing demand, also introduces a new vector of risk. If these institutions were to face regulatory pressure or decide to offload their holdings for strategic reasons, the resulting sell pressure could be catastrophic.
In conclusion, while the path to a new all-time high appears clear and well-supported by current dynamics, it is by no means guaranteed. A combination of adverse macroeconomic shifts, overwhelming selling pressure, extreme valuations, or an unexpected black swan event could easily derail the bullish momentum. Investors and analysts must remain vigilant, balancing the optimistic on-chain and technical data with a realistic appreciation of the inherent risks in this volatile asset class.
Conclusion
The hypothetical scenario of Bitcoin consolidating above $100,000 while eyeing a breakout to $109,000 and beyond represents a pivotal moment in the asset's history. It paints a picture of a market that has achieved a new level of maturity, driven by a paradigm shift in its investor base. The central thesis—that a new all-time high is now "inevitable"—is not born from baseless hype, but from a powerful confluence of observable market forces.
The successful establishment of the six-figure price level as a support floor, rather than a speculative peak, is the first pillar of this argument. This consolidation is made possible by the voracious and sustained demand from Wall Street institutions, which are using spot Bitcoin ETFs to absorb the immense selling pressure from early adopters. This dynamic, the "great transfer" of Bitcoin from OG whales to institutional treasuries, is not a sign of a market top but a healthy and necessary distribution that de-risks the market and fuels the next leg of the bull run.
The on-chain analysis provides a framework for understanding this phase not as stagnation, but as a constructive consolidation where the market builds energy for a parabolic advance. This narrative is supported by bullish technical patterns, resetting momentum indicators, and a clear liquidity target at $109,000, which, once breached, could trigger a powerful short squeeze and propel Bitcoin into a new phase of price discovery.
However, this bullish outlook must be tempered with an awareness of the significant risks that remain. Macroeconomic instability, the sheer scale of potential profit-taking, and the ever-present threat of regulatory or black swan events could challenge the prevailing trend.
Ultimately, this analysis reveals a Bitcoin that is at a crossroads, but one where the path forward appears more clearly defined and well-supported than ever before. The interplay between the old guard of crypto and the new titans of finance is forging a stronger, more resilient market. While no outcome is certain, the evidence strongly suggests that Bitcoin is not at the end of its run, but is merely pausing to build a higher launchpad for its journey into the financial mainstream.

BTCUSDT Trade SetupBTC Still in sideways no major move, wait for the entries. While on weekly tf still expecting a final shakeout, 95-93k then a final leg up towards to 120k. For now wait for the entries to be filled first then must use sl.

Analysis and layout of BTC trend in the third quarter📰 News information:
1. Pay attention to the movement of the cryptocurrency market
2. The impact of DAA, etc.
📈 Technical Analysis:
As demand weakens and supply pressure rises, BTC's network valuation exceeds the speed of activity. Exchange inflows and negative DAA divergences indicate that despite price stability, the risk of selling remains. Currently, BTC is experiencing a retracement after a rebound. In the short term, it is still possible to retrace to 106,500 and then rise after stabilizing.
🎯 Trading Points:
SELL 108000-107500
TP 107000-106500
BUY 106500-106000
TP 107500-108000
In addition to investment, life also includes poetry, distant places, and Allen. Facing the market is actually facing yourself, correcting your shortcomings, confronting your mistakes, and strictly disciplining yourself. I hope my analysis can help you🌐.

Bitcoin H1 Reversal – Codex Arcanvm + Tactical Breakdown.⊢
⟁ BTC/USD – BINANCE – (CHART: 1H) – (Date: Jun 30, 2025).
◇ Analysis Price: $107,599.99.
⊢
⨀ I. Temporal Axis – Strategic Interval – (1H):
▦ EMA 9 – ($107,799.64):
∴ The 9-period EMA remains above the current price, signaling downward rejection from short-term momentum line;
∴ It recently crossed below the EMA21, reinforcing a weakening of bullish impulse.
✴ Conclusion: EMA9 now acts as intraday resistance, confirming that immediate market strength has decayed and volatility expansion may continue unless reclaimed.
⊢
▦ EMA 21 – ($107,861.93):
∴ EMA21 is sharply curved downward, validating loss of directional conviction from the previous bullish run;
∴ This level aligns with a former consolidation zone, now potentially serving as a resistance pivot.
✴ Conclusion: EMA21 confirms a short-term trend break, and the inability to reclaim this line would prolong corrective action.
⊢
▦ EMA 50 – ($107,703.87):
∴ The EMA50 was breached decisively in the previous candle cluster, now positioned above price;
∴ Slope is turning neutral-to-down, reflecting a transition from trend to turbulence.
✴ Conclusion: EMA50 shift implies structural vulnerability in the intermediate frame, amplifying bearish tactical weight if no recovery emerges swiftly.
⊢
▦ SMA 100 – ($107,007.08):
∴ SMA100 is currently positioned just below price, offering momentary support in case of further weakness;
∴ Horizontal alignment indicates a pause or inflection zone, lacking directional strength.
✴ Conclusion: SMA100 is a neutral-bullish support shelf, but could flip to active resistance if breached intraday.
⊢
▦ SMA 200 – ($105,890.26):
∴ The SMA200 remains firmly upward-sloping and untouched — a sign of medium-trend resilience.
∴ It defines the lower structural boundary for this time-frame.
✴ Conclusion: SMA200 still holds bullish structural integrity, but if reached, it would represent a full reversion of recent strength.
⊢
▦ Volume + EMA 21 – (Current Vol: 5.31 BTC):
∴ Volume shows an uptick during bearish candle clusters — indicative of active sell-side participation;
∴ The EMA21 on volume reveals a rising slope, confirming that volatility is not passive, but driven by conviction.
✴ Conclusion: Volume action supports the thesis of deliberate distribution, not merely rotational choppiness.
⊢
▦ VWAP (Session) – ($107,995.35):
∴ Price has broken decisively below VWAP, showing institutional disengagement or absence of bid reinforcement;
∴ VWAP now serves as magnetic resistance during any mean-reversion attempts.
✴ Conclusion: VWAP position confirms that price is under fair-value, and current path is dominated by tactical sellers.
⊢
▦ Bollinger Bands – (Lower Band: $107,007.08):
∴ Bands have widened, with price hugging the lower edge - a hallmark of volatility expansion;
∴ Mean price ($107,895.00) sits significantly above spot, reinforcing downside pressure.
✴ Conclusion: BB's suggest momentum breakdown, with price entering statistically stretched, yet uncorrected territory.
⊢
▦ RSI + EMA 9 – (RSI: 87.06 | EMA: 92.92):
∴ RSI has sharply fallen from extreme overbought, but remains above the 70-level — reflecting ongoing exit from euphoric levels;
∴ The EMA over RSI is crossing below, signaling loss of short-term strength and potential trend reversal.
✴ Conclusion: RSI behavior implies a momentum peak has passed, though correction may still be in early phase.
⊢
▦ MACD – (MACD: 1.87 | Signal: -99.46 | Histogram: 101.33):
∴ MACD histogram turned sharply positive following a steep drop, suggesting a potential pause in bearish acceleration;
∴ Lines are converging but remain well below the zero axis - no bullish crossover yet.
✴ Conclusion: MACD reflects oversold relief, but not reversal. Current state favors tactical caution rather than confidence.
⊢
▦ ATR (14, RMA) – (315.31):
∴ ATR remains elevated, confirming ongoing high volatility and larger-than-average candle bodies;
∴ This level sustains a risk zone scenario, where price swings may be unpredictable.
✴ Conclusion: ATR indicates volatility expansion persists, further validating the need for defensive tactical posture.
⊢
🜎 Strategic Insight – Technical Oracle:
∴ The technical constellation on the 1H chart reveals a clear breakdown of short-term bullish structure, now transitioning into a tactically bearish phase;
∴ The rejection from VWAP and convergence of all EMA's above price confirm that any recovery must reclaim the 107.800–108.000 cluster to negate downside bias;
∴ The current support rests on SMA100, yet its flat orientation and proximity to price suggest fragility, not strength. Meanwhile, SMA200 at 105.890 represents a more significant structural floor - its breach would mark a deeper tactical deterioration;
∴ Volatility metrics (BB and ATR) indicate that the market is no longer coiled - it has entered expansion, and directional bias is momentarily controlled by sellers. RSI exiting overbought and MACD’s unresolved negative zone further support the thesis of ongoing correction, not mere pause;
✴ Conclusion: In essence, the market has shifted into a correctional pulse, guided by structural breakdowns and expanding volatility. Tactical recoveries remain possible, but fragile and likely limited unless EMA's are reclaimed with force.
⊢
∫ II. On-Chain Intelligence – (Source: CryptoQuant):
▦ Exchange Netflow Total – (All Exchanges) – (Last Recorded: +2.1K BTC):
∴ Recent spike in netflow reveals a sudden influx of Bitcoin into centralized exchanges, marking the first positive divergence after a long series of outflows;
∴ Such inflows historically precede tactical distribution events or profit-taking phases, especially following extended rallies.
✴ Conclusion: Netflow confirms that holders are actively preparing to sell, giving real on-chain weight to the price rejection seen on the 1H chart.
⊢
▦ Short-Term Holder SOPR – (Latest Value: 1.012):
∴ SOPR sits slightly above 1.0, but descending - indicating a transition from profit realization to potential break-even or loss selling;
∴ If the trend continues and dips below 1.0, it marks capitulation from recent buyers — often a trigger for volatility spikes or local bottoms.
✴ Conclusion: Current STH SOPR signals weakening conviction among short-term holders, supporting a corrective narrative rather than trend continuation.
⊢
🜎 Strategic Insight – On-Chain Oracle:
∴ The on-chain substrate aligns precisely with the tactical weakness shown in the chart. The positive exchange netflow acts as a material indicator of sell-side readiness;
∴ This inflow, breaking the historical trend of outflows, marks a shift in intent - from holding to liquidation;
∴ Simultaneously, the Short-Term Holder SOPR sits on a critical edge. Its descent toward the 1.0 threshold implies that recent buyers are either approaching breakeven or beginning to capitulate;
∴ This fragile posture typically amplifies local corrections, especially when coupled with rising volatility;
∴ On-chain momentum no longer supports bullish continuation. Instead, it reflects hesitation, rotation, and distribution - all hallmarks of a short-term correction phase, in alignment with the temporal analysis;
✴ Conclusion: The on-chain field confirms that the technical breakdown is not speculative - it is supported by active internal dynamics, signaling a pause or reversal in trend strength at a structural level.
⊢
⧈ Codicillus Silentii – Strategic Note:
∴ The current H1 formation is a textbook example of post-euphoric fragility. What appeared as steady accumulation has now transitioned into a volatile de-leveraging phase. The confluence of bearish momentum, increased volume, and netflow reversal suggests the market is entering a tactical contraction zone;
∴ No structural collapse is yet confirmed - but the absence of bullish defense at VWAP and EMA clusters denotes reduced resilience. Until these are reclaimed, all attempts at recovery must be viewed with caution.
✴ Conclusion: Silence in structure signals preparation - not passivity. The next move shall emerge not from noise, but from the void left by exhaustion.
⊢
𓂀 Stoic-Structural Interpretation:
∴ Structurally Bearish – Tactically Suspended ;
∴ The 1H chart shows a break below short-term momentum zones (EMA's, VWAP), confirming structural fragility;
∴ Despite momentary support on SMA100, the loss of upward slope across the EMA's and RSI reversal validate a structural bearish bias;
✴ Conclusion: Tactical direction remains suspended until one of two pivots is breached: either VWAP (~107.995) reclaimed, or SMA200 (~105.890) broken.
⊢
⧉
⚜️ Magister Arcanvm – Vox Primordialis!
𓂀 Wisdom begins in silence. Precision unfolds in strategy.
⧉
⊢

Bitcoin - Will Bitcoin Hit a New ATH?!Bitcoin is trading above the 50- and 200-EMAs on the four-hour time frame and is within its short-term descending channel. Bitcoin can be bought from the demand zone indicated. A break of the channel ceiling would pave the way for Bitcoin to rise to a new ATH.
It should be noted that there is a possibility of heavy fluctuations and shadows due to the movement of whales in the market and compliance with capital management in the cryptocurrency market will be more important. If the downward trend continues, we can buy within the demand range.
In recent days, Bitcoin has been trading in a range of around $107,000, and the market is going through a consolidation phase with complex but deeply fundamental characteristics. What matters at this point is not just the current price, but the precise mix of capital flows, the behavior of major players, on-chain data, and macroeconomic ratios that shape Bitcoin’s short- and medium-term trajectory. Overall, although Bitcoin’s rapid growth after the halving has stopped, internal market signals point to a continuation of the upward trajectory in a more stable framework.
The first important component is the significant influx of institutional capital into the market via ETFs. In the past week, according to CoinShares, more than $1.24 billion in new capital entered crypto products, with Bitcoin accounting for more than $1.1 billion. This marks the 10th consecutive week of capital inflows into the market, bringing the total inflows for 2025 to over $15 billion. Prominent ETFs such as BlackRock’s IBIT and Fidelity’s FBTC are attracting hundreds of Bitcoins per day, indicating steady institutional demand that has weathered the momentary volatility and is more focused on long-term asset building.
Alongside this capital inflow, the Onchain data also paints a mixed but highly interpretable picture. While the average active address rate has declined slightly and the MVRV (market value to realized value) has fallen from 2.29 to 2.20, these changes are more indicative of profit-taking by investors than selling pressure! In fact, rather than fear of a correction or crash, the market is witnessing a “gentle shift of ownership” between short-term and long-term holders. UTXO data also shows a roughly 5% increase in Bitcoin held for over 8 years, a strong sign of long-term accumulation and a decrease in the willingness to sell at current prices!
This can be seen as a period of supply and demand equilibrium; a period in which large investors have entered, but on the other hand, some older players are taking reasonable profits. This has led to a kind of price consolidation, which in June showed itself with only 2% growth—the weakest monthly growth since July last year. However, CoinDesk and Glassnode analysts rightly emphasize that this consolidation is not a sign of market weakness, but rather evidence of the maturity of Bitcoin’s price behavior. The price is reacting to data rather than becoming emotional.
From a macroeconomic perspective, Bitcoin remains highly sensitive to the Federal Reserve’s monetary policy, the value of the dollar, and interest rates. While the market is still waiting for interest rate cuts in the second half of the year, Bitcoin will remain in a quasi-expectant state until then, reacting to macro data, short-term and reactive. However, given that most ETFs follow long-term accumulation models, any stabilization in interest rates or easing geopolitical pressures could trigger a new wave of upside. Common analyst scenarios predict a range of $120,000-$130,000 for Bitcoin by the end of the summer if current conditions are maintained and capital inflows continue. In summary, Bitcoin is now at a stage where the dynamic combination of institutional accumulation, supply and demand balance, and on-chain data has transformed it from a purely risky asset into a strategic investment vehicle. The market has moved beyond the emotional phase and entered a phase of stability and maturity. This is a promising sign for long-term investors, provided that risk management is maintained and sensitivity to macro events is maintained. Bitcoin is preparing for the next stage of its rally—but unlike in the past, this time it is standing on the shoulders of fundamentals that are much stronger than at any time in the asset’s history.
ETFs with the most volume traded on Friday
Total: $501M
BlackRock: $153M
Fidelity: $165M
Grayscale: $0M

30/06/25 Weekly OutlookLast weeks high: $108,531.02
Last weeks low: $99,592.69
Midpoint: $104,061.86
Overall a positive week for BTC in isolation as price moves steadily all week reclaiming the losses made in the week from the 16th-23rd June. This comes after a $2.2B BTC ETF weekly inflow, the 3rd consecutive week of net inflows.
Having now hit the key S/R level of $108,500 it will be interesting to see where BTC goes from here. Jumping up above the level will require a lot from the bulls as ATH is within touching distance and so buying into major resistance is a tough ask. We also have Geo-political uncertainties to add to the situation, one bad tweet is all it takes sometimes to do a lot of damage.
On the other hand the SNP500 hits new ATH in the same conditions and so BTC is more than capable of doing the same.
So far in the first hours of this weeks trading we do have a SFP of the weekly high setup, not ideal for the bulls in any way and so from here the a retest of the range quarters, midpoint being the key area would make sense, invalidation would be a clean break above weekly high with acceptance and strong volume on the move to break the rangebound/choppy environment.
There is also the "window dressing" element to the months &quarter end today. History shows a de-risking going into these events and more money flowing back into risk-on assets in the days following monthly/ quarterly end. For that reason a bullish move (if there were to be one) would come later in the week IMO.
Good luck this week everybody!

BTCUSD📉 The Setup: Bearish Divergence on BTCUSD (1H/15m/30m)
🔍 Observation:
On the 1 Hour chart, Bitcoin
🧠 Meaning: The Buying pressure is weakening, and a breakdown might be near!
Entry SL TP shared in chart