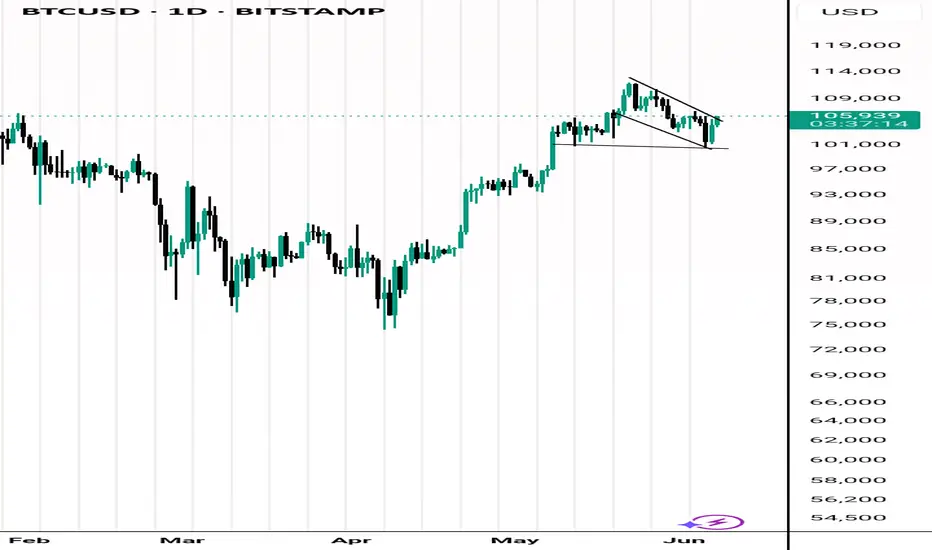
BTC Idea CRYPTOCAP:BTC Daily chart.
What will you be going for?
The bull flag which means another ATH?
Or the mini head and shoulders top if it breaks down we can see 92k CRYPTOCAP:BTC ?
1-BTCUSD
Pay close attention to LMACD in the weekly!Once we cross LMACD in the weekly it would be dangerous to stay in. Make sure to take some profits once we are getting close to October and before LMACD crosses to the downside

Bitcoin Short to 97 K into cpi numbersIn this video I cover the recent drop and what might be a great short on the horizon . With the V shape recovery off the defended 100K level I anticipate that we continue the move up to 107/108K before hitting some resistance and pushing us back into the range leading into the midweek . With cpi news release this could be the catalyst needed to trap the late buyers and drop us into 96K zone .
This video provides context and theory for this short setup so I encourage you to watch .
Tools used Vwap , volume profile , Fibonacci pulls .
Thanks for watching
Any questions please leave in the comments
Safe trading

Last 133 days of the bull market!This idea gives more details about the pint in the cycle we are at right now. When measuring the duration between halving and tops we usually see the best in ~500 days after the halving. Following my previous idea about topping in October you can find the same pattern translating in 546 days after last halving. If this proves right , we are about 133 days before top. At this point we should see fireworks till October. In blue is price action in those 133 in 2017 and in yellow 2021, according to the btc nature of diminishing returns we should see peaks bellow those years.Cheers

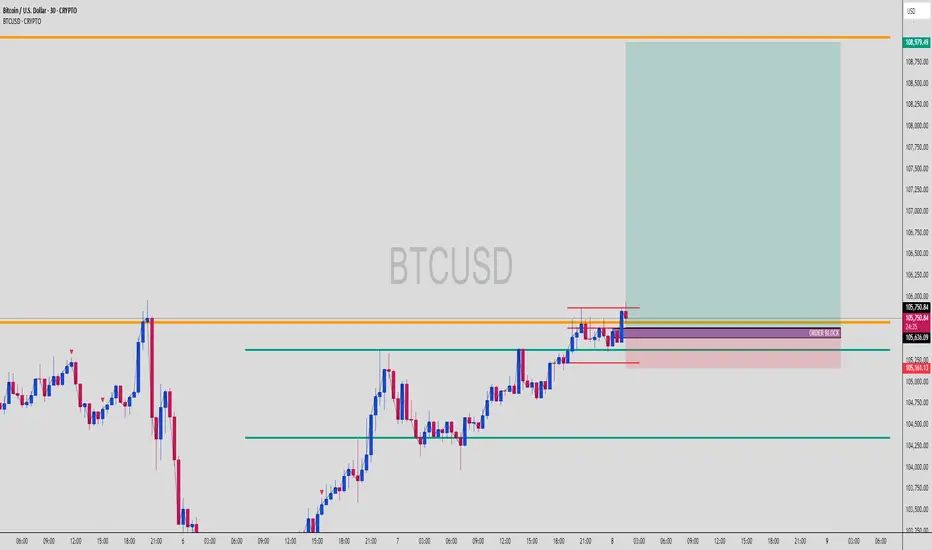
BTC Long Triggered from OB, Smart Money Played This Perfectly!BTCUSD | 30-Min Chart – Long Setup Execution
Bitcoin has just activated a clean long entry from a well-defined bullish Order Block at a key structural level. This move follows textbook Smart Money Concepts (SMC) — the kind of play institutional traders thrive on.
🔍 Setup Breakdown:
🔹 Order Block (OB):
Identified near 105,636 — aligned with previous support
Precise reaction zone after consolidation, showing institutional interest
OB respected after fakeout below short-term liquidity
🔸 Liquidity Sweep:
Quick wick below 105,250 acted as a stop hunt for early shorts
Price reclaimed the OB immediately after → classic Smart Money trap
🟩 Entry Zone (OB Zone):
105,636–105,250 range
Confluence with minor bullish imbalance and structure support
Price barely tapped the zone before launching higher
📈 Upside Target:
TP marked at 108,979 — prior liquidity pocket and untested highs
Large green zone shows ideal RR (approx. 1:6)
First obstacle: minor resistance at 106,750, but momentum looks strong
🟥 SL Placement:
Safely below OB at ~105,161
Below liquidity sweep zone = strong invalidation
🧠 Why This Setup Works:
✔ Price moved impulsively into the OB
✔ OB lines up with previous structure support
✔ Rejection + strong bullish candle = confirmation
✔ No significant resistance until higher liquidity zones (108K+)
This is classic SMC execution: trap, sweep, OB tap, and send. Let retail panic — we follow footprints.
💬 Ninja Wisdom:
"Smart Money doesn’t chase price — it traps and collects."
This was a clean confirmation of a bullish continuation after reclaiming control from liquidity grabs.
📍 Save this chart – this setup could explode into a full bullish swing
💬 Drop your thoughts: Are we headed to 109K or pausing at resistance?
👣 Follow @ChartNinjas88 for more sniper-level BTC/ETH/Gold plays
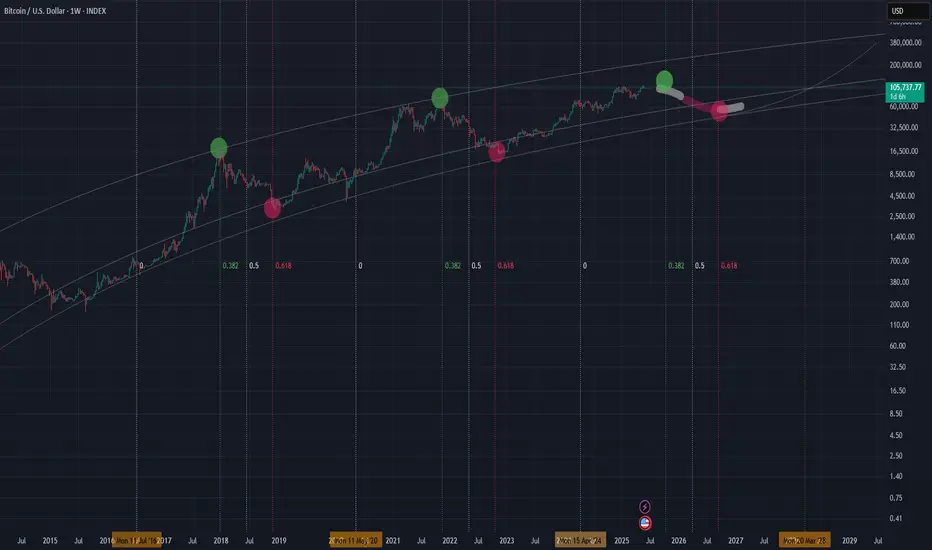
Trend Base Fib Time suggesting getting out before October 2025!I have been warning you that time is running and a few months left before things start cooling off. This tool is trend base fib time , measured from one halving till the next one. I assumed halving in 2028 at some point in march so this result in a target of October to be the month matching with the 0.382 when peaks use to be found. The 0.618 would be the one for catching the bottoms around Sep 2026. Secure some gains and buy back at next bear market lows close to 40k. Cheers
Volatility period has begun.
Hello, traders.
Please "Follow" to get the latest information quickly.
Have a nice day today.
-------------------------------------
We need to see if the price can hold above OBV Low.
We need to see if the price can hold above OBV High or HA-High.
It is showing a downward trend while failing to rise above OBV Low.
If this continues to decline further, we should check if the HA-Low indicator is newly created.
This volatility period is expected to start around June 6 (June 5-7) and continue until around June 13 (June 12-14).
If the auxiliary indicator OBV falls below the Low Line, there is a possibility of another large decline.
At this time, the key is whether it can receive support and rise near 99705.62.
If not, it is expected to select the trend again when it meets the M-Signal indicator on the 1W chart.
The basic trading strategy is to buy at the HA-Low indicator and sell at the HA-High indicator.
If you apply this basic principle, you buy when it rises above 102049.52 and shows support, and sell near 104938.72.
For this basic principle to be applied normally, OBV is rising and the StochRSI indicator is rising.
However, it is better if the StochRSI indicator has not entered the overbought zone if possible.
However, if it is resisted and falls at the HA-Low indicator, it is likely to show a stepwise downtrend, and if it is supported and rises at the HA-High indicator, it is likely to show a stepwise uptrend.
Therefore, when testing support near the HA-Low indicator, if the OBV shows a downward trend and the StochRSI indicator shows a downward trend (if possible, a downward trend in the overbought area), the possibility of a stepwise downtrend increases.
The end of the stepwise uptrend that occurs after meeting the HA-Low or HA-High indicator is a downtrend, and the end of the stepwise downtrend is an uptrend.
Therefore, the trading method should be a fractional trading method.
I think the important thing in spot trading is how much you increase the number of coins (tokens).
Of course, depending on the situation, it may be better to make cash profits.
Since the coin market allows trading in decimal units, it is a useful investment market for increasing the number of coins (tokens).
Therefore, we can increase the number of coins (tokens) corresponding to profits while conducting trading according to the basic trading strategy.
That is, when the price rises by the purchase amount for each purchase price, sell it and leave the number of coins (tokens) corresponding to the profit.
At this time, you should be careful to include the transaction fee in the purchase amount and sell it.
The coins that are good for increasing the number of coins (tokens) corresponding to the profit rather than cash profit are BTC or ETH.
Additionally, BNB is also possible.
I think it is better to obtain cash profit if possible for the rest of the altcoins.
However, if there is a coin (token) that you think you want to increase in the medium to long term, you can increase the number of coins (tokens) corresponding to the profit by increasing the number of coins (tokens).
-
Thank you for reading to the end.
I hope you have a successful transaction.
--------------------------------------------------
- This is an explanation of the big picture.
(3-year bull market, 1-year bear market pattern)
I will explain more details when the bear market starts.
------------------------------------------------------

Bitcoin: will $105K prevail or not?After a spike in price on May 22-23rd, the price of BTC continued with a consolidation, moving the price toward the lower grounds. Fridays stronger than expected US jobs data returned the optimism among market participants, bringing back the price of BTC toward the levels around the $105K, where BTC is ending this week. The lowest weekly level reached was $100.754 on one occasion.
The RSI was pushed at levels below the 50 level, around 45, but is still ending the week at 52. This is an indication that market participants are slowly starting to eye the oversold market side. The MA 50 continues to strongly diverge from MA200, without an indication that the cross might come anytime soon.
Since the peak level was reached as of the end of May, the BTC was traded with lower highs and lower lows for the rest of the period. This is a clear indication that some short consolidation is ahead. In the technical analysis this formation is imposing the question, where this trend ends? One possibility is that BTC will again test the $100K, which was the lowest level reached during the previous week, on a short occasion. This level could also be treated as a psychological level for investors. The second option would be a break of the $105K level, which is currently tested, to the upside, where BTC will seek higher grounds, probably around $108K. Both scenarios currently have equal probabilities. Which one BTC will choose, it will be clearer at the start of the week ahead. Until then, the $105K is the level to watch closely, will it prevail or not?
Biggest Altcoin Season of this Bull Cycle is Coming! As you can see, there is a Massive Ascending Broadening Wedge forming on the #Bitcoin Dominance!
Currently dominance is located almost near the top of the wedge. More likely we will see its ascend up to 67% which will be marked as top before the dump.
The breakdown of this wedge will signal a beginning of a HUGE Altcoin Season (comparable to Autumn of 2021 or Autumn of 2023) when not only small cap, but major altcoins will be sent to new highs. With high probability it will begin in August and will last till December this year.
Mark my words & be prepared for the last opportunity of this bull cycle!

BTC is basically SPX with a higher multiplesince Wall Street got in we actually got significantly more correlated (obviously)
(it wasn't as much prior to 2021)
BTC has basically become SPX with a higher multiple.
Do with that what you will

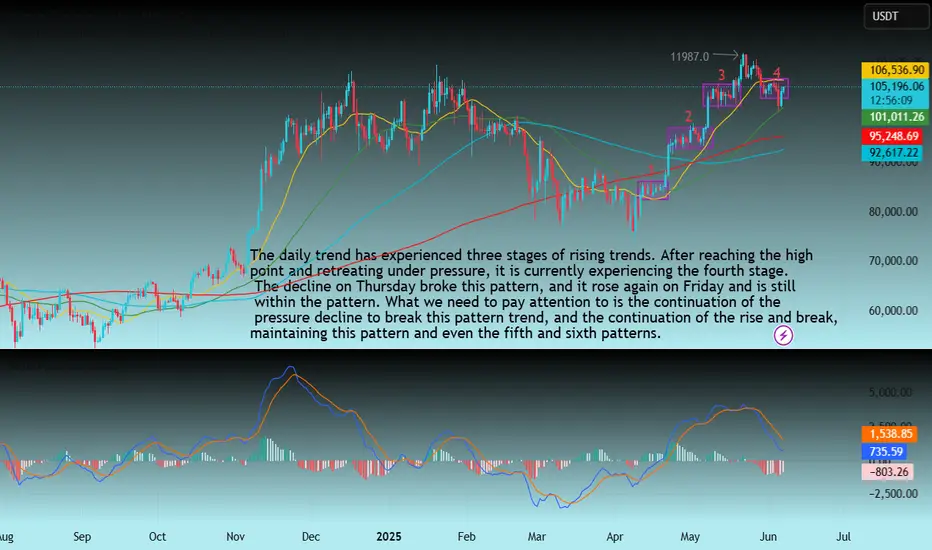
Technical analysis of BTC contracts (outlook for next week)Technical analysis of BTC contract on June 7 (next week outlook):
The weekly trend, after the price hit the high point of 112000 area, it retreated under pressure. The current K-line pattern is negative, but the price is still at a high level, which also exacerbates the overall trend of volatility. The daily price was fluctuating downward before Friday. The impact of yesterday's data caused the price to rise, which seemed to break this trend, and it also became contradictory. The technical indicators of the four-hour chart and the hourly chart changed very quickly, and there was no reference signal for the medium and long term; in general, the current trend will continue the oscillating pattern, with the upper pressure position in the 107000 area and the low point support position in the 100600 area;

BTCUSDTBitcoin may be looking to complete the downward correction from the $101,000 price range to $99,000 and then begin a long-term upward trend. Pay close attention to the extent of the correction and don't give in to fear or greed.
In any case, it should go to $1300,000.
BINANCE:BTCUSDT

Bitcoin at a Crossroads: 110k RejectionAfter the powerful rally that began in the last quarter of 2024, Bitcoin is now at a critical market juncture. The price has once again reached the 106,000–110,000 USD zone, an area that already showed strong signs of distribution back in February and March 2025. This isn’t just a typical resistance level—it’s a psychologically loaded zone, marked by previous highs and repeated selling pressure.
In May, the monthly candle revealed a clear rejection from this zone: a prominent upper wick and a bearish body, signaling the bulls' struggle to sustain new highs. This behavior suggests the beginning of a profit-taking phase or, more likely, a medium-term consolidation.
The picture becomes even more complex when we look at the COT Report dated May 27, 2025. Non-commercial institutional traders—speculative funds, hedge funds, and portfolio managers—have significantly increased their short positions, now exceeding 26,800 contracts. Meanwhile, long positions are hovering around 24,500, resulting in a net bearish exposure. The message is clear: smart money isn’t buying the breakout—it's selling into it.
Seasonality analysis reinforces this narrative. Historically, June tends to be a weak month for Bitcoin, often followed by renewed strength in the next quarter. The 2025 seasonal curve has mirrored the bullish pattern of 2021 up to May, but now—consistent with historical patterns—is showing signs of slowing. This supports the idea that the market might need a breather before potentially rallying again in Q3.
From a technical standpoint, the key levels are well defined. The 95,000–97,000 USD area is the first dynamic support zone, where the price might find short-term relief. However, the more significant support lies between 82,000 and 85,000 USD—this is the origin of the current rally and aligns with the old breakout structure. A return to this level would represent a healthy and natural correction within a still structurally bullish long-term context.
In summary, the current outlook calls for caution. Momentum is fading, seasonality is unfavorable, and institutional players are trimming long exposure while adding to shorts. Until the price can consolidate above 110,500 USD, the dominant scenario remains a corrective pullback, with interim targets at 95k and potential drops toward the 85k zone.
However, if the market surprises with a strong weekly close above the highs, it could pave the way for a new leg up toward the 125,000–135,000 USD range—potentially fueled by macro catalysts such as ETF inflows, Fed narratives, or broader adoption.

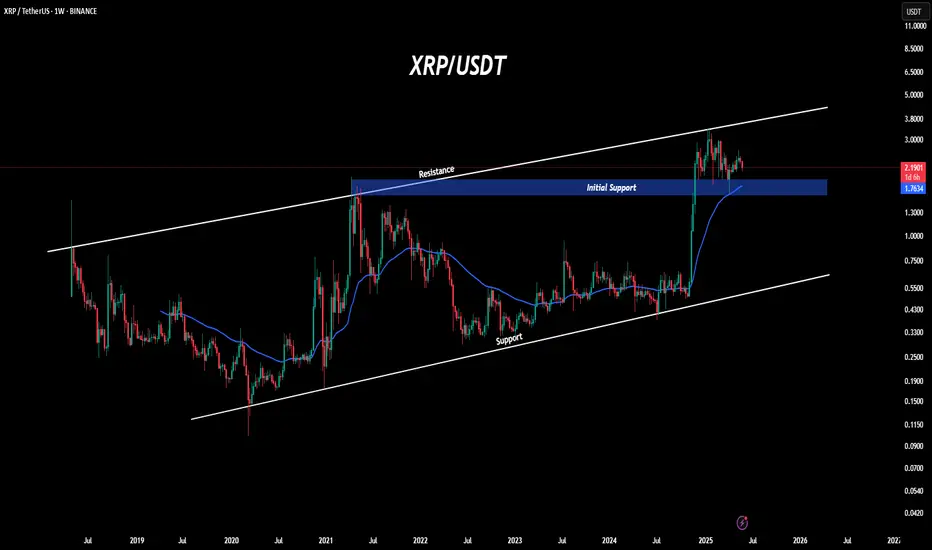
XRP UpdateXRP Weekly Timeframe Update
XRP is currently showing a rejection from the resistance trendline and is now hovering near a crucial support zone, ranging between $1.57 and $1.90. This level is significant as it marks the previous higher high. Additionally, the 50 EMA is providing extra support, from which XRP has already shown signs of a rebound.
Bullish Scenario:
If XRP continues to rebound from this zone, we could potentially see a new all-time high, with the price forming a double top pattern.
Bearish Scenario:
If XRP breaks down and closes below this key support, prepare for downside pressure.
That’s it from my end. Trade safely, and always do your own research and analysis before investing.
Regards,
Dexter
The Unraveling of an Empire: How Bitcoin Could Break the DollarFor decades, the U.S. dollar has reigned supreme, an undisputed king in the global financial arena. It is the world's primary reserve currency, the bedrock of international trade, and the safe-haven asset investors flock to in times of turmoil. This dominance has afforded the United States what has been called an "exorbitant privilege," allowing it to borrow cheaply and exert significant influence over the world economy. But the ground beneath this financial empire is beginning to shift. A confluence of mounting debt, shifting geopolitical sands, and the rise of a revolutionary technology is creating the conditions for a challenger to emerge. That challenger is Bitcoin.
Born from the ashes of the 2008 financial crisis, Bitcoin represents a radical departure from the centrally controlled monetary systems that have governed economies for centuries. It is a decentralized, digital currency, free from the whims of governments and central banks. While initially dismissed as a niche interest for tech enthusiasts and a tool for illicit activities, Bitcoin has steadily gained traction, evolving into a trillion-dollar asset class that is now capturing the attention of institutional investors, corporations, and even nation-states. The question is no longer whether Bitcoin is a fleeting fad, but whether it possesses the power to fundamentally disrupt, and perhaps even break, the long-standing hegemony of the U.S. dollar.
A Hedge Against a Failing System
One of the most compelling arguments for Bitcoin's ascendancy lies in its inherent properties as a store of value, particularly in an era of unprecedented monetary expansion and soaring national debt. Unlike the U.S. dollar, which can be printed at will by the Federal Reserve, Bitcoin has a finite supply capped at 21 million coins. This predictable scarcity is a powerful antidote to the inflationary pressures that erode the purchasing power of fiat currencies. As governments around the world, and particularly the United States, continue to accumulate staggering levels of debt, the temptation to devalue their currencies through inflation grows. The U.S. national debt, now standing at tens of trillions of dollars, raises serious questions about the long-term sustainability of the dollar's value. In this environment, Bitcoin's unalterable monetary policy makes it an increasingly attractive safe haven for those seeking to preserve their wealth.
The trend of "de-dollarization" is already underway, with several countries actively seeking to reduce their reliance on the U.S. dollar in international trade and reserves. Geopolitical rivals like China and Russia have been at the forefront of this movement, but even traditional allies are beginning to explore alternatives. The weaponization of the dollar through sanctions has further accelerated this trend, prompting nations to seek financial systems that are not subject to the political whims of a single country. Bitcoin, being a politically neutral and borderless currency, offers a compelling solution. It allows for direct, peer-to-peer transactions across the globe without the need for intermediaries, thereby circumventing the traditional, dollar-dominated financial system.
The Rise of a New Reserve Asset
The ultimate test of a global currency is its acceptance as a reserve asset by central banks. While this may have seemed like a far-fetched idea just a few years ago, it is now a topic of serious discussion in financial circles. A handful of nations have already taken the pioneering step of adding Bitcoin to their reserves, signaling a potential paradigm shift in how countries manage their sovereign wealth. For central banks, the appeal of Bitcoin lies in its potential for diversification. By holding an asset that is not correlated with traditional stocks and bonds, they can better hedge against various economic and geopolitical risks. As more central banks begin to explore this option, even a small allocation to Bitcoin could have a significant impact on its price and legitimacy.
The development of a robust financial ecosystem around Bitcoin is also paving the way for its broader adoption. The emergence of regulated exchanges, custody solutions, and investment products has made it easier for institutions to gain exposure to the asset class. This growing infrastructure is crucial for building the trust and liquidity necessary for Bitcoin to function on a global scale.
The Hurdles on the Path to Dominance
Despite its disruptive potential, Bitcoin faces a number of significant challenges that could hinder its ability to supplant the dollar. The most frequently cited concern is its price volatility. Wild swings in value make it a difficult medium of exchange for everyday transactions and a risky asset for conservative central banks to hold in large quantities. While volatility may decrease as the market matures, it remains a major obstacle to widespread adoption.
Scalability is another critical issue. The Bitcoin network can currently only process a limited number of transactions per second, making it unsuitable for the high volume of payments required of a global currency. While second-layer solutions are being developed to address this, they have yet to be proven at a massive scale.
Furthermore, the regulatory landscape for cryptocurrencies is still in its infancy. Governments around the world are grappling with how to approach this new technology, and the lack of clear and consistent regulations creates uncertainty for investors and businesses. The U.S. government, in particular, is unlikely to cede its monetary authority without a fight, and could impose stringent regulations that stifle Bitcoin's growth.
Finally, no currency in history has achieved global dominance without the backing of a major economic and military power. The U.S. dollar's reign is underpinned by the strength of the American economy and its military might. Bitcoin, by its very nature, is decentralized and lacks the support of any single nation-state. This could be both a strength and a weakness. While it provides neutrality, it also means that there is no central authority to backstop the currency in times of crisis.
A New Financial Order
The notion that Bitcoin could completely break the U.S. dollar and become the sole global reserve currency in the near future remains a speculative one. The dollar's incumbency advantages are formidable, and the challenges facing Bitcoin are substantial. However, to dismiss the potential for a seismic shift in the global financial order would be to ignore the powerful forces at play.
What is more likely than a complete replacement is a gradual transition to a more multipolar currency world, where Bitcoin coexists alongside the dollar, the euro, and other major currencies. In this scenario, Bitcoin could serve as a neutral reserve asset, a check on the inflationary tendencies of fiat currencies, and a parallel financial system for those who are excluded from or wish to opt out of the traditional one.
The rise of Bitcoin is a clear signal that the world is yearning for a more resilient, equitable, and decentralized financial system. Whether it ultimately breaks the dollar or simply forces it to become more disciplined, one thing is certain: the future of money will look very different from its past. The quiet revolution that began with a single whitepaper is now a global movement, and the foundations of the old financial empire are beginning to tremble.

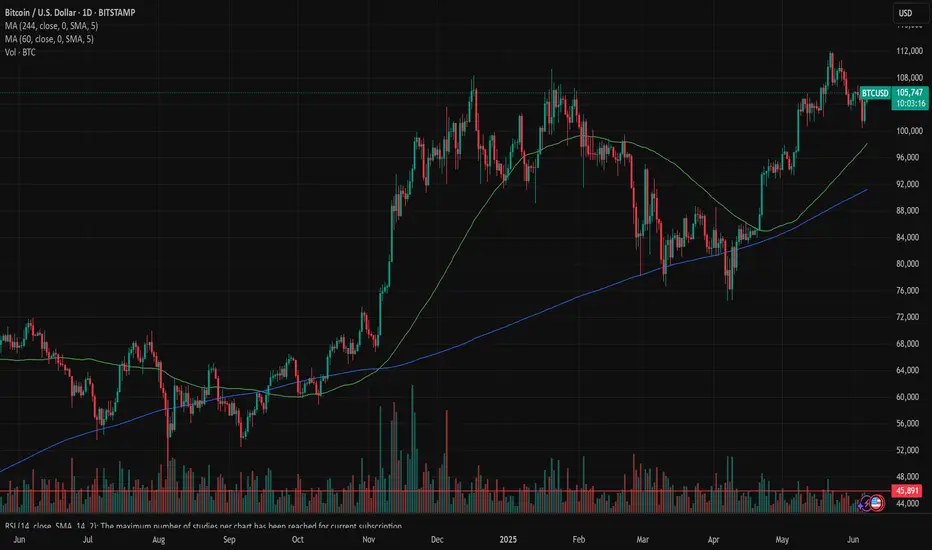
RSI suggesting a bear market comingThis is BTC and it's RSI. Bellow you can see LMACD applied on the RSI indicator to see the trend more clearly. We might be on the stage that we can see higher prices like in 2021, but the bear trend is already printed. Sell some now and buy back at 40k next year. Cheers

Detailed analysis of the BTC/USD 4H chart🔍1. Chart Context
Interval: 4 hours (H4)
Current price: Around 104,950 – 105,400 USD
Range of recent candles: Strong rebound after a decline to around 101,000 USD.
Lower indicator: Stochastic RSI
📊2. Price Action Analysis
Market structure
Main trend (recent days): Downtrend – from the peaks of ~114,000 USD a clear sequence of lower highs and lower lows.
Recent hours: Dynamic decline, followed by a quick, strong rebound from around 101,000 USD to ~105,000 USD.
Key technical levels
✅Resistance:
~105,500–106,000 USD – local peak of the last rebound wave and earlier lows from the end of May.
~108,000 USD – next key level, with a bigger upward movement.
Support:
~102,000–101,000 USD – bottom of the last movement, quick demand reaction, so-called “stop run” or false breakout.
~99,000 USD – psychological zone and important level in case of further declines.
📊3. Indicators
Stochastic RSI (bottom of the chart)
Currently: Stochastic RSI strongly overbought (above 80 points), both lines (blue and orange) are at the top and slightly curling.
Conclusion: Possible short-term correction/slowdown in growth. Overbought Stochastic RSI often precedes pullbacks, especially when testing important resistances.
🧠4. Possible scenarios
Bulls – Upside scenario:
If BTC breaks above $105,500 with momentum, a move to $106,000–108,000 is possible (another resistance and short squeeze).
The key will be the closing of the 4h candle above $105,500.
Bears – Downside scenario:
If the price does not break $105,500, profit taking and a pullback to $103,000–102,000 are possible.
Strong defense of the $101,000–102,000 level by the bulls – if it is broken again, it threatens to deepen the declines even to $99,000.
📊5. Additional Notes
Reduced Volatility: After such a strong bounce, there is often a period of “calmness” and consolidation.
Potential Traps: False breakouts for 4h and sudden changes in direction (characteristic of the crypto market).
📌6. Warning Signals
Stochastic RSI overbought – suggests to be cautious with long positions “on the top” without additional confirmation.
Lack of continuation after a strong bounce – if the price does not “reach” higher in the next candles, the risk of a correction increases.
🧠Summary:
Currently: BTC/USD in a short-term bounce phase after a strong decline. The price is approaching a significant resistance (~105,500 USD). Stochastic RSI shows overbought – possible correction or sideways movement.
Direction for the next few hours: Reactions at USD 105,500 (resistance) and ~USD 102,000 (support) will be key.

BTCUSD Price ActionHello Traders,
The market is closing soon, but for those following BTC — here's a setup I’ve spotted. Our previous setup successfully hit the take-profit target.
Now, we can clearly see that price initially respected the trendline, followed by a breakout. It has now returned for a retest, again respecting the trendline. This presents a valid short opportunity, provided you apply proper risk management.
Also, take a moment to reflect on any trading mistakes you made this week — not with regret, but as a learning experience. That’s how progress happens.
Wishing you all the best — happy weekend and good trades ahead!

BTCUSD: Just hit the 1D MA50 and is rebounding.Bitcoin turned neutral on its 1D technical outlook (RSI = 51.000, MACD = 923.400, ADX = 25.014) as it hit its 1D MA50 for the first time since April 19th. That is a straight up buy signal, especially since the the current Channel Up with its 1D RSI HL structure, resembles September - December 2024. TP = 165,000.
## If you like our free content follow our profile to get more daily ideas. ##
## Comments and likes are greatly appreciated. ##

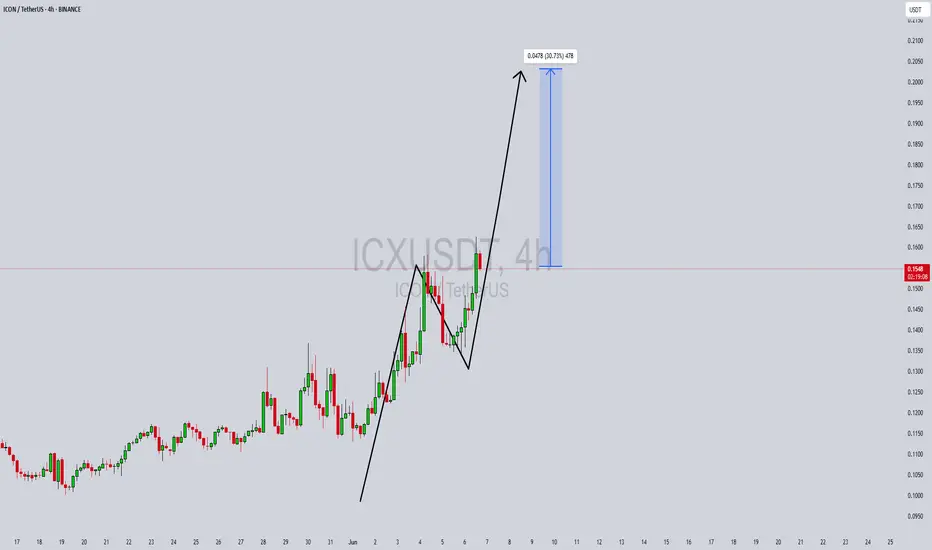
ICXUSDT Forming Bullish impulseICXUSDT has recently shown a strong bullish impulse, followed by a healthy pullback forming a classic bull flag or V-shaped recovery pattern. This setup often signals continuation of the uptrend, especially when supported by solid trading volume, as seen in the recent sessions. The consolidation and subsequent breakout reflect growing investor confidence, making ICX an attractive short-term trading opportunity with an expected gain of 20% to 30%+.
ICON (ICX) is one of the older blockchain projects that has managed to maintain its relevance through consistent updates and ecosystem expansion. As the altcoin market shows signs of revival, mid-cap coins like ICX are starting to attract attention from both retail and institutional traders. The recent price action confirms that ICX is gaining traction, with the breakout targeting a significant resistance zone in the $0.19-$0.21 range.
Traders looking for momentum plays should watch ICXUSDT closely. If the price sustains above the $0.1550 breakout level with increasing volume, it could mark the beginning of a new leg upward. Additionally, the current structure on the 4H chart is providing clean technical entries with tight risk, making this trade setup highly favorable for swing and day traders.
This move is backed by both technical pattern recognition and on-chain interest metrics, which hint at potential accumulation. With sentiment improving and key resistance levels within reach, ICX could deliver a rapid upside move in the coming days.
✅ Show your support by hitting the like button and
✅ Leaving a comment below! (What is You opinion about this Coin)
Your feedback and engagement keep me inspired to share more insightful market analysis with you!
Crypto bull market might be ending pretty soonI am warning you that we might seeing the last days of the bull market. SO FAR histogram is printing the first red candle(we need to verify once June ends). Look what happened with btc once LMACD crossed above 0. Winter is coming.

Bitcoin Prediction - WARNING - Short Set-up Looming? We are spectating something serious on Bitcoin looming right now! Confirmations explained in the video!
