HolderStat┆BTCUSD pennant pauseCRYPTOCAP:BTC cools under 106 k inside a narrowing pennant pinned to its long-term rising rail. Successive ascending consolidation triangles hint at continuation, projecting a thrust toward the 111 k resistance shelf. Holding the pattern’s base keeps breakout odds tilted north.
1-BTCUSD

btc on selling#BTCUSD price have recorrect above 105600 showing bullish range, now we need price to fall to cover the projection.
Sell Below 105545, take profit 103555, Stop loss 106360.
Possible closure on current H1 above 106360 will break the next zone 106900-107200.

SPY/QQQ Plan Your Trade For 6-5 : Inside BreakawayToday's SPY Cycle Pattern is an Inside Breakaway pattern - which indicates the markets want to try to break away from the sideways range I've been sharing with you.
Gold and Silver are making a very big move higher this morning - which may be indicative of some crisis or military conflict move throughout the world.
I see this move in Metals as a bit of a warning to the global markets. Metals hedge global risk levels. A rise in metals suggests traders fear some crisis event and are banking on Silver/Gold as an efficient hedge.
BTCUSD is still trading within the sideways channel as well. I see BTCUSD less as a hedge and more as a technology/Block-chain asset. No matter how you slice it, BTCUSD is not really an alternate currency, it is a Technology asset.
We could see some big moves over the next 2-5+ days because of how the markets are setting up and how Gold/Silver are reacting.
Buckle Up.
Get Some.
#trading #research #investing #tradingalgos #tradingsignals #cycles #fibonacci #elliotwave #modelingsystems #stocks #bitcoin #btcusd #cryptos #spy #gold #nq #investing #trading #spytrading #spymarket #tradingmarket #stockmarket #silver

BITCOIN under brutal 4H squeeze. Buyers or sellers will prevail?Bitcoin (BTCUSD) is currently under the strongest squeeze we've seen this year as it's being compressed between the 4H MA50 (blue trend-line) and 4H MA200 (orange trend-line). Such tight price action usual precedes explosive moves.
Technically two patterns prevail: a long-term Channel Up and a short-term Head and Shoulders (H&S). Naturally, as long as the Channel Up holds (and is still valid), the pattern will attempt to push the price to he 2.0 Fibonacci extension at $121500 (and higher). If on the other hand it breaks (4H MA200 would be an early signal), the H&S may push the price to the -1.0 Fibonacci extension at $95000.
So what do you think? Which pattern will prevail? Feel free to let us know in the comments section below!
-------------------------------------------------------------------------------
** Please LIKE 👍, FOLLOW ✅, SHARE 🙌 and COMMENT ✍ if you enjoy this idea! Also share your ideas and charts in the comments section below! This is best way to keep it relevant, support us, keep the content here free and allow the idea to reach as many people as possible. **
-------------------------------------------------------------------------------
💸💸💸💸💸💸
👇 👇 👇 👇 👇 👇

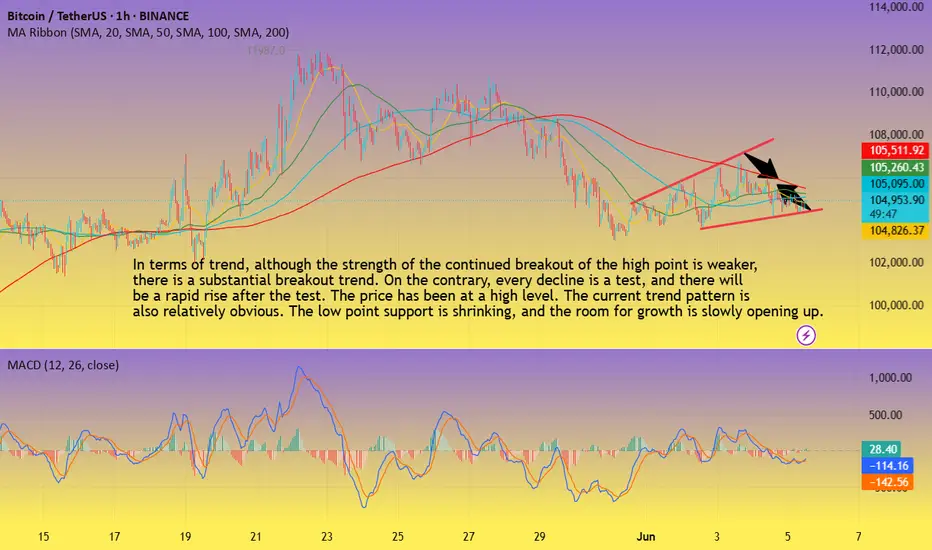
BTC-----Buy around 104800, target 106000 areaTechnical analysis of BTC contract on June 5:
Today, the large-cycle daily line level closed with a small positive line yesterday. The K-line pattern has continuous positive and negative lines, but if we look carefully, we will find that the price has been at a high level, and every retracement trend is testing support, and the rise is breaking the high, although it has not continued, so in this case, it is still very easy to pull up and break; the short-cycle hourly chart price is oscillating in a small range, and the upward channel is slowly opening in the trend pattern, and the support for the decline is moving up. This is relatively clear. The current K-line pattern is continuous positive, and the attached indicator is golden fork, so there is a high probability of rising during the day. Whether the European session can break the high is to focus on.
BTC short-term contract trading strategy:
The current price is more in the 1048000 area, the stop loss is in the 1043000 area, and the target is in the 106000 area;
$BTC 2025: The road to $444,000As predicted by @JoshMandell6 on X earlier this year, this chart is an entirely theoretical exercise (a pure hopium mind-burp if you will) to explore the remote possibility that a CRYPTOCAP:BTC price of $444K might even be achievable in any scenario. I simply drew a line from the Pi Cycle top in 2017/18, to the top in March 2021 and projected on to now (June 2025). I then marked off the $444K prediction made earlier this year by @JoshMandell6 (the yellow horizontal, dashed line). I then checked prior BTC cycles to see there are any examples where BTC was able to climb this distance within 2 monthly candles. Interestingly, if you take the last 2 monthly candles from the 2017/18 cycle (before and including the topping candle), it does line up pretty well. This suggests it is theoretically possible for BTC to reach $444k by August 1st 2025 - I know this is highly unlikely of course; but interesting all the same.
For additional context to this theory: the specific post I'm referring to was made by Josh Mandell (@JoshMandell6) on X (formerly Twitter) on November 5, 2024. In this post, Mandell presented a poetic prediction stating that Bitcoin would reach $84,000 on March 14, 2025, and subsequently surge to approximately $444,000. The prediction included symbolic phrases like “three four, times a thousand,” suggesting a target price of $444,000.
Mandell's forecast gained significant attention when Bitcoin indeed closed near $84,000 on March 14, 2025, aligning with his prediction. This accuracy bolstered his reputation, especially considering his background as a former trader at Salomon Brothers and Caxton Associates. He has also been transparent about his trading activities, publicly sharing his portfolio, which reportedly grew from $2.1 million to over $22 million by March 2025.
en.bitcoinsistemi.com
For a more in-depth understanding of Mandell's prediction and its implications, you might find this video insightful: youtu.be

DeGRAM | BTCUSD retesting the $105k📊 Technical Analysis
● Triple bounce at 104.8 k-105 k and the violet trend-line created fresh higher-lows while keeping price above the May demand block.
● A two-week falling trend-line has just been cleared and retested, unlocking the next pivot at 108 k; flag depth from 105 k projects to the 111.7 k supply/upper channel rail.
💡 Fundamental Analysis
● FXStreet highlights US job openings at a 3-yr low, pressuring yields, while CoinShares tracks another $450 m spot-ETF inflow and exchange balances at a 4-yr trough, signalling a tightening float.
✨ Summary
Buy 104.8-106 k; clearance of 107 k aims for 111 k, stretch 115 k. Long thesis void on a 2 h close < 103 k.
-------------------
Share your opinion in the comments and support the idea with a like. Thanks for your support!

STRAXUSDT Forming Falling Wedge STRAXUSDT is displaying a textbook falling wedge pattern on the daily chart, a formation widely recognized for its bullish reversal potential. After an explosive move upward earlier this quarter, the price has been consolidating in a downward-sloping wedge, tightening near a crucial support level. This type of market structure typically precedes a breakout, and the chart currently projects a potential move of 90% to 100% or more to the upside. This setup is attracting growing interest from traders and investors who understand the significance of wedge breakouts in crypto price action.
What adds conviction to this technical setup is the presence of solid volume activity. Despite the correction phase, there has been no major sell-off panic, which often suggests accumulation by smart money. As the pattern tightens and price volatility compresses, a breakout becomes increasingly likely. Once this breakout is confirmed with volume, STRAXUSDT could rally sharply, targeting the projected zone around $0.067 and beyond.
STRAX is not just any low-cap altcoin—it is backed by a strong legacy in blockchain infrastructure. As more developers and blockchain-based platforms seek scalability and integration, the utility of projects like STRAX may resurface with renewed momentum. With this kind of structural bullish setup and an improving sentiment across altcoins, STRAXUSDT presents a compelling case for a breakout trader or a short-term investor.
Traders watching STRAXUSDT should keep a close eye on breakout confirmation candles and volume spikes in the coming days. Risk-reward is highly favorable at this point in the wedge, making it a timely opportunity in the altcoin segment. The technicals align well with broader market optimism, setting the stage for a possible trend reversal and extended move higher.
✅ Show your support by hitting the like button and
✅ Leaving a comment below! (What is You opinion about this Coin)
Your feedback and engagement keep me inspired to share more insightful market analysis with you!

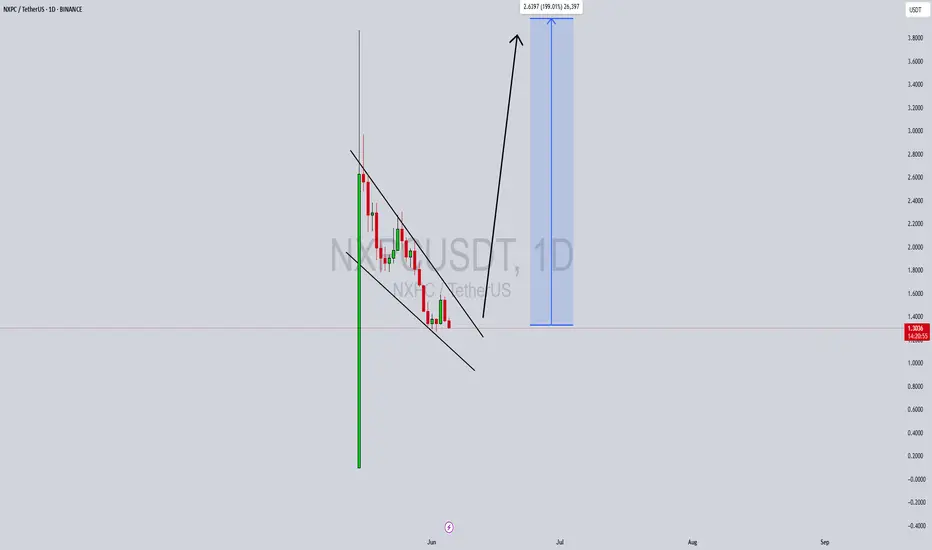
NXPCUSDT Forming Falling Wedge NXPCUSDT is currently exhibiting a classic falling wedge pattern on the daily timeframe—a pattern known for its bullish breakout potential. After a massive upward surge that brought strong attention to the pair, the price began a structured pullback within converging trendlines. This healthy correction, coupled with consistent buying interest, indicates a potential setup for another explosive move. The technical breakout projection signals a possible 190% to 200% upside from the current levels, making it one of the most promising altcoin setups in the short term.
The volume profile supports the bullish scenario, with a gradual reduction in sell pressure suggesting that sellers are exhausting. This kind of price action following a parabolic move is often seen as a base-building phase before another leg higher. The convergence near a key support zone only strengthens the likelihood of a breakout, attracting smart money and swing traders looking for early entries into high-reward positions.
NXPC has recently gained visibility due to its innovative approach and unique use cases in decentralized applications. As investor sentiment grows around low-cap, high-potential tokens, NXPC is becoming a serious contender among emerging altcoins. Coupled with its Binance listing, the project is attracting not only retail attention but also speculative volume from more experienced traders who recognize wedge breakouts as lucrative opportunities.
This chart setup, combined with rising fundamentals, makes NXPCUSDT one to watch very closely. If the wedge breaks out with strong volume confirmation, a rapid move toward the projected target range could unfold quickly. Timing the breakout with proper risk management can lead to exceptional gains in this type of market environment.
✅ Show your support by hitting the like button and
✅ Leaving a comment below! (What is You opinion about this Coin)
Your feedback and engagement keep me inspired to share more insightful market analysis with you!
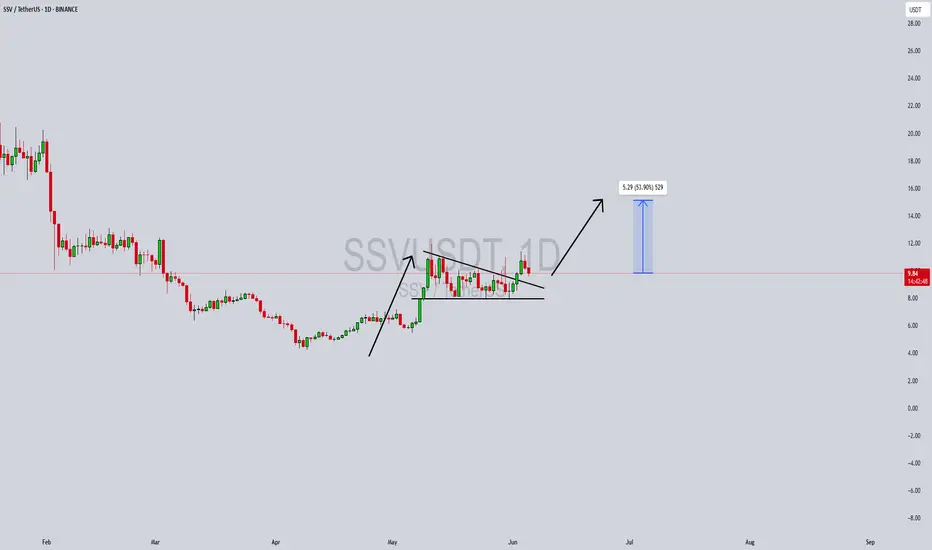
SSVUSDT Forming a Bullish PennantSSVUSDT is currently forming a bullish pennant pattern, which is typically a continuation formation that appears after a strong upward impulse. The pair recently experienced a significant breakout to the upside, followed by a consolidation phase forming a symmetrical triangle or pennant structure. With good volume maintaining support and bulls defending key levels, this setup is signaling that a strong breakout could be imminent.
SSV Network (SSV) plays a vital role in the Ethereum ecosystem by enabling decentralized staking infrastructure. As Ethereum’s staking market continues to grow, projects like SSV are drawing significant interest from investors due to their utility and real-world staking applications. With more ETH validators looking for secure and decentralized staking solutions, SSV is well-positioned for organic growth in the coming months.
The technicals support the bullish bias, with the chart projecting a potential 40% to 50% gain once price breaks out from the current consolidation zone. The bullish momentum building over the last few weeks, combined with strong investor sentiment and healthy volume, adds confidence to this projection. The breakout target aligns with prior resistance zones, making this a high-conviction setup for swing traders.
This pattern, in conjunction with the underlying fundamental strength of the SSV protocol, presents a compelling opportunity for traders watching altcoins with real utility. A successful breakout could attract more retail and institutional attention, especially as staking continues to trend in the broader crypto narrative.
✅ Show your support by hitting the like button and
✅ Leaving a comment below! (What is You opinion about this Coin)
Your feedback and engagement keep me inspired to share more insightful market analysis with you!
Bitcoin’s Bearish Signal: Key Levels to WatchFenzoFx—Bitcoin consolidates near $104,225 after breaking below the bullish trendline, signaling a possible break of structure. This level acts as immediate support, and a bearish wave could form if BTC closes below it, targeting the $101,880 demand zone.
The bearish outlook remains valid unless Bitcoin surpasses $108,215. If broken, price could rise toward $111,800.

BTCUSD Rejection Brewing? OB + 79% Fib Tap Could Trigger Short!Bitcoin (BTCUSD) | 30-Min Sell Setup – Order Block + Deep Fib Confluence
This is a classic Smart Money short setup. Price swept lows, rebounded into premium pricing, and is now approaching a high-probability rejection zone — just the way institutional traders like it. 🧠💰
🔍 Breakdown:
Market Structure:
Recent move formed a lower low ➝ market structure is bearish
Current retracement is corrective, moving toward premium sell-side levels
Key Confluences:
🔴 Order Block (purple zone): ~105,200–105,300
🔴 Fib Confluence:
61.8% = 105,178
70.5% = 105,298
79% = 105,388
🔴 Price is tapping OB + 70.5–79% fib zone = sniper territory for shorts
Liquidity Perspective:
Earlier liquidity grab below 104,500 triggered this move
Now climbing back into premium pricing — potential trap before drop
Above the OB: resting liquidity + stop hunts expected
Execution Strategy:
✅ Entry confirmation: Look for M5–M15 bearish engulfing / BOS in OB zone
🎯 Entry area: 105,280–105,388 (limit or confirmation-based)
🛡 SL above 105,400 (above OB & 79%)
💰 TP zone: 104,500 (liquidity pool + fib 0%)
⚠️ Risk-to-Reward Ratio: 1:3+ potential — ideal for scalpers and intraday traders alike
🧠 Chart Ninja Notes:
You’re not chasing highs — you’re stalking where Smart Money sells to the crowd. This is premium pricing in a bearish leg, and BTC is approaching the kill zone. Patience = profit. 😤💸
📈 Game Plan Summary:
🔹 Entry Zone 105,280 – 105,388 (OB + 70.5–79% fib)
🔻 SL Zone Above 105,400
📉 Target 104,488 zone (fib 0%, equal lows)
🎯 RRR Potential 1:3+
💬 Pro Tip:
Wait for price to enter OB and stall before pulling the trigger.
The best trades happen after liquidity is swept — not before.
You’re not a retail trader. You’re a sniper. 🥷💥
📥 Save this setup & review it post-trade
🔁 Share your entry plan in the comments
⚡️ Follow @ChartNinjas88 for daily Smart Money BTC plays

$BTC UpdateCRYPTOCAP:BTC #BTC $104,987 support in effect, previous weekly closed with bearish engulfing, 4h closed with bullish engulfing - current 4H trying to follow thru. $107,461 support needed to push for $110,423 resistance, and then the new ATH. $103,093 current support, $99,361 key support from here. Watch given S/R

BTC M2 CorrelationMaybe Raoul is right and it was M2 all along.
Monetary policy driving all markets, see correlation and time-lag (offset) on chart.

BTC Log Trend accumulation/expansionnoticed this Accumulation/Expansion/Contraction idea when trending along the Log Pitchfork lines.
and the high correlation to SPX (and M2) for direction.

An example of a new way to interpret the OBV indicator
Hello, traders.
If you "follow", you can always get new information quickly.
Have a nice day today.
-------------------------------------
I think the reason why there are difficulties in using auxiliary indicators and why they say not to use indicators is because they do not properly reflect the price flow.
Therefore, I think many people use indicators added to the price part because they reflect the price flow.
However, I think auxiliary indicators are not used that much.
Among them, indicators related to trading volume are ambiguous to use and interpret.
To compensate for this, the OBV indicator has been modified and added.
-
The ambiguous part in interpreting the OBV indicator is that the price flow is not reflected.
Therefore, even if it performs its role well as an auxiliary indicator, it can be difficult to interpret.
To compensate for this, the High Line and Low Line of the OBV auxiliary indicator have been made to be displayed in the price section.
That is, High Line = OBV High, Low Line = OBV Low
-
Then, let's interpret the OBV at the current price position.
The OBV of the auxiliary indicator is currently located near the OBV EMA.
That is, the current OBV is located within the Low Line ~ High Line section.
However, if you look at the OBV High and OBV Low indicators displayed in the price section, you can see that it has fallen below the OBV Low indicator.
In other words, you can see that the price has fallen below the Low Line of the OBV indicator.
You can see that the OBV position of the auxiliary indicator and the OBV position displayed in the price section are different.
Therefore, in order to normally interpret the OBV of the auxiliary indicator, the price must have risen above the OBV Low indicator in the price section.
If not, you should consider that the interpretation of the OBV of the auxiliary indicator may be incorrect information.
In other words, if it fails to rise above the OBV Low indicator, you should interpret it as a high possibility of eventually falling and think about a countermeasure for that.
Since time frame charts below the 1D chart show too fast volatility, it is recommended to use it on a 1D chart or larger if possible.
-
It is not good to analyze a chart with just one indicator.
Therefore, you should comprehensively evaluate by adding different indicators or indicators that you understand.
The indicators that I use are mainly StochRSI indicator, OBV indicator, and MACD indicator.
I use these indicators to create and use M-Signal indicator, StochRSI(20, 50, 80) indicator, and OBV(High, Low) indicator.
DOM(60, -60) indicator is an indicator that comprehensively evaluates DMI, OBV, and Momentum indicators to display high and low points.
And, there are HA-Low, HA-High indicators, which are my basic trading strategy indicators that I created for trading on Heikin-Ashi charts.
Among these indicators, the most important indicators are HA-Low, HA-High indicators.
The remaining indicators are auxiliary indicators that are necessary when creating trading strategies or detailed response strategies from HA-Low, HA-High indicators.
-
Thank you for reading to the end.
I hope you have a successful trade.
--------------------------------------------------

Japanese Yen to Da Moon!I compared the yen to every single currency pair and USDJPY is the most volatile. BOJ will raise interest rates to 0.75%-1% by late 2025/early 2026. And IF the FED chooses to lower rates that will further exacerbate Yen strength.
103.156 TP, but TBH I see price breaking well past that point and yen will make new all time highs. The dollar will get desecrated across all currencies, the yen will destroy it the hardest. Most likely BTC will also peak around this same time period and youll see and end to the bull cycle and we will enter BTC bear cycle but that is beside the point.
Potential Black Swan Event: the US enters into a recessionary environment, while I dont think this is likely bc everyone is saying that, it will be possible if we see a further escalation in the Ukraine conflict or if the US chooses to enter war with Iran. War is the only situation I see potential US recession.
I predicted then yen would get dusted during COVID, now I predict yen will make never seen before gains for the next 5 years minimum. Let's see how this plays out.

BTCUSD: Consolidation is about to be over.Bitcoin remains neutral on its 1D technical outlook (RSI = 52.429, MACD = 1547.600, ADX = 23.123) as so far it is failing to stage a proper breakout from the consolidation of the last few days. Based on the long term comparison with the previous Channel Up at the time of the 1D Golden Cross, the consolidation could be over soon, resembling November 4th 2024. As long as the 1D MA50 holds, stay bullish, TP = 165,000.
## If you like our free content follow our profile to get more daily ideas. ##
## Comments and likes are greatly appreciated. ##

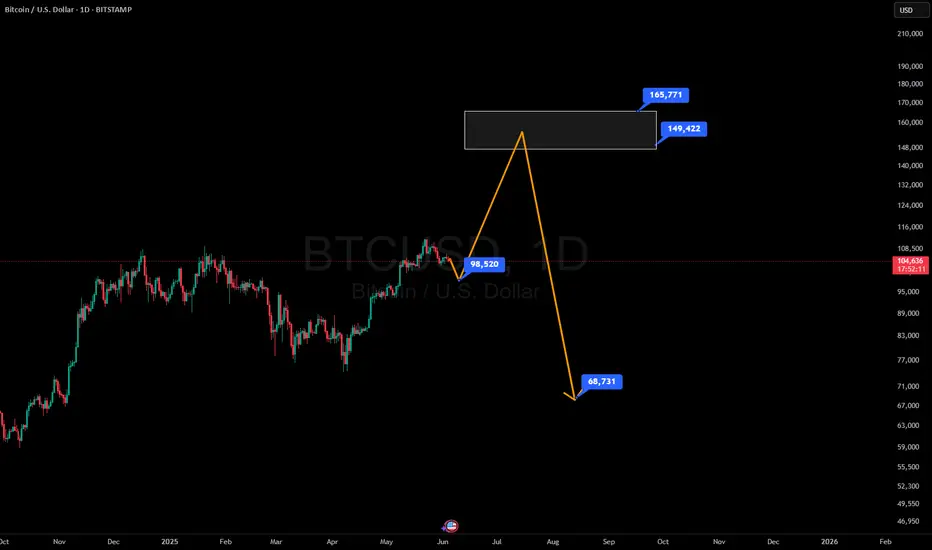
BTC: Maintaining Strength Bitcoin continues to hover around the $105,000 level. In line with the primary scenario, we expect the advance in green wave B to extend toward the upper blue Target Zone between $117,553 and $130,891. This zone can be used to lock in partial gains or establish hedges via short positions. From there, a corrective wave C is likely to follow, driving prices lower into the blue Target Zone between $62,395 and $51,323 — marking the end of the larger wave a. A corrective bounce should unfold next, ahead of the final selloff completing blue wave (ii). The alternative scenario, with a 30% probability, envisions a breakout above $130,891 and the establishment of a new high as part of blue wave alt.(i).
📈 Over 190 precise analyses, clear entry points, and defined Target Zones - that's what we do.

BTC/USD 1H Short-Term🔍1. General Context and Short-Term Trend
Short-Term Trend: The last dozen or so candles have shown strong fluctuations — a typical sideways market (consolidation) after a clear upward impulse and a quick drop. The price is currently trading in the range of around $104,900–$106,500.
Recent Strong Move: Clear upward impulse from around $104,900 to around $106,900, followed by a quick correction.
📌2. Supports and Resistances (H1)
Supports:
$105,000–$105,200 — Bottom of local wicks and several demand tests.
$104,900 — Lowest point of the last few hours, clear buyer reaction.
Resistances:
$106,200–$106,400 — Upper area of several candles, strong price rejection.
106,900–107,000 USD – The peak of the last impulse, a place of clear supply.
✅3. Candlestick formations and price action
Pin bar / long wick: Candles with long lower wicks are visible around 105,000 USD, which suggests that buyers are defending support.
Double top? (Double top): Peaks around 106,900 USD (03.06 and 04.06) – a classic signal of a potential change in direction to the lower.
Possible consolidation: The last few hours have been a series of alternating candles, signaling the lack of a clear advantage of bulls or bears.
🧠4. Technical indicators (MACD and RSI)
MACD (lower panel)
The MACD line crossed the signal line from the bottom to the top, then a quick correction and currently the MACD is close to zero – no clear trend, momentum has slowed down.
MACD Histogram: Declining, close to zero, suggesting potential lack of strong trend and possibility of further consolidation.
RSI (middle panel)
RSI value ~44–48 – not overbought or oversold, neutral market state.
No divergence – RSI generally follows price, no strong divergences are visible.
RSI bounced off 30 (tested oversold zone and returned to neutral range).
🧠5. What could be important?
Volatility Squeeze: Low volatility after a sharp move often heralds another impulse.
Potential Fakeout: If support at $104,900 is broken falsely (e.g. quick wick and return), a move up could occur.
No clear trend on the hourly chart, rather sideways market in the short term.
📊Summary and scenarios
Scenario 1 (bullish):
If the $105,000-$104,900 level holds, we can expect a test of $106,200-$106,400 and perhaps another attempt to approach $107,000.
Scenario 2 (bearish):
If the $104,900 support is broken (with a candle closed below this level), the next target is around $104,500 and below.
What to watch out for?
Timing of macro data releases - may increase volatility.
Sudden breakouts from consolidation - no trend = higher risk of sudden, false moves.

This Trendline Refuses To Be OverlookedTrading Fam,
While it is somewhat unclear what Bitcoin's next move will be (though I tend to lean towards more upside bias), one thing has become clear ...that aqua blue trendline I have drawn on our chart is proving its significance. Currently, it holds as support. A break to the downside though, and I expect us to drop all the way to 96k. If it continues to hold, a break above our recent high should be expected and new highs will be formed in a relatively quick timeframe.
Stew

BTCUSD Wave Count: Bitcoin Unfolding Wave ((5)) ?Hello Friends,
Welcome to RK_Chaarts,
Let's analyze the Bitcoin chart today using Elliott Wave theory. As we can see, Bitcoin recently made a high around $112,000 on 23rd May 2025. We've marked this as the completion of Primary Degree Black Wave ((3)). After that, it dropped to complete Wave ((4)) on 31st May 2025. Now, it's moving up, possibly unfolding Wave ((5)). According to Elliott Wave principles, Wave 2 cannot retrace more than 100% of Wave 1. So, our nearest invalidation level is the 31st May's low at $103000. If the price sustains above this level, we can expect it to move towards $115,000 as a Projected Target of wave ((5)). However, if it breaks below the invalidation level, we'll need to re-analyze the wave counts. We've also drawn some trend lines, marked in black dotted lines, which act as support and resistance. This is a 1-hour time frame chart. The red line marking the nearest invalidation level is crucial. If it breaks, we'll need to adjust our wave counts. If it holds, we can expect the price to move up towards $115,000. Let's see how the market unfolds. Please note that this is an educational analysis and not a trading tip or advice.
Analysis Summary
- Analyzing Bitcoin chart using Elliott Wave theory to understand market trends and potential price movements.
- Recent high around $112,000 on 23rd May 2025, & Recent Low around $103,000 on 31st May 2025 indicates a significant turning point in the market.
Wave Count
- Completed Primary Degree Black Wave ((3)) suggests a major uptrend has concluded.
- Completed Wave ((4)) on 31st May 2025 indicates a correction phase has ended.
- Possibly unfolding Wave ((5)) implies a new uptrend may be emerging.
Key Levels
- Nearest invalidation level: 31st May's low at $103,000 serves as a crucial support level.
- Projected Target: $115,000 represents a potential upside target based on Elliott Wave principles.
Elliott Wave Principles
- Wave 2 cannot retrace more than 100% of Wave 1: a key rule governing wave relationships.
- Wave ((5)) projection based on Fibonacci ratios and wave extensions.
Chart Details
- 1-hour time frame chart provides a detailed view of recent price action.
- Trend lines marked in black dotted lines highlight key support and resistance levels.
- Red line marking nearest invalidation level is crucial for validating the wave count.
Important Notes
- Breaking below the invalidation level would require re-evaluation of the wave count.
- Sustaining above the invalidation level increases confidence in the projected target.
I am not Sebi registered analyst.
My studies are for educational purpose only.
Please Consult your financial advisor before trading or investing.
I am not responsible for any kinds of your profits and your losses.
Most investors treat trading as a hobby because they have a full-time job doing something else.
However, If you treat trading like a business, it will pay you like a business.
If you treat like a hobby, hobbies don't pay, they cost you...!
Hope this post is helpful to community
Thanks
RK💕
Disclaimer and Risk Warning.
The analysis and discussion provided on in.tradingview.com is intended for educational purposes only and should not be relied upon for trading decisions. RK_Chaarts is not an investment adviser and the information provided here should not be taken as professional investment advice. Before buying or selling any investments, securities, or precious metals, it is recommended that you conduct your own due diligence. RK_Chaarts does not share in your profits and will not take responsibility for any losses you may incur. So Please Consult your financial advisor before trading or investing.
