Bitcoin Looks Set for a Dip Before Its Next Big MoveRight now, Bitcoin is showing signs of cooling off after a solid run-up over the past few weeks. Looking at the chart, it seems like BTC is struggling to break through that descending trendline—it’s been rejected there more than once, and now it's likely heading lower in the short term.
Here’s what seems most likely: price pulls back toward the $99,000 support zone (highlighted in purple on the chart). That area has acted as a solid floor before, so it wouldn’t be surprising to see buyers step in again.
After that? If support holds and we see some momentum return, BTC could start climbing again. the chart suggests a potential breakout to the upside, maybe even pushing toward a new all-time high (ATH) above $114,000.
In simple terms: expect a short-term dip, but keep an eye out for a strong bounce—this could just be a healthy pullback before the next big leg up.
for summary:
Short-term dip likely, targeting ~$99K
Strong support there—watch for a bounce
If it holds, BTC might push toward new highs
1-BTCUSD

Bitcoin's Battle: $107K Resistance or $100K Support?Bitcoin is currently trading at $106,522, showing a consolidation pattern after a recent rally. The price has been moving between $103,000 and $107,000, with $107,000 acting as a strong resistance level. This ceiling has been tested several times but hasn’t been convincingly broken yet. On the flip side, $100,000 has proven to be a solid support, with buyers stepping in whenever the price dips near this key psychological level. If BTC breaks above $107,000, it could target $110,000 or higher; however, a drop below $100,000 might see it test $97,000 or lower.
From a technical standpoint, the 4H chart shows a short-term bullish trend line around $105,800, which has been holding the price up during small pullbacks. That said, there are signs of weakening momentum, the 30-day Rate of Change (ROC) is flashing a bearish divergence, hinting that the upward push might be losing steam. On the daily chart, the MACD has turned negative, which could signal a broader trend shift. For now, traders should keep an eye on whether BTC can push past $107,000 or if it falls below $100,000, as these breaks will likely dictate the next big move.
Looking at the bigger picture, Bitcoin’s price is being shaped by several external factors. Recent news, like the SEC dropping its lawsuit against Binance and a new crypto market structure bill in Congress, could bring more regulatory clarity and lift investor confidence. Economic uncertainty and tariff relief are also driving some to see BTC as a hedge, much like gold. Stablecoin market caps have hit all-time highs, suggesting more liquidity in the crypto space. But there’s a flip side: China’s heavy gold buying and the US-China tariff war could throw a wrench into BTC’s trajectory.
Analyst sentiment is split. Som e see a bearish flag pattern pointing to a potential drop to $97,000, while others are betting on a bullish surge to new highs, maybe $120,000 or even as far as $325,000. This consolidation phase could be the calm before a major breakout, either up or down. Keep an eye on volume and those key levels ($107,000 and $100,000) for hints about what’s next. As always, stay sharp, manage your risk, and keep up with the latest market updates!

BTCUSDT Trade Analysis📊 BTCUSDT Trade Analysis
Previous Move (Sell)
✅ Sell executed successfully – target reached (🎯).
📈 New Trade Setup (Buy)
💡 Current Plan:
Switching to buy now as the market has reached the previous sell target.
New Target:
Next major resistance area near 111,025 – 111,072 USDT range (🟩 target box at the top).
📍 Key Levels:
Entry Zone: Above 105,000 USDT mini-resistance area (🟧 mini-resistance box).
Support: Around 102,999 USDT (blue support line).
Current Target (Buy):
Target zone: 111,025 – 111,072 USDT.
📌 Trade Plan Summary
Entry: Above 105,000 mini-resistance area break.
Target Point: 111,025 – 111,072 USDT 🟩.
Stop Loss: Suggested below 102,999 USDT to limit downside (🔴 red zone).
🎯 Conclusion:
🔵 Target for the buy move is well-defined and positioned above current resistance levels.
🟢 Awaiting price action above mini-resistance area for a safe entry for the next bullish leg!

HolderStat┆BTCUSD stairway to athCRYPTOCAP:BTC marched out of strong consolidation, sliced a falling wedge, then keeps stacking bull-flag consolidations on an ascending trendline. Uptrend channel, breakout energy and 100 k support line up for an assault on the 112 k ATH level — bullish momentum in full swing.

BTC: Still in the Grip of Wave BBitcoin is holding steady near the same levels seen at the time of yesterday’s update — and so is the structure. According to our primary scenario, we expect the current corrective wave B to complete soon within the blue Target Zone between $117,553 and $130,891. Once that happens, a wave C selloff should follow, likely targeting the lower blue Target Zone between $62,395 and $51,323. That said, our alternative scenario (30% probability) remains intact. In that case, the high of blue wave (i) has yet to form — a breakout above $130,891 would confirm that view and open the door to further upside before a correction resumes.
📈 Over 190 precise analyses, clear entry points, and defined Target Zones - that's what we do.

BTCUSD Bear Trap Loading – Premium OB Sell Setup ActivatedBTCUSD | 1H Smart Money Rejection Play – Premium Repricing Before Breakdown
The king of crypto is looking shaky. Smart money isn’t buying the pump. Here’s why BTCUSD might be gearing up for a steep dump from a premium order block reaction 🩸👇
📌 1. Market Context:
After a clean bearish leg, BTCUSD is now retracing into a premium zone — above the 70.5% Fib
Price is climbing into a high-probability reversal OB (highlighted in purple/red)
This area aligns with the 70.5%–79% golden retracement zone — where institutions love to load shorts 🧠📉
💎 2. Key Levels to Watch:
🔺 Premium OB Zone (Sell Zone): 108,378.95 – 109,276.15
🟣 Golden Rejection Zone: Fib 70.5% – 79%
🔽 Target Weak Low: 103,121.59
⛔ Invalidation/SL Above: 109,276.15
🎯 RR Potential: 1:4+ sniper-grade
Price is expected to tap this premium zone, sweep liquidity, and collapse into the weak low for a full market cycle completion 🔁
🧠 3. Smart Money Flow:
This move smells like a liquidity grab trap – taking out late longs before a drop
No bullish BOS from HTF – market structure still bearish
OB overlaps with inefficiency (FVG), making it ripe for rejection
Strong high is intact — unbroken = more confluence for downside
🎯 4. Execution Strategy (Entry Tips):
⚔ Wait for:
M5–M15 shift in structure (BOS) from bullish to bearish inside the OB
Sharp rejection wick or engulfing candle for confirmation
Ideal entry = wick entry near 109.2 with tight SL just above OB
Target = weak low for full mitigation and profit harvesting
This is surgical precision territory. The sniper must be patient before pulling the trigger 🥷
🔥 5. Why This Short is GOLD:
✅ OB + Fib + FVG confluence = high-odds reversal zone
✅ Price is in premium – not discount = perfect for shorts
✅ Weak low = magnet
✅ No bullish confirmation = no reason to long
This is not a guess — this is the blueprint for institutional execution 📐
📉 Drop “BTC Dump Mode 🚨” in the comments if you’re watching this setup too
🔁 Save this setup for your playbook
⚔ Follow @ChartNinjas88 for more institutional-level trade ideas like this one

SPY/QQQ Plan Your Trade For 6-3 : BreakAway In Trend ModeToday's pattern suggests the SPY/QQQ will attempt to move into a Breakaway type of pattern. I believe that Breakaway may be to the downside, but I could be wrong.
Price has been struggling in a sideways consolidated range over the past 2+ weeks. I believe this range sets up an "Island" type of price formation that is indicative of a topping type of pattern.
Currently, I'm tracking layers of different TA techniques to try to see how price may react in the future. Right now, price appears to be trapped within a range, has recently broken below the STDDEV channel, and may be moving into a very volatile FAILURE/REJECTION phase.
This is where price may attempt to resume trending (up or down) and I believe the move logical move is to the downside at this point.
Gold/Silver had a HUGE MOVE yesterday and are not contracting a bit. I still believe Metals will rally higher and attempt to break to new ATH levels.
BTCUSD is trapped in a sideways price range after reaching new ATH levels recently. Many of you are aware I'm expecting a rollover-top pattern to setup in BTCUSD (and the US markets) and I believe it is just a matter of time to see how the markets react to policies, news, and economic function/data.
Should be an interesting (possibly sideways) day today.
Get some.
#trading #research #investing #tradingalgos #tradingsignals #cycles #fibonacci #elliotwave #modelingsystems #stocks #bitcoin #btcusd #cryptos #spy #gold #nq #investing #trading #spytrading #spymarket #tradingmarket #stockmarket #silver

BITCOIN Is this even a possibility?Bitcoin (BTCUSD) is currently on a short-term pull-back, following the impressive rally to new All Time Highs (ATH) from the April 07 bottom. This first 'serious' short-term relief correction has stopped on the former Lower Highs trend-line, which previous acted as a Resistance and is now holding the price from further downfall, acting potentially as Support.
This is the exact same price action that BTC had during its break-out from the previous Lower Highs trend-line last October. The symmetry between the two fractals is remarkable as not only did they both form their 1D Death Cross patterns on their bottoms and their 1D Golden Cross patterns on the Lower Highs break-out but also their Phase 1 rallies (1st Bullish Leg) have been exactly the same: +49.58%.
As a result, as long as the Pivot holds, there is a good chance we see a strong rebound, which if it holds the same total symmetry of the previous fractal, it should peak at +120%, which gives a $164000 Target.
Do you think that's even a possibility? Feel free to let us know in the comments section below!
-------------------------------------------------------------------------------
** Please LIKE 👍, FOLLOW ✅, SHARE 🙌 and COMMENT ✍ if you enjoy this idea! Also share your ideas and charts in the comments section below! This is best way to keep it relevant, support us, keep the content here free and allow the idea to reach as many people as possible. **
-------------------------------------------------------------------------------
💸💸💸💸💸💸
👇 👇 👇 👇 👇 👇

BITCOIN LONG TRADE IDEAI'm looking forward to buying BTC in this price level if I see a good bullish price action which confirm my trade idea.
Market structure on 4HR is currently bullish.
Looking at the monthly and weekly time frame, BTC is extremely bullish and it's clear that BTC is not done with it's bullish run.
I expect to see BTC give another good run to the 120k-150k price level

BTCUSDT – Bear Flag Breakdown Imminent?Price is forming a textbook bear flag following the sharp drop from ~108.8K.
The structure shows rising lows in a tight channel, typically a pause before further downside.
📉 Bear Flag Anatomy:
Breakdown support: ~104,000
Measured move target: 98,810
RSI: 49.94 — hovering just below neutral, watch for dip <40 for breakdown confirmation.
Volume: Still low — waiting for a spike to confirm supply pressure.
🧨 Trigger Conditions:
4H close below flag support
RSI < 40
Volume spike above 20-bar average (~1.96M)
🎯 Short Plan:
Entry: Rejection from the fib golden pocket or flag support breakdown
TP: 98,800 (pattern target, confluence with prior support)
🔍 If confirmed, this breakdown could mark the start of a Phase E markdown in Wyckoff terms.
💬 Let me know your thoughts below — are you shorting this flag or expecting a fakeout?
#BTC #Bitcoin #CryptoTrading #BearFlag #ShortSetup #Wyckoff #PriceAction #4HChart

DeGRAM | BTCUSD fixed above the $104,000 level📊 Technical Analysis
● Bulls twice defended the 103-105 k demand and purple trend-line, turning the zone into a springboard; price also reclaimed the inner grey trend-median, preserving higher-lows in the 7-week rising channel.
● A fresh ascending triangle is coiling under 111 k; pattern height projects to the red 112-115 k supply/channel roof once 111 k gives way, while invalidation rises with the trend-line at 103 k.
💡 Fundamental Analysis
● CoinShares reports a third straight week of spot-ETF inflows (+US$1 bn) and the BTC exchange reserve just printed a new 3-year low, signalling supply squeeze. Meanwhile, ISM manufacturing slipped back below 50, cooling U.S. yields and the DXY and reviving crypto appetite.
✨ Summary
Long 104-106 k; triangle break >111 k targets 112 k → 115 k. Bull view void on a 16 h close beneath 103 k.

BTC at Make-or-Break: Rejection or Liftoff to $130K?
Bias/Summary
BTC is at a critical zone between 109K–112K. Price is currently showing hesitation after initial rejection at the Yearly L3 (112K), and I’m leaning short unless we see a strong breakout and hold above that level. However, if bulls reclaim it, we could see a fast move to 130K before many can react.
Technical Context:
Yearly L3 sits around the $112K zone – a historically significant level.
Price faced rejection at $112K and is now hovering near $109K.
Lower timeframe showing indecision, possible bearish bias.
Watching for:
Rejection + lower high below $112K = short setup.
Clean breakout + retest of $112K = shift to long bias.
Trade Idea / Setup:
🟥 Scenario A – Short Bias (Current Leaning):
Entry: 110K–111.5K (if rejection confirms)
Stop Loss: Above 112.5K
Targets:
TP1: 104K
TP2: 99K
TP3: 94K
R:R: Up to 3.5:1 depending on entry and target
🟩 Scenario B – Breakout Long (Contingent Setup):
Entry: 113K+ (after breakout and solid retest)
Stop Loss: Below 111K
Targets:
TP1: 120K
TP2: 130K
R:R: ~3:1 or more if momentum confirms
Risk & Patience Reminder:
⚠️Let price lead. No breakout = no long. No clear rejection = no short. Wait for confirmation, and don’t force entries in the chop.
Patience > Prediction.
NFA. DYOR. Manage your risk.

BTC Educational Idea by 1PercentFundedBTC Update : These are the possible scenarios for BTC based on 2021
Scenario A. BTC rejects 108/109k (Purple Arrow) & retest 98k (High Probability)
Scenario B. BTC retest 110/111k (Black Arrow) & creates a double top before dumping to 88/98k
Our team will be building shorts at 108k onwards & will add if 111k is given. 117.5k invalidation.

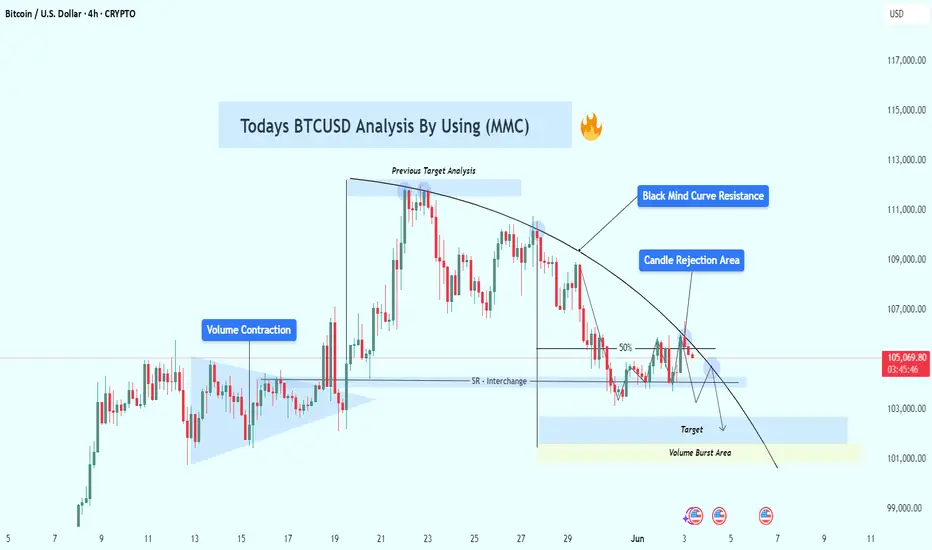
BTCUSD Analysis Using MMC – Bearish Rejection & Target🔷 Introduction:
Bitcoin is showing classic Market Maker manipulation at work—volume compression, false breakouts, support-resistance flips, and a fading rally under a well-defined descending curve.
This post offers a deep dive into the true intentions of smart money behind recent price actions, helping traders avoid traps and align with institutional moves.
🔎 Detailed Breakdown of Chart Structure:
🧱 1. Volume Contraction Zone – The Calm Before the Storm
📅 Period: May 13–18
Price consolidates within a symmetrical triangle pattern.
Volume steadily decreases as price tightens – a sign that market makers are accumulating positions while keeping volatility low.
This low-volume phase creates uncertainty for retail traders, shaking out weak hands and building a base for a deceptive breakout.
🔍 MMC Insight: Market Makers reduce volatility to absorb liquidity without alerting the market to their accumulation. This builds energy for a manipulated move.
📌 2. False Breakout to Previous Target Zone (~$110,000)
📅 May 20–23
A sudden bullish impulse takes price to the previous target zone, marked as a key area of historical liquidity.
Retail traders enter late long positions at this stage, anticipating further breakout.
🎯 But instead:
Price swiftly rejects from this level, forming long upper wicks and bearish engulfing candles.
This move is a liquidity sweep, where smart money offloads positions to late buyers.
🔍 MMC Insight: Institutions engineer a breakout to bait traders, only to dump into the momentum they create.
🔁 3. SR Interchange (Support Flips to Resistance)
📅 May 27–June 2
Former support around $104,000 – $105,000 is broken and then retested from below.
Price attempts to reclaim it, but fails—each touch results in rejection.
This confirms the area has flipped to resistance, aligning with MMC’s SR Interchange Rule.
📉 Significance: This zone now acts as a control point where market makers defend short positions.
🚫 4. Candle Rejection Area – Curved Trendline Resistance
A visually defined curved resistance line caps each rally, suggesting consistent seller presence.
Recent candles show clear rejection wicks and small-bodied candles at this level—classic distribution behavior.
Market is compressing under this trendline, hinting at an imminent breakdown.
🔍 MMC Insight: Curved trendlines show passive sell pressure where institutions repeatedly cap price in preparation for a drive lower.
📉 5. Next Target & Volume Burst Area: $101,000 – $102,000
This zone is crucial due to:
Presence of imbalance (inefficiency) left from previous bullish moves.
Likely stop loss clusters from retail long traders.
Historical high-volume node suggesting pending revisit for order rebalancing.
🟨 Yellow Zone = Volume Burst Area: Expected to act as a magnet for price due to liquidity concentration.
🧠 Psychology of the Trap:
📈 Retail Bias: “Bullish triangle breakout means more upside.”
🧠 Institutional Plan: “Use that belief to create exit liquidity, then reverse.”
This is textbook MMC manipulation:
Contract volume to build positions.
Break out to bait liquidity.
Reverse at supply.
Sell into rejection zones.
Trap traders at SR flips.
Drive price to reclaim liquidity at lower targets.
📊 Strategy Plan:
🔻 Bearish Bias Setup:
Entry Zone: $105,200 – $106,000 (candle rejection area)
SL: Above $106,800 (above supply curve)
TP1: $103,000
TP2: $101,000
TP3 (optional): $99,000 for deeper flush
🔁 Flip Bullish if:
Price reclaims $107,000 with momentum and closes above the curve.
Watch for volume confirmation and bullish SMC patterns (e.g., BOS + FVG fill).
⚠️ Risk Management & Notes:
Trade with 1–2% max risk per position.
Let confirmations play out (don't preempt rejection).
Watch U.S. data releases this week (highlighted on chart) – potential volatility triggers.
📌 Conclusion:
Bitcoin’s current behavior is a masterclass in market structure manipulation. Understanding MMC lets us:
Avoid false breakouts
Align with institutional intentions
Trade with probability, not emotion
Expect lower prices unless $106,800 is cleanly broken. The path of least resistance currently points downward toward liquidity zones.
BTC NewUpdate (2H)This analysis is an update of the analysis you see in the "Related publications" section
As we had identified in the previous analysis, the price could have reversed to the upside from either the upper or lower green zone. It seems that the orders in the upper green zone were sufficient.
Given the break of the trigger line, the area marked by the yellow circle is now a key zone for us. If the price pulls back to this yellow circled area, it could move toward the red zone. And if the red zone is broken, we might witness a new all-time high (ATH).
The closure of a 4-hour candle below the invalidation level will invalidate this analysis.
For risk management, please don't forget stop loss and capital management
Comment if you have any questions
Thank You

BTCUSDT – Ready for the next downward move🚀 Trade Setup Details:
🕯 #BTC/USDT 🔽 Sell | Short 🔽
⌛️ TimeFrame: 15m
--------------------
🛡 Risk Management:
🛡 If Your Account Balance: $1000
🛡 If Your Loss-Limit: 1%
🛡 Then Your Signal Margin: $1369.86
--------------------
☄️ En1: 104838.38 (Amount: $136.99)
☄️ En2: 105096.3 (Amount: $479.45)
☄️ En3: 105280.29 (Amount: $616.44)
☄️ En4: 105464.61 (Amount: $136.99)
--------------------
☄️ If All Entries Are Activated, Then:
☄️ Average.En: 105190.14 ($1369.86)
--------------------
☑️ TP1: 104215.87 (+0.93%) (RR:1.27)
☑️ TP2: 103752.49 (+1.37%) (RR:1.88)
☑️ TP3: 103166.5 (+1.92%) (RR:2.63)
☑️ TP4: 102425.86 (+2.63%) (RR:3.6)
☑️ TP5: 101614.34 (+3.4%) (RR:4.66)
--------------------
❌ SL: 105957.69 (-0.73%) (-$10)
--------------------
💯 Maximum.Lev: 75X
⌛️ Trading Type: Swing Trading
‼️ Signal Risk: ⚠️ High-Risk! ⚠️
🔎 Technical Analysis Breakdown:
This technical analysis is based on Price Action, Elliott waves, SMC (Smart Money Concepts), and ICT (Inner Circle Trader) concepts. All entry points, Target Points, and Stop Losses are calculated using professional mathematical formulas. As a result, you can have an optimal trade setup based on great risk management.
⚠️ Disclaimer:
Trading involves significant risk, and past performance does not guarantee future results. This analysis is for informational purposes only and should not be considered financial advice. Always conduct your research and trade responsibly.
💡 Stay Updated:
Like this technical analysis? Follow me for more in-depth insights, technical setups, and market updates. Let's trade smarter together!

Liquidity was the excuse. Expansion was the goal.This BINANCE:BTCUSDT.P move was written before it happened — clean sweep, BPR fill, and now the setup is primed. You either knew where price was going, or you reacted late.
Price expanded aggressively into a clear 1H IFVG. That wasn’t just a push — it was a calculated run into a premium imbalance.
Now? We're retracing. Right into the EQ of the breaker block and the 0.5 fib (105,039). Exactly where the market wants you uncertain. I’m not.
Here’s the logic:
1H IFVG is filled. That’s done.
Price retraced directly into the 0.382 and 0.5 fib zone.
We have a defined BPR, and price is now hovering around its midpoint — ideal zone for reaccumulation.
As long as 104,999–105,039 holds, I expect a continuation back into 105,891 → 106,478.
If that range breaks clean, the low-hanging liquidity below 104,359 becomes a magnet.
But the narrative right now? HTF is still aligned bullish. We're in the phase where most traders get shaken out before the real move starts.
Trade idea: If I’m in, my invalidation is clean — under 104,699. Target is north of 106,000. I’ll scale partials at 105,799 and let the rest ride.
You want more trades like this? Check the account description. I don’t just post setups — I build conviction.
Let the influencers scream. I prefer precision.

Bitcoin H4 | Potential bullish reversal?Bitcoin (BTC/USD) is falling towards a multi-swing-low support and could potentially bounce off this level to climb higher.
Buy entry is at 103,881.70 which is a multi-swing-low support that aligns close to the 23.6% Fibonacci retracement.
Stop loss is at 100,000.00 which is a level that lies underneath a multi-swing-low support.
Take profit is at 108,960.50 which is an overlap resistance that aligns with the 61.8% Fibonacci retracement.
High Risk Investment Warning
Trading Forex/CFDs on margin carries a high level of risk and may not be suitable for all investors. Leverage can work against you.
Stratos Markets Limited (tradu.com ):
CFDs are complex instruments and come with a high risk of losing money rapidly due to leverage. 63% of retail investor accounts lose money when trading CFDs with this provider. You should consider whether you understand how CFDs work and whether you can afford to take the high risk of losing your money.
Stratos Europe Ltd (tradu.com ):
CFDs are complex instruments and come with a high risk of losing money rapidly due to leverage. 63% of retail investor accounts lose money when trading CFDs with this provider. You should consider whether you understand how CFDs work and whether you can afford to take the high risk of losing your money.
Stratos Global LLC (tradu.com ):
Losses can exceed deposits.
Please be advised that the information presented on TradingView is provided to Tradu (‘Company’, ‘we’) by a third-party provider (‘TFA Global Pte Ltd’). Please be reminded that you are solely responsible for the trading decisions on your account. There is a very high degree of risk involved in trading. Any information and/or content is intended entirely for research, educational and informational purposes only and does not constitute investment or consultation advice or investment strategy. The information is not tailored to the investment needs of any specific person and therefore does not involve a consideration of any of the investment objectives, financial situation or needs of any viewer that may receive it. Kindly also note that past performance is not a reliable indicator of future results. Actual results may differ materially from those anticipated in forward-looking or past performance statements. We assume no liability as to the accuracy or completeness of any of the information and/or content provided herein and the Company cannot be held responsible for any omission, mistake nor for any loss or damage including without limitation to any loss of profit which may arise from reliance on any information supplied by TFA Global Pte Ltd.
The speaker(s) is neither an employee, agent nor representative of Tradu and is therefore acting independently. The opinions given are their own, constitute general market commentary, and do not constitute the opinion or advice of Tradu or any form of personal or investment advice. Tradu neither endorses nor guarantees offerings of third-party speakers, nor is Tradu responsible for the content, veracity or opinions of third-party speakers, presenters or participants.

Critical Support Test for Bitcoin: 100K Holding or Breaking? Dear Traders,
Bitcoin's previous support level of 106,000.00 has now been broken, turning it into a resistance point.
At this moment, Bitcoin is at a critical stage, and the most important support level is 100,000.00.
In this zone, rather than opening a position, it is wiser to observe carefully.
If the 100,000.00 support level breaks, I will provide you with a downward target.
If Bitcoin holds at this level and finds support, I will share an upward target.
Right now, Bitcoin is choosing its direction. Will the whales push the price up with their purchases, or drive it down with their sales? We have to watch patiently, like a hunter, to see how this unfolds.👀
Each and every one of you is incredibly valuable to me! I am always working hard to bring you the most accurate and insightful analysis.
A huge thank you to everyone who supports my work by leaving likes.🙏

Bitcoin (BTCUSDT) - Price Testing 26EMA and 12EMA - Daily ChartBitcoin (BTCUSDT) price is currently testing the 26EMA and 12EMA price levels on the Daily chart.
Bitcoin price has been in a medium-term uptrend since April and May 2025.
However, a short-term downtrend pullback has occurred and the price recently bounced up from the 26EMA zone ($104,000).
A morning star candle price pattern printed above the 26 EMA support line.
Large buyer volume could confirm the price candle pattern and Bitcoin price could rally up above 12EMA resistance ($106,000).
If price continues to reject and fall below $106,000 the downtrend would likely continue into June 2025.
Breaking news and stock market correlations could affect the price of Bitcoin and cryptocurrencies.
Tariff news and trade deals are supposed to occur throughout June and July 2025.

Hello Symmetrical triangleThe appearance of this symmetrical triangle marks the end of the decline in this cycle, in which the price is stabilizing in order to continue its upward movement. 109 is the next level.

Explanation of indicators indicating high points
Hello, traders.
If you "Follow", you can always get new information quickly.
Have a nice day today.
-------------------------------------
(BTCUSDT 1D chart)
If it falls below the finger point indicated by the OBV indicator, it can be interpreted that the channel consisting of the High Line ~ Low Line is likely to turn into a downward channel.
And, if it falls to the point indicated by the arrow, it is expected that the channel consisting of the High Line ~ Low Line will turn into a downward channel.
Therefore, if it is maintained above the point indicated by the finger, I think it is likely to show a movement to rise above the High Line.
In this situation, the price is located near the M-Signal indicator on the 1D chart, so its importance increases.
To say that it has turned into a short-term uptrend, the price must be maintained above the M-Signal indicator on the 1D chart.
In that sense, the 106133.74 point is an important support and resistance point.
(1W chart)
The HA-High indicator is showing signs of being created at the 99705.62 point.
The fact that the HA-High indicator has been created means that it has fallen from the high point range.
However, since the HA-High indicator receives the value of the Heikin-Ashi chart, it indicates the middle point.
In other words, the value of Heikin-Ashi's Close = (Open + High + Low + Close) / 4 is received.
Since the HA-High indicator has not been created yet, we will be able to know for sure whether it has been created next week.
In any case, it seems to be about to be created, and if it maintains the downward candle, the HA-High indicator will eventually be created anew.
Therefore, I think it is important to be able to maintain the price by rising above the right Fibonacci ratio 2 (106178.85).
Indicators that indicate high points include DOM (60), StochRSI 80, OBV High, and HA-High indicators.
Indicators that indicate these high points are likely to eventually play the role of resistance points.
Therefore,
1st high point range: 104463.99-104984.57
2nd high point range: 99705.62-100732.01
You should consider a response plan depending on whether there is support near the 1st and 2nd above.
The basic trading strategy is to buy at the HA-Low indicator and sell at the HA-High indicator.
However, if it is supported and rises in the HA-High indicator, it is likely to show a stepwise rise, and if it is resisted and falls in the HA-Low indicator, it is likely to show a stepwise decline.
Therefore, the basic trading method should utilize the split trading method.
Other indicators besides the HA-Low and HA-High indicators are auxiliary indicators.
Therefore, the trading strategy in the big picture should be created around the HA-Low and HA-High indicators, and the detailed response strategy can be carried out by referring to other indicators according to the price movement.
In that sense, if we interpret the current chart, it should be interpreted that it is likely to show a stepwise rise since it has risen above the HA-High indicator.
However, you can choose whether to respond depending on whether there is support from other indicators that indicate the high point.
On the other hand, indicators that indicate the low point include the DOM (-60), StochRSI 20, OBV Low, and HA-Low indicators.
These indicators pointing to lows are likely to eventually serve as support points.
I will explain this again when the point pointing to the lows has fallen.
-
Thank you for reading to the end.
I hope you have a successful trade.
--------------------------------------------------
- Here is an explanation of the big picture.
(3-year bull market, 1-year bear market pattern)
I will explain the details again when the bear market starts.
------------------------------------------------------

BTC SHORT TP:103,100Alright, let’s talk real — this might be the Sunday fakeout special 🍿
I’m eyeing a SHORT between 104,500 – 104,800, aiming for 103,000 – 103,350 with a 4RR.
We’re riding the 1H to 3H charts and expecting the move within 15 hours.
Looks like a clean bearish continuation — but with the recent manipulations, anything can happen. Set your stop smart based on your strategy.
If it doesn’t happen in time, toss it. Trade’s invalid.
We don’t use indicators, we’re not out here drawing lines or cute little shapes — I just give you a clean trade.
#BTC #Short #PriceAction
