SPY/QQQ Plan Your Trade for 5-30 : CRUSH PatternToday's CRUSH pattern should result in a continued downward price trend in my analysis is accurate. I have seen CRUSH pattern trend upward sometimes. So, please understand I'm reading the chart and pattern as a rolling top type of pattern leading to a CRUSH (downward) price trend today.
I highlight the potential for a FAILED CRUSH (downward) price bar - whereas a reversion back to the upside is a potential. But, I estimate that potential at only 20-25% at this time.
My analysis suggests the breakdown in price will likely continue, and we'll likely see the SPY/QQQ/Bitcoin continue to try to trend downward.
Gold and Silver are moving into a fairly solid Gap-Stall-Revert-Flush pattern that may see Gold attempt to rally back above $3400 today. Silver is currently trading very close to a STDDEV Reversion level, so Silver may not see a big move today (like Gold).
I'm hopeful we start to see a big breakaway move in Gold/Silver today and carry into next week.
My TTScanner algos generated new BUY triggers for GDX, GDXJ, and NUGT yesterday. That's a very good sign we are getting into a BUY/BULLISH mode in metals again.
I got up late today. Somehow, my alarms got turned off.
Happy Friday.
Get some.
#trading #research #investing #tradingalgos #tradingsignals #cycles #fibonacci #elliotwave #modelingsystems #stocks #bitcoin #btcusd #cryptos #spy #gold #nq #investing #trading #spytrading #spymarket #tradingmarket #stockmarket #silver
1-BTCUSD

BTC-USD triangle rejection. Target 101k USDThere is clear triangle formed, and now we have rejection of the price. Drop target is 101k USD. Let's see what future will bring.

TRBUSDT Forming classical Bullish BreakoutTRBUSDT has recently broken out of a long accumulation zone, forming a classic bullish breakout structure on the daily chart. The asset saw a significant surge from the key support zone between $28 to $32, which has now been confirmed as a strong demand area. The breakout was backed by a sharp spike in volume, indicating strong buyer conviction and institutional interest entering the market. This breakout marks a pivotal shift in momentum and suggests that the bulls are in full control.
The technical setup points to a potential rally of 100% to 130%, targeting levels around the $75 mark and beyond. The previous resistance zones have been decisively cleared, and the strong green candles hint at the possibility of a sustained uptrend. If the asset holds above the breakout level and continues to consolidate at higher levels, it could build a strong base for the next impulsive move. This kind of vertical price action is often seen in assets with growing investor demand and limited supply pressure.
Investor interest in TRB is noticeably rising, as reflected in the increased social media chatter, positive sentiment across crypto forums, and higher engagement on trading platforms. The coin is benefiting from renewed market confidence and strong fundamentals. With macro tailwinds in the crypto market and a technically sound chart, TRB appears poised to outperform in the coming weeks.
Traders should closely monitor the price action around $50–$52 for potential retest opportunities. A successful retest followed by bullish continuation could offer a high-risk/reward long setup. The projected upside remains highly favorable, supported by robust volume and clean technical structure.
✅ Show your support by hitting the like button and
✅ Leaving a comment below! (What is You opinion about this Coin)
Your feedback and engagement keep me inspired to share more insightful market analysis with you!

DeGRAM | BTCUSD reached the strong trend line📊 Technical Analysis
● Bulls defended 105 k again: a bullish inside-bar formed on the green demand band and purple trend-line, keeping price glued to the rising-channel median.
● 4 h RSI reset to mid-40s while OBV held flat, signalling dip absorption; pattern projects a swing back to the channel roof/-red supply near 112-115 k if 111 k neckline is cleared.
💡 Fundamental Analysis
● The Coinbase premium flipped positive for the first time in two weeks, reflecting fresh US spot buying just as soft Chicago PMI dragged the DXY lower, easing macro head-winds.
✨ Summary
Buy 105-108 k dips; break above 111 k eyes 112 k then 115 k. Trend intact while price closes above 104 k.
-------------------
Share your opinion in the comments and support the idea with a like. Thanks for your support!

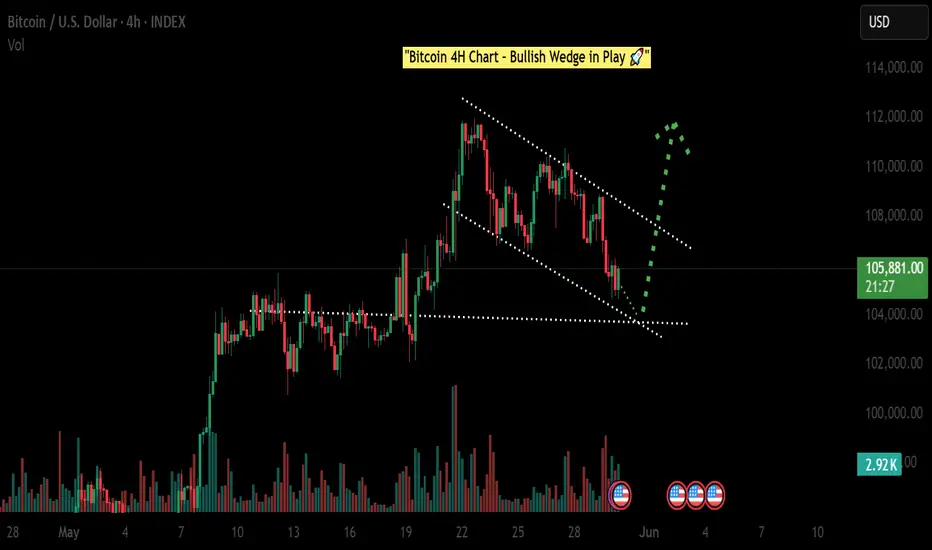
"BTC at Key Support – Watching for Bounce"🔍 BTC/USD 4H Chart Analysis – Falling Wedge Setup
Bitcoin is currently trading inside a falling wedge pattern, which historically tends to resolve to the upside. The price is approaching a key support area near the wedge's lower boundary, with decreasing volume indicating a possible shift in momentum.
We are now watching for a potential bullish reaction from this level. A breakout above the wedge resistance may open the door for a move toward the 110K region.
📌 Key Levels:
- Wedge Support: ~104K
- Resistance Breakout Zone: ~107K–108K
- Upside Target if breakout confirms: ~110K+
⚠️ This is not financial advice. This is a technical analysis idea based on historical chart patterns and market structure.
Let me know your thoughts in the comments. Do you think BTC will bounce here?
#Bitcoin #BTCUSD #Crypto #TechnicalAnalysis #FallingWedge
Bitcoin is bearish | stay cautious (1H)This analysis is an update of the analysis you see in the "Related publications" section
We have been warning about a potential Bitcoin correction for some time. It appears that wave G has ended, and key levels have been lost. If the price reaches the red box, it is expected to be rejected downward.
The green zone is a relatively strong support area for Bitcoin, and we should closely watch this level.
A daily candle closing above the invalidation level would invalidate this analysis.
For risk management, please don't forget stop loss and capital management
Comment if you have any questions
Thank You

Bitcoin Price Analysis – 1H Chart (BINANCE)📊 Bitcoin Price Analysis – 1H Chart (BINANCE)
Date: May 28, 2025
Pair: BTC/USDT
Timeframe: 1 Hour (1H)
🏔 All-Time High (ATH) Rejection
🔴 Zone: ~111,800 – 112,000 USDT
BTC previously reached an ATH (marked in red) but failed to maintain momentum.
This level formed a double top pattern, a classic reversal signal.
📉 Key Resistance Zone
🟪 Range: ~109,500 – 110,500 USDT
Multiple rejections from this purple box indicate strong seller presence.
This area is now acting as a resistance barrier, preventing upward movement.
🔵 Support & Target Level
📍 Support Level: 106,622.06 USDT
🗨️ “when touch this level next target 100k”
The blue line represents a crucial short-term support.
The chart suggests a bearish move toward this level before a possible bullish reversal.
If price breaks below this, we could see further downside before any major rally.
🔄 Market Structure
🔹 BTC has formed a lower high structure, indicating weakening bullish momentum.
🔻 A head-and-shoulders pattern appears to be forming, which typically signals a reversal from bullish to bearish.
🧠 Trader Insight
📌 A drop to 106,622 USDT may act as a liquidity grab, potentially setting the stage for a major move upward.
⚠️ However, confirmation of a reversal (bullish signals, volume spike) will be critical before assuming a breakout to 100k as implied.
🔍 Conclusion
🚨 BTC is in a critical zone between resistance (~110,000) and support (~106,600).
📉 Near-term bias: Bearish → Targeting 106,622 USDT
📈 Medium-term possibility: Bullish rally only if support holds and sentiment shifts.

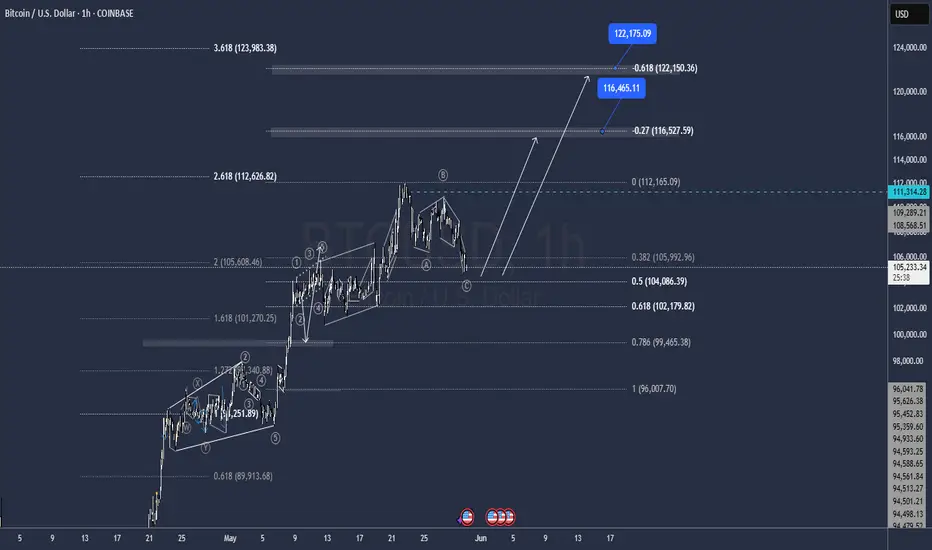
$BTC Hits Key Support Will the Bulls Defend?Bitcoin2025 is currently testing a key support zone at $104,800, where the ascending trendline and horizontal support intersect.
This level is crucial, holding here could trigger a bounce back toward the $117K–$121K zone within the rising channel.
However, a breakdown below this support may lead to a drop toward the $101K fair value gap or even lower supports around $97K and $88K.
BTC is at a decision point.
Watch this level closely for the next move.
DYRO, NFA

BITCOIN (BTCUSD): A Deeper Correction?!
After Bitcoin updated the All-Time High, the market became
weak and exhausted.
A violation of a support line of a rising channel and a breakout
of a key horizontal support indicate a highly probable continuation
of a correction.
Our closest demand zone is 103200. It can be the goal for the sellers for now.
❤️Please, support my work with like, thank you!❤️

$BTC $104K TO $121K
Bitcoin's retreat to the $104k major support will be welcomed as a healthy bit correction, and I think the target will be $121k unless closures below this level are seen.

BTCUSDT on daily support, likely to head to 109kWe have the price revisiting the daily support DS1.
This presents a long opportunity for us.
The price is likely to find support in this zone and bounce from here.
The target of this long trade shall be the daily resistance DR1 marked on the chart. This resistance zone DR1 sits around 109k area.
In case the price reaches there, it is likely to experience some pullback there.
We will reevaluate the price action on DR1 once it reaches there and decide about the next steps.
What do you think about BTC price and this trade setup presented? Share it with me in the comments.

BITCOIN targets 165k based on VIX's 10-year SupportBitcoin (BTCUSD) has started a new (and possibly last for this Cycle) Bullish Leg following April's bottom and has already made a new All Time High (ATH).
The BTC/VIX ratio on that very same day (April 07 2025) hit and rebounded on its 10-year Higher Lows trend-line, a Support level that has been holding since the August 24 2015 market bottom.
Every rebound on this Higher Lows trend-line, has produced a strong medium-term rally, the 'weakest' of which has been the most recent (August - December 2024), which rose by +121.44%. If BTC repeats this 'minimum', we are looking at a $165000 High, which aligns perfectly with the majority of projections for this Cycle's Top.
Do you think we will see that price by October? Feel free to let us know in the comments section below!
-------------------------------------------------------------------------------
** Please LIKE 👍, FOLLOW ✅, SHARE 🙌 and COMMENT ✍ if you enjoy this idea! Also share your ideas and charts in the comments section below! This is best way to keep it relevant, support us, keep the content here free and allow the idea to reach as many people as possible. **
-------------------------------------------------------------------------------
💸💸💸💸💸💸
👇 👇 👇 👇 👇 👇

BTCUSD Breakdown from Pennant – MMC Structure Analysis + Target🧠 Introduction: Why This Chart Matters
Bitcoin recently provided a textbook example of market manipulation, where the price action formed a bullish-looking pattern (Pennant), trapped traders with a fake breakout, and then reversed strongly to the downside. By using Mirror Market Concepts (MMC), we can clearly see the logic behind this move—how the market mirrored a previous pattern and fulfilled a predictable target zone.
This analysis breaks it all down, step-by-step, for both educational and practical trading purposes.
🔍 Detailed Chart Breakdown:
1️⃣ The Illusion – Bullish Pennant Formation
Initially, BTC/USD formed what looked like a bullish pennant—a common continuation pattern in technical analysis. The pattern appeared after a sharp upward move, followed by converging trendlines suggesting consolidation.
Retail traders often anticipate a breakout above the pennant as a sign of bullish continuation. This is where the trap begins.
Why It’s a Trap: The pattern looked clean and reliable—but the context told another story. This move was designed to lure breakout traders into long positions right before a reversal.
2️⃣ The Fakeout – Liquidity Grab Above the Pattern
Shortly after the pennant formed, price pushed above the upper trendline, triggering breakout entries and stop losses of short-sellers. But instead of continuing up:
The price reversed sharply.
This aggressive move confirmed the fakeout.
This is a classic example of a liquidity hunt, where the market moves briefly in one direction to gather orders before executing the real move.
📌 MMC Insight: This behavior mirrors a prior setup—price previously faked upward, then dropped to a key demand zone. The mirror pattern gives a clue that the same outcome might repeat.
3️⃣ CHoCH – Change of Character Confirmed
After the fakeout, BTC broke below a key internal support and trendline structure, signaling a CHoCH (Change of Character)—a shift from bullish to bearish market control.
This moment is crucial:
It confirms the smart money’s intention.
It signals that the previous bullish move was just a setup.
Sellers now have control.
💡 Pro Tip: CHoCH is one of the earliest and most reliable signs of a reversal when combined with liquidity patterns.
4️⃣ Trendline Break & Structural Sell-Off
The break of the trendline following CHoCH solidified the bearish direction. This was the best confirmation-based entry point, as the structure flipped and began forming lower highs and lower lows.
5️⃣ Target Fulfilled – Previous Demand Zone Hit
The price then continued down aggressively and hit the marked MMC target zone. This area coincided with:
A previous demand zone (where buyers stepped in before).
A Mirror Market reversal point, seen earlier in the chart.
This fulfillment of the MMC target validates the entire analysis—from trap to reversal to target.
🎯 Key Zones:
Fakeout High: $69,600 area (liquidity sweep)
CHoCH Break Level: Around $69,100
Trendline Break Confirmation: $69,000
Final Target Zone: $68,500–$68,700
📈 Trading Strategy Recap:
Entry Idea: Enter short after CHoCH and trendline break
Stop Loss: Above fakeout high ($69,600+)
Take Profit: MMC demand zone ($68,500–$68,700)
This trade offered excellent risk-to-reward and confluence using multiple tools (MMC, CHoCH, structure, liquidity sweep).
🧠 What You Can Learn from This Setup:
Patterns Can Lie: A pattern like a pennant isn’t enough—context is key.
Liquidity Is King: Understand where the market needs to go to collect orders.
Mirror Market Concepts Work: Historical behavior often repeats in reverse. Use MMC to forecast likely outcomes.
CHoCH is Powerful: It's your early alert system for trend changes.
🔎 Final Thoughts:
This BTC/USD chart is a powerful example of how smart money operates—with manipulation, pattern traps, and mirrored market behavior. If you’re a price action trader or use MMC, this breakdown is a must-study.
Don't just trade patterns—trade context. Look for traps. Use MMC. Watch CHoCH. And always have a mapped target based on structure.

Bitcoin moving downwardsHello dear friends.
According to the chart and the performance that Bitcoin has shown, it seems that we are in a short-term downtrend.
Bitcoin is expected to move to the resistance of 104,700 and then we will have a rebound.
❗Please note that this is an analysis and the possibility of a reversal is possible.

BTCUSDT 4H AnalysisBTC ~ 4H Analysis
#BTC On the 4H Time frame Bitcoin is retesting this multi support level. Let's see how far this support can hold.

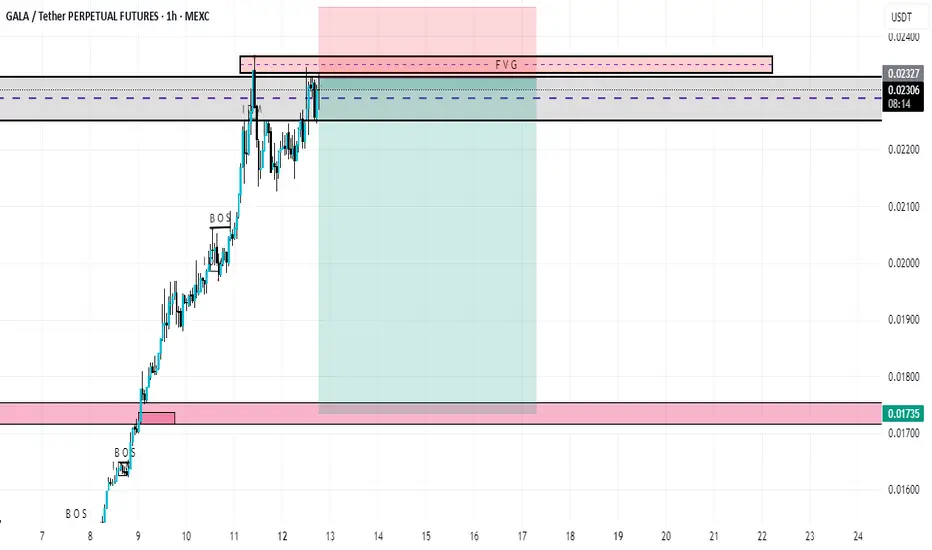
gala short tradegala is on 4hr bearish orderblock and no w going to retrace the HTF (POI) daily advanced order block at 0.01735
trade short
entry 0.02333
target 0.01735
stop loss 0.02460
[4h] BTC forming bullish flag at ATHBitcoin will likely form bullish structure here at ATH as we near a breakout. A bull flag or a falling wedge will create significant momentum and push BTC towards 125k+ on initial wave. Cycle top remains ~150k.

BTC Update on a Daily Timeframe.Hello Traders,
BTC is currently attempting to hold its price above a key resistance level. On the daily timeframe, we can observe a clear breakout and retest, and it’s now showing signs of a rebound.
What we need now is for BTC to hold this level on the daily close to confirm bullish strength.
However, a breakdown below this support could lead to a significant drop in price.
While the sentiment remains optimistic, it’s important to stay aware of all possible scenarios.
Trade safely, and always do your own research and analysis before investing.

BITCOIN BULLISH TO $116,000 (UPDATE)Bitcoin has come very close to our $116,000 target, within the Crypto Fund for my investors. Price is currently retracing down after peaking at a new ATH of $111,000.
I'll be keeping an eye on market structure & deciding if I should close out early, or hold on a little longer. Always stay adapted to the markets!

BTCUSDT Analysis: Bullish Intent Building on Higher TimeframesTaking a look at BTCUSDT. My analysis points to this current level as a significant support zone, with my overall target being higher.
While the low timeframe (LTF) action hasn't yet shown a strong influx of buyers, the picture on the higher timeframes is quite compelling. The upward movement we're seeing there is displaying solid support, indicating sustained buying interest at a larger scale.
This divergence between the LTF and HTF suggests a potential build-up of bullish momentum. We might see some consolidation or sideways movement on the lower timeframes as buyers accumulate before a more decisive push upwards.
As always, I'm keeping a close eye on the volume footprint. The sustained buying volume on the higher timeframes lends credence to this bullish outlook. I'll be waiting for the low timeframe to catch up, looking for those clear signs of buyer entry – breakouts above smaller resistances with increasing volume, and successful retests as support. CDV (Cumulative Delta Volume) on both timeframes will also be crucial in confirming this directional bias.
Remember, I focus on coins showing sudden and significant increases in volume, and while the immediate LTF might be quiet, the HTF volume profile is definitely noteworthy here.
My bias for BTCUSDT right now is upwards, given the supportive structure on the higher timeframes. However, as always, I'll be waiting for that low timeframe confirmation before considering any entries. Patience and confirmation are key, even when the higher timeframe picture looks promising. Let's see if the lower timeframes will soon echo the bullish intent we're seeing on the higher ones.
📌I keep my charts clean and simple because I believe clarity leads to better decisions.
📌My approach is built on years of experience and a solid track record. I don’t claim to know it all but I’m confident in my ability to spot high-probability setups.
📌If you would like to learn how to use the heatmap, cumulative volume delta and volume footprint techniques that I use below to determine very accurate demand regions, you can send me a private message. I help anyone who wants it completely free of charge.
🔑I have a long list of my proven technique below:
🎯 ZENUSDT.P: Patience & Profitability | %230 Reaction from the Sniper Entry
🐶 DOGEUSDT.P: Next Move
🎨 RENDERUSDT.P: Opportunity of the Month
💎 ETHUSDT.P: Where to Retrace
🟢 BNBUSDT.P: Potential Surge
📊 BTC Dominance: Reaction Zone
🌊 WAVESUSDT.P: Demand Zone Potential
🟣 UNIUSDT.P: Long-Term Trade
🔵 XRPUSDT.P: Entry Zones
🔗 LINKUSDT.P: Follow The River
📈 BTCUSDT.P: Two Key Demand Zones
🟩 POLUSDT: Bullish Momentum
🌟 PENDLEUSDT.P: Where Opportunity Meets Precision
🔥 BTCUSDT.P: Liquidation of Highly Leveraged Longs
🌊 SOLUSDT.P: SOL's Dip - Your Opportunity
🐸 1000PEPEUSDT.P: Prime Bounce Zone Unlocked
🚀 ETHUSDT.P: Set to Explode - Don't Miss This Game Changer
🤖 IQUSDT: Smart Plan
⚡️ PONDUSDT: A Trade Not Taken Is Better Than a Losing One
💼 STMXUSDT: 2 Buying Areas
🐢 TURBOUSDT: Buy Zones and Buyer Presence
🌍 ICPUSDT.P: Massive Upside Potential | Check the Trade Update For Seeing Results
🟠 IDEXUSDT: Spot Buy Area | %26 Profit if You Trade with MSB
📌 USUALUSDT: Buyers Are Active + %70 Profit in Total
🌟 FORTHUSDT: Sniper Entry +%26 Reaction
🐳 QKCUSDT: Sniper Entry +%57 Reaction
📊 BTC.D: Retest of Key Area Highly Likely
📊 XNOUSDT %80 Reaction with a Simple Blue Box!
📊 BELUSDT Amazing %120 Reaction!
📊 Simple Red Box, Extraordinary Results
📊 TIAUSDT | Still No Buyers—Maintaining a Bearish Outlook
📊 OGNUSDT | One of Today’s Highest Volume Gainers – +32.44%
📊 TRXUSDT - I Do My Thing Again
I stopped adding to the list because it's kinda tiring to add 5-10 charts in every move but you can check my profile and see that it goes on..

Euraud final forecast!!Good day traders, I’m back with yet another update on EurAud and this time we wanna see price shoots!!

BTCUSD: About to explode to 135k by July.Bitcoin is about to turn neutral again on its 1D technical outlook (RSI = 57.730, MACD = 3423.900, ADX = 23.501) as it is expreriencing the strongest pullback since the start of its April bottom. Having completed a 1D Golden Cross like on October 27th 2024, this pullback seems a lot like the one that suceeded that Cross, which tested the LH trendline and marginally crossed under it and as it held the 1D MA50, resumed the uptrend and exploded to the 3.382 Fibonacci extension. That is our target on a July horizon (TP = 135,000).
## If you like our free content follow our profile to get more daily ideas. ##
## Comments and likes are greatly appreciated. ##
