Is the momentum in Bitcoin EXHAUSTED? Or not yet?In recent days, Bitcoin has been actively updating its ATH almost daily. Everyone is already predicting $150,000 by the end of the month.
🔥 But is everything really so rosy? Let's take a closer look!
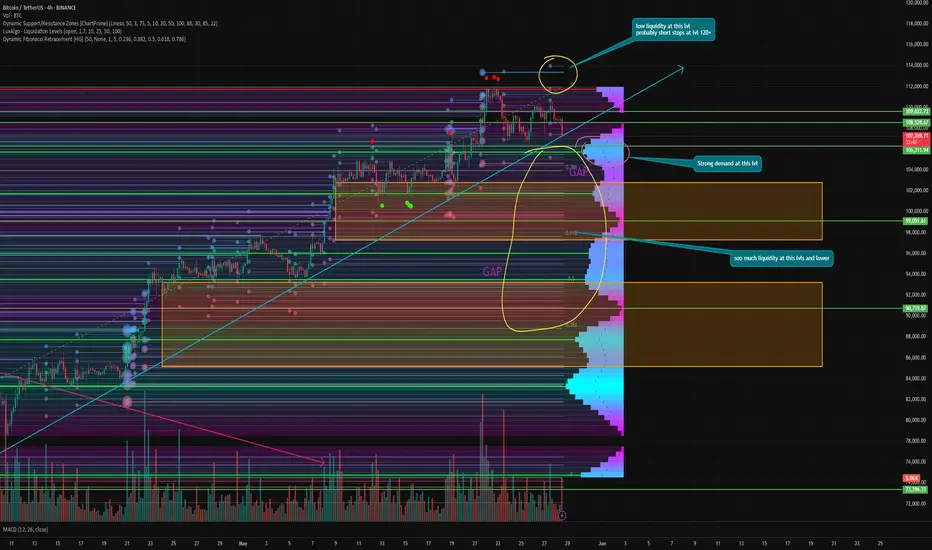
During the powerful growth over the past month, two gaps have formed below us. The first is at $97,368–102,867. The second is at $85,158–93,232. And as we know, in 99% of cases, gaps close sooner or later.
📊 Technical:
Liquidity zones - as we know, the price moves from liquidity to liquidity, which pushes it in one direction or another. Right now, there is practically no liquidity above us; it is all concentrated below. Only a move to $99,000 can now liquidate more than a billion dollars in longs.
I think short sellers' stops are much higher, at $120,000 and above. There is no point in placing them here when there is still no confirmation of a trend reversal.
⚙️ Metrics and indicators:
Volume - as I say in every review - is not a new growth impulse. It is a technical rebound. It has been moving at reduced volumes all along, which have only continued to decline.
MACD - has already given a bearish crossover , but this is certainly not the best indicator on such a TF. However, in combination with other indicators, it can predict a trend reversal at the right time.
DSRZ - shows the volume of interest at certain levels, and now we see that the first block of interest is concentrated in the $106,000–104,000 zone. These are the first support levels, from which I will expect the first rebound if the correction continues.
Liquidation Levels - as I said, all liquidity is now concentrated at the bottom. Bitcoin is very overheated and it's time to cool it down. Many think that it will be overheated when, as in the previous cycle, funding will be 0.2 and above.
But this is a different cycle, a different time, different traders, and different rules. This has already been proven more than once in this cycle.
📌 Conclusion:
I have said many times that we should not expect much from this momentum and that it is purely a technical rebound. And if something does not push us sharply upward now to bring in retail, we can definitely not expect it before the fall.
Summer is coming, investors and traders will close their positions and go on vacation. The market will be quiet.
So, personally, I am leaning back in my chair, expecting a price of at least $85,000, and watching what happens next. 🥃
1-BTCUSD
BTCUSD | Head and Shoulders Pattern on 15m Chart Suggesting PoteBitcoin (BTCUSD) on the 15-minute timeframe has formed a classic Head and Shoulders structure, a well-known pattern often associated with possible short-term trend reversals.
Key Details:
Pattern: Clear Left Shoulder, Head, and Right Shoulder formation.
Neckline Level: Around 107,437 – currently acting as a crucial support zone.
Trendline: Price has broken below a short-term rising trendline, confirming pattern completion.
Volume Analysis: Volume increased during the formation of the head, hinting at a potential shift in sentiment.
Note: A confirmed close below 107,400 may attract further downside movement. Conversely, holding above this level could lead to consolidation or recovery.
This analysis is intended for educational purposes—please evaluate risk and confirm with your own strategy before taking any trade decisions.

Bitcoin reversal confirmed ?!Bitcoin reversal confirmed ?! 👀
I would like to present you some charts with important levels and relevant patterns.
🖥daily-chart (BITSTAMP) and 💡everything important in the chart 👀
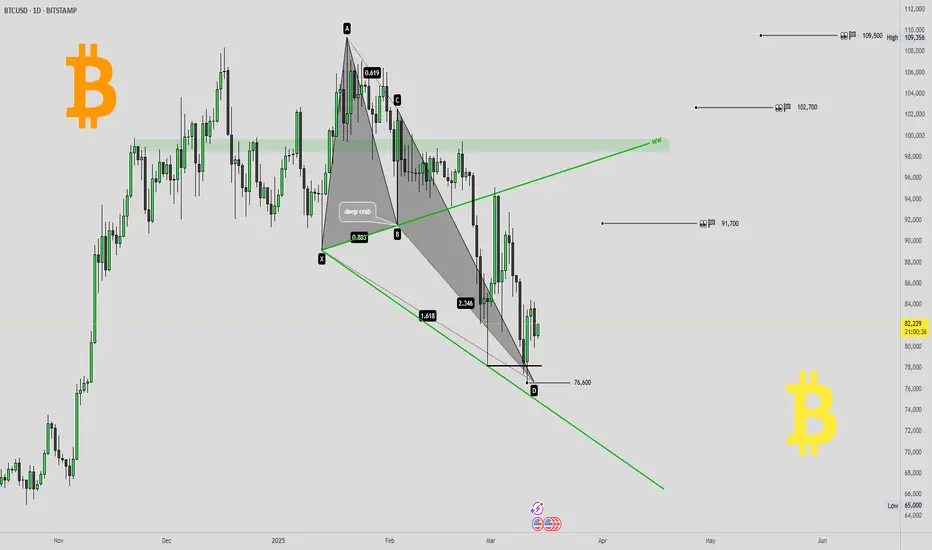
💥Here in the daily chart (BITSTAMP)
- a Deep-Crab harmonic with
- a WolveWave
and the daily-chart of the
🔥Daily MA200 re-test 👀
- gap fill
- support-line 2022 and 2024 TOPs
👉 BITCOIN roadmap/outlook (from 27th february 2024) 💡
🎯 If you like this idea, please leave me a 🚀 and follow for updates 🔥⏰
Furthermore, any criticism is welcome as well as any suggestions etc. - You're also very welcome to share this idea.
Have a nice evening & successful trading decisions 💪
M_a_d_d_e_n ✌
NOTE: The above information represents my idea and is not an investment/trading recommendation! Without any guarantee & exclusion of liability!
recap - " Bitcoin reversal confirmed ?! "BITCOIN reversal confirmed?! 👀
BITSTAMP:BTCUSD
How did this idea develop? 🤔
🥇Recap of the idea(s) from March 14, 2025 (see right 👀 under “Related Publications”)🎯
Hello ❤TradingView Community 👋
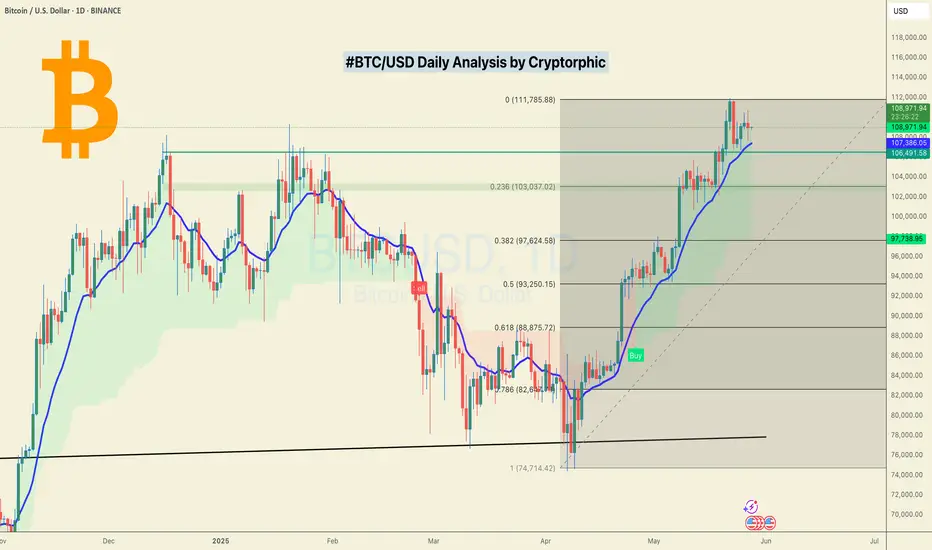
After the sell-off/correction ended on April 7, 2025' - Bitcoin reached an absolute low of $74434. This was followed by a nice rally and the complete fulfillment of the price targets from the idea of March 14, 2025 (push the play-button 😍).
Everything important is in the chart!
💡 This idea is closed at this point ✔
👉 All targets have been achieved 🎯💪
💥Follow me to stay up to date and be the first to receive these important updates/news & not miss anything! ⏰🔔
Furthermore, any criticism and suggestions etc. are welcome. - Feel free to share this idea.
Have a nice day & happy trading folks 🔥💪
M_a_d_d_e_n ✌
NOTE: The above information represents my idea and is not an investment/trading recommendation! No guarantee & exclusion of liability!
👉 BITCOIN roadmap/outlook (from 27th february 2024) 💡

SPY/QQQ Plan Your Trade For 5-28 : Inside Breakaway PatternToday's Inside-Breakaway pattern suggests the markets may attempt to rally above yesterday's close on strong news or earnings. Today is the NVDA earnings day (after the close). I suspect trading will be somewhat flat ahead of these highly anticipated earnings.
Traders would be smart to position into a HEDGE ahead of the NVDA earnings this afternoon.
Obviously, if the earnings are good, the markets will react to the upside. If they are poor/weak, the markets could easily move aggressively downward.
All I know is the tariff moves over the past few weeks pushed gamers and others into buying high-end graphics cards back in April/May because everyone thought prices would skyrocket 30-50% or more. So, maybe NVDA will report strong revenue while costs increase.
It should be an interesting day after the close. Until then, I believe the markets will stay somewhat FLAT - anticipating NVDA data/comments.
Gold and Silver are still working through the FLAG APEX. Silver is already beyond the FLAG APEX and could make a big move higher at any moment. Gold still has one small downward price move to complete before the FLAGGING pattern is complete.
Overall, I believe Gold and Silver are forming a solid base near $3300/$33 for a strong rally in the future.
BTCUSD is stalling. In fact, the SPY/QQQ/BTCUSD are all stalling near the 0.75% Fib level (as shown on my charts). We may be setting up for that big breakdown I've been warning about. But, until we actually SEE price break out of the upward EPP Flagging channel - don't get overly confident of a BIG BREAKDOWN move.
My advice would be to HEDGE any aggressive trades you are trying to take right now. If you believe the markets are going to rally substantially, try to hedge that trade with some risk protection (longer-dated PUTS).
Today could be a catalyst day. We may get a breakout/breakdown move after NVDA's earnings/data.
Buckle up.
Get some.
#trading #research #investing #tradingalgos #tradingsignals #cycles #fibonacci #elliotwave #modelingsystems #stocks #bitcoin #btcusd #cryptos #spy #gold #nq #investing #trading #spytrading #spymarket #tradingmarket #stockmarket #silver

GEC gecko inu ready for pump IHNS pattern, volume increase significantly is a sign of reversal 🚀🛰
NFA!DYOR!

Bitcoin MMC Analysis – Mirror Market Concepts in Action + Target📌 Overview:
In this idea, I’m using Mirror Market Concepts (MMC) to break down Bitcoin’s current price behavior. MMC is a powerful way to spot repetitive price patterns, psychological zones, and mirrored moves that help us predict where the market might go next.
Let’s break down what this chart is really telling us. 👇
🔁 1. Mirror Market Concept in Play
MMC is all about symmetry. Think of it like looking into a mirror—what price did on the left side, it might repeat (or mirror) on the right side.
Look at the two rounded zones (highlighted in light blue ellipses). Price dipped into the support zone, formed a rounded bottom, and then shot up. A similar pattern is forming again on the right-hand side. This mirroring behavior gives us a clue that price could follow the same path upward again.
📉 2. Trendline Resistance – A Key Level
The chart shows a clear descending trendline that has been respected multiple times. Every time price tries to break above this line, it gets rejected. This tells us that sellers are still in control at that level.
Until this trendline is broken cleanly, bullish momentum remains capped. However, multiple tests of the trendline also indicate it's getting weaker, so a breakout might be coming.
🟪 3. Support Zone – Buyer’s Stronghold
See the purple shaded area near $108,400? That’s the support zone. Price bounced off this area several times, showing that buyers are defending this level.
This zone is important because:
If it holds, we can expect another upward push.
If it breaks, price could drop to the next support level (not shown here, but could be around $107,000–$107,500 based on structure).
🎯 4. Previous Target Hit – New Target Identified
Using MMC, we previously predicted a move up to around $110,800, and that target has been successfully hit (labeled as "Previous Target" in the chart).
Now, a new target zone is forming around $109,600–$109,800, marked on the right side of the chart. If price breaks above the trendline and central zone, this is the next likely destination.
🔵 5. Central Ellipse Zone – Compression Area
The blue ellipse on the right side represents a central zone—an area of price compression and indecision. In MMC, this is where price builds up energy before a move. It acts like a spring: the longer price consolidates here, the bigger the breakout move will be.
Right now, BTC is compressing in this central zone. This is a critical moment. The breakout direction from here could decide the short-term trend.
📊 Trade Plan Ideas:
🔹 Bullish Scenario:
Wait for a clean breakout above the trendline and central zone.
Look for a retest of the breakout area (confirmation).
Target the $109,600–$109,800 zone.
🔹 Bearish Scenario:
If price fails to break the trendline and drops below the support zone at $108,400…
We could expect a deeper pullback toward $107,000–$107,500.
🔹 Key Levels:
Resistance: $109,200 (trendline area), $109,800 (target zone)
Support: $108,400 (zone), $107,500 (next major support if broken)
📘 Final Thoughts:
This chart is a perfect example of how MMC (Mirror Market Concepts) can give us a visual roadmap of what price might do next. It’s not about guessing—it’s about recognizing the psychological patterns that repeat over and over in the markets.
Right now, Bitcoin is sitting at a decision point:
Break above the trendline = possible bullish continuation
Break below support = likely bearish shift
Watch the central zone closely—because the next big move could start from right there. 🔍

BTC in Bearish Wedge _ Breakdown or Bonus at Demand Zone?🔍 Technical Breakdown:
Bitcoin is currently trading within a *bearish wedge pattern* on the 1H timeframe. Price action is compressing, indicating a potential breakout soon.
⚠ *Bearish Bias:*
If the rising support breaks down, we expect a move toward the *103,000–102,000 support zone*, which has previously acted as strong demand.
📉 *RSI* is trending lower, showing weakening momentum.
📉 *MACD* crossover favors sellers (if applicable).
📌 Watch for reaction in the *reversal zone* to assess bounce or continuation.
---
📊 *Key Levels:*
- Resistance: 108,800 – 109,200
- Support Zone: 103,000 – 102,000
- Reversal Area: 102,000 – 101,800
---
📌 *Trade Plan:*
- Bearish bias below wedge
- Neutral bias inside wedge
- Bullish if price breaks and holds above wedge top
---
💬 Let me know your thoughts below.
🔁 Like, Comment & Follow for more clean setups!
---
📍This is for educational purposes only. Not financial advice.

May 27 Bitcoin Bybit chart analysisHello
It's a Bitcoinguide.
If you have a "follower"
You can receive comment notifications on real-time travel routes and major sections.
If my analysis is helpful,
Please would like one booster button at the bottom.
This is the NASDAQ 30-minute chart.
There will be an indicator announcement at 11 o'clock.
The daily chart MACD dead cross is in progress.
*When the red finger moves,
it is a long position strategy.
I simply proceeded with the purple finger short -> red finger long switching
or the red finger long waiting strategy.
Today, if possible, it is advantageous for long positions because the weekly chart low point will not be broken even if you just move sideways without touching the gap section.
When the gap section is deviated, I marked the bottom -> section 2 at the bottom
and applied it to Bitcoin as it is.
This is a Bitcoin 30-minute chart.
At the bottom left is the gap retracement section that was performed on the 26th
The purple finger is the entry point for the long position at $108,233.5
It is connected as is.
*When the red finger moves,
It is a long position strategy.
1. After confirming the touch of the first section of the purple finger at the top
109,519.6 long position entry section / cut-off price when the green support line is broken
2. 111,883.3 long position 1st target -> Good 2nd target
Until the additional daily chart is created at 9 am tomorrow
Because the top section of the resistance line of the Bollinger Band daily chart can be a strong adjustment section
You should be careful.
If you touch after 9 o'clock, there is a possibility of additional increase, and
If the strategy is successful, you can use the 1st section indicated at the top as a long re-entry section after the first liquidation of the Top section.
Today, we will focus on long positions,
but it is important whether the main point touches the upper part of Nasdaq first and then
comes down immediately.
If it comes down immediately without touching the 1st section,
the final long waiting strategy is at 108,652.9 dollars in the 2nd section.
If the green support line breaks away, the stop loss price is the same.
Since the mid-term pattern is broken,
if you somehow manage to hold it within the 2nd section today, it is good for the long position.
If it breaks away, check the Bottom -> 3rd section at the bottom,
Since Bitcoin's new high is updated depending on the movement of Nasdaq this week,
it seems that a decline or continuous rise after the double top may be connected.
Up to this point, I ask that you simply use my analysis for reference and use only.
I hope that you operate safely with the principle of trading and cut-off price.
Thank you.

$LDOUSDT Ready to Explode?BINANCE:LDOUSDT is showing strength on the 12H chart, holding firm above the trendline and the 100 EMA, a key confluence zone for bullish continuation.
After a clean bounce from support, the price looks ready to push higher.
If momentum kicks in, we could see a strong move toward the $1.51 level, marking a potential 69% upside from here.
This setup is looking solid, keep it on your radar.
DYRO, NFA

BTC Bull time a little correction to $86.5k or a bit lower is possible
and my prediction is BTC will rise afterwards
maybe to $88.9k
BINANCE:BTCUSDT
COINBASE:BTCUSD
𓄀𝓈𝓉𝒶𝓎 𝓉𝓊𝓃ℯ𝒹 𓃓

Bitcoin 150k is very likely On weekly timeframe bitcoin broke the yellow resistance few weeks ago, now the support on weekly is about 99.6k and resistance about 148k

Btc october 2025 local top?#Bitcoin bull run is not over yet, there is a high probability that we will see a local top by October and also the possibility of the next local bottom in October 2026 is also in the plan.
CRYPTOCAP:BTC

#BTC/USDT#BTC
The price is moving within a descending channel on the 1-hour frame, adhering well to it, and is on its way to breaking it strongly upwards and retesting it.
We are seeing a rebound from the lower boundary of the descending channel, this support at 106792.
We have a downtrend on the RSI indicator that is about to break and retest, supporting the upward trend.
We are looking for stability above the 100 moving average.
Entry price: 107234
First target: 108262
Second target: 109748
Third target: 111298

BITCOIN No different than all the Bullish Legs since 2023!Bitcoin (BTCUSD) has just completed a Golden Cross on the 1D time-frame, the 4th such pattern since February 05 2023. All those Golden Crosses have been formed marginally after the Channel Up bottoms and start of their respective Bullish Legs.
The current pattern is no different than any other of those Bullish Legs. On top of that, the 1W MACD has also formed its usual Bullish Cross that has technically always preceded the 1D Golden Cross.
Given that, when this happens, BTC tends to be at least near the 0.5 Fibonacci level from the eventual top, we can estimate that the next peak might be around $165000. This is another indicator that makes our $150k Target for this Cycle more than realistic.
But what do you think? Are you also expecting the market to explode past $150k? Feel free to let us know in the comments section below!
-------------------------------------------------------------------------------
** Please LIKE 👍, FOLLOW ✅, SHARE 🙌 and COMMENT ✍ if you enjoy this idea! Also share your ideas and charts in the comments section below! This is best way to keep it relevant, support us, keep the content here free and allow the idea to reach as many people as possible. **
-------------------------------------------------------------------------------
💸💸💸💸💸💸
👇 👇 👇 👇 👇 👇

BTC/USDT Technical Analysis and Trade Idea📉 BTC Pullback or Full Reversal? Let's Break It Down 🔍
Looking at the Bitcoin chart right now, we’re seeing more than just a minor pullback. On the 30-minute timeframe, there’s a clear bearish market structure shift setting in. In my opinion, this isn't a quick dip before continuation — we may be in for a deeper retracement. 🧐
When we overlay NASDAQ (which Bitcoin is often closely correlated with), it becomes even clearer — tech stocks look overextended and are showing signs of a potential pullback. 📉
So here’s the plan:
If BTC pulls back into my point of interest, I’ll be watching for a bullish break of structure to consider a long position. Simple, structured, and in line with what the charts are telling us. 🔁💹
⚠️ As always, this is not financial advice — just sharing how I'm reading the market right now.
💬 What are your thoughts? Are you watching the same levels? Drop a comment below 👇 and let’s talk trade setups! 🚀

Is Bitcoin Ready for Its Next Leg Up? Here’s What We Know So FarBitcoin BITSTAMP:BTCUSD is so back — not just back like “we recovered the dip,” but back like “new all-time highs, let’s go shopping for Lambos on moons” back.
If you’ve been following our Top Stories coverage, you’ll know that the OG token vaulted past $109,500 last week, then kissed $111,900 in “Tom Cruise falling off a building” style. Only that there wasn’t a fall to the ground. Instead, Bitcoin prices got stuck near $110,000 and are now waiting for the next catalyst.
Where are we in the cycle? The memes are pumping. Maxis are chest-thumping (this one’s for you, Saylor ). And the market? Well, it’s trying to figure out if this rocket still has fuel, or if we’re hovering at apogee before gravity reminds us it’s still a thing.
Let’s break down what’s really going on — with numbers, context, and just enough forecast to keep it spicy.
🚀 Bitcoin Goes Bionic
Call it what you want — a breakout, a blowoff, or a moonshot — Bitcoin just rewrote the record books. The OG coin is up 48% since its April lows, a run that’s as explosive as it is poetic.
Remember the bearish chants echoing when BTC dipped near $74,000 in early spring? And all those Bitcoin permabears saying it’s all going to zero? Yeah, those are suddenly hard to hear over the rocket engines.
This is the moment Bitcoin believers have been waiting for. Institutional interest continues to show inflows are strong. Adoption is real and making solid progress. And price action is loud — loud enough to drown out the skeptics still quoting tulip bubbles from 1637.
💥 Why the Breakout? A Perfect Storm
Looking at the fundamentals and the technicals — this wasn’t a fluke. It was a perfect cocktail of macro tailwinds, regulatory green lights, and unrelenting digital gold fever.
ETF flows? Exchange-traded funds are collecting record levels of fresh capital — all eleven of them .
Institutional demand? Climbing faster than Saylor can tweet.
Macro backdrop? Soft dollar, muted inflation, and a shiny 90-day trade truce between the US and China paired with one between the US and the EU .
Regulatory mood? A lot less hostile than the Biden administration, with a stablecoin bill clearing the Senate’s procedural vote and Texas passing a law to hold Bitcoin in its reserve fund.
Bitcoin didn’t ride the wave — it was the wave. And with volatility finally working for traders, not against them, the rally gained real traction.
📉 Not All Risk is Behind Us
Now before we start naming stars after Satoshi, let’s pump the brakes (just a little). The flagship crypto might be chilling around $110,000, but this asset class has the emotional range (and discipline) of a toddler. We’ve seen rallies like this before. We’ve also seen how quickly they unravel.
Upcoming economic data could throw a wrench in the gears. Here’s what to watch for this week:
Wednesday: Fed minutes
Thursday: GDP figures
Friday: Core PCE inflation
Any surprises here — especially hotter-than-expected inflation or hawkish Fed sentiment — could rattle the risk-on party. Bitcoin loves liquidity. If the Fed hints at tightening, the rocket might need to refuel mid-air.
🧭 Key Levels to Watch
Technically, the $111,900 print is your short-term ceiling. It’s the new line in the sand — the price everyone’s watching, waiting for a clean break or a hard rejection.
On the downside, $105,000–$106,000 is developing as support. Break that, and $100,000 becomes the psychological safety net. Below that? Well, let’s not talk about it unless we have to.
Until then, price is consolidating. Think of it like a pit stop — a chance for bulls to breathe, for bears to panic quietly, and for traders to argue about Fibonacci levels.
🛰️ Is $120K Next? Or Is This the Top?
But let’s dig into it a little bit. The real question is whether this rally still has legs. Some traders are calling $120,000 a “magnet level.” Others are treating current prices like the top and selling into strength.
The answer? Probably both.
Momentum is still there — just cooled off a bit. Volume’s down slightly. Social buzz is still high up there. The market’s in a classic “wait-and-see” phase, prepping for a bigger move in either direction.
What could break the stalemate?
A blockbuster inflation report (bullish if soft).
Another policy win from Washington.
Or the most powerful force of all: a dovish stance from the man who moves markets with a simple “Good afternoon” (bonus points if you guess who that is!)
📢 Final Word: Celebrate, But Stay Sharp
If you’ve been long since the dip, this is your moment. Pop some virtual (or real?) champagne. Screenshot that green PnL. Post a gif of Elon and Trump dancing.
But if you’re entering now, zoom out. Yes, momentum is bullish. Yes, fundamentals are stronger than ever. But Bitcoin doesn’t do straight lines for long. And your stop-loss isn’t going to set itself.
Whether $120K is next or we pull back to reset, the next few sessions will be crucial.
Your move : Are you buying this breakout? Waiting for confirmation? Or just enjoying the view from orbit? Let us know how you’re playing this Bitcoin beast — because one thing’s certain: it’s never boring up here.

Bitcoin & Stock Market Rally Together .. My Trade Plan!🚨 Bitcoin Update! 🚨
Taking a look at the BTC chart 🧠📈 — we saw a sharp retracement followed by a strong rally 💥🔥, likely driven by recent tariff policy shifts 🌍📊.
Right now, I’m leaning bullish 🐂 — especially with the stock markets also pushing higher 📈💹. But let’s be clear: my bullish bias depends on the stock market holding strong 🛡️📊.
I’m keeping an eye out for a pullback to the 61.8% Fibonacci level 🌀 for a potential buy opportunity 💸🚀.
⚠️ This is not financial advice — just sharing my outlook!
👇 Let me know what you think in the comments!

#BTC/USD The Uptrend is still intact! Here's Why!BTC Daily Close Update
Bitcoin closed at $108,951, marking another failed attempt to break through the $111K resistance.
It’s been nearly 8 days of consolidation just below this level. That’s not ideal, and it signals we may need a fresh catalyst to push higher.
Not bearish, just cautious.
As long as the blue EMA holds on the daily, the uptrend remains intact.
Still watching for a move toward $117K.
DYOR, NFA
Please show your support with your likes.
Thank you
#PEACE
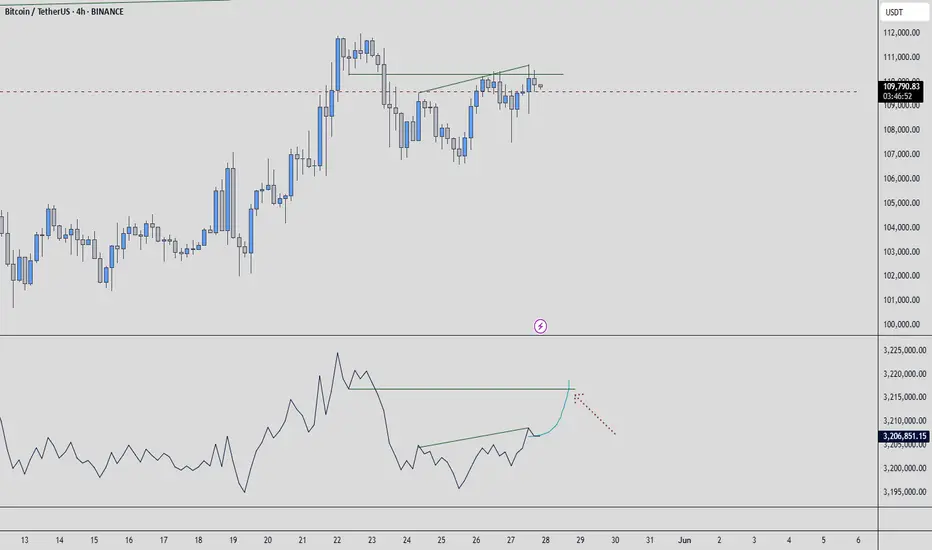
$BTC Liquidity Squeeze Incoming – Breakout or Breakdown?#Bitcoin
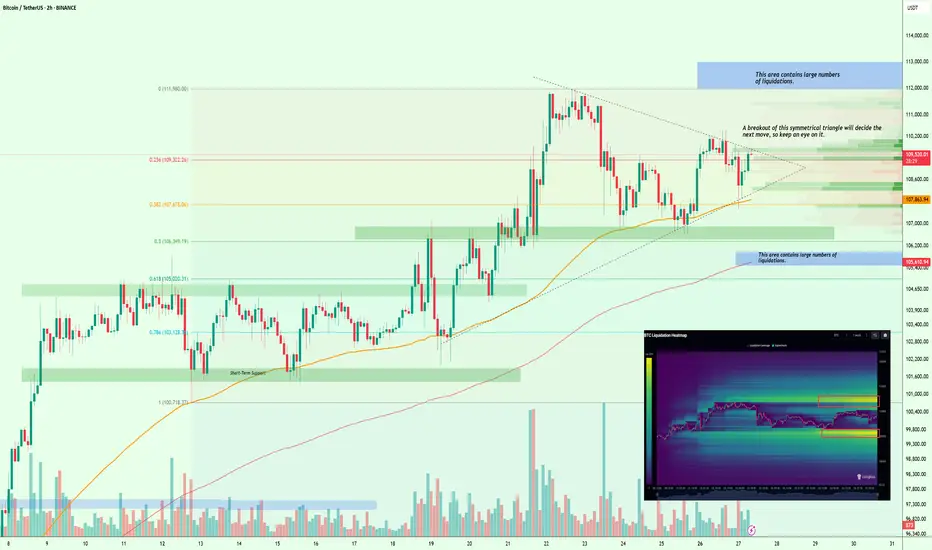
According to the liquidation heat map, CRYPTOCAP:BTC is building a large cluster of liquidations on both the upside and downside, creating some confusion in the market. However, the nearest major liquidation zone is around $112K–$113K, which increases the chances of a move toward that range.
Technically, BTC is forming a symmetrical triangle, and the breakout from this pattern will likely determine the next major move.
So keep a close eye on it.
I’ll keep you posted as things unfold.
If you find my updates helpful, don’t forget to like and follow for more!
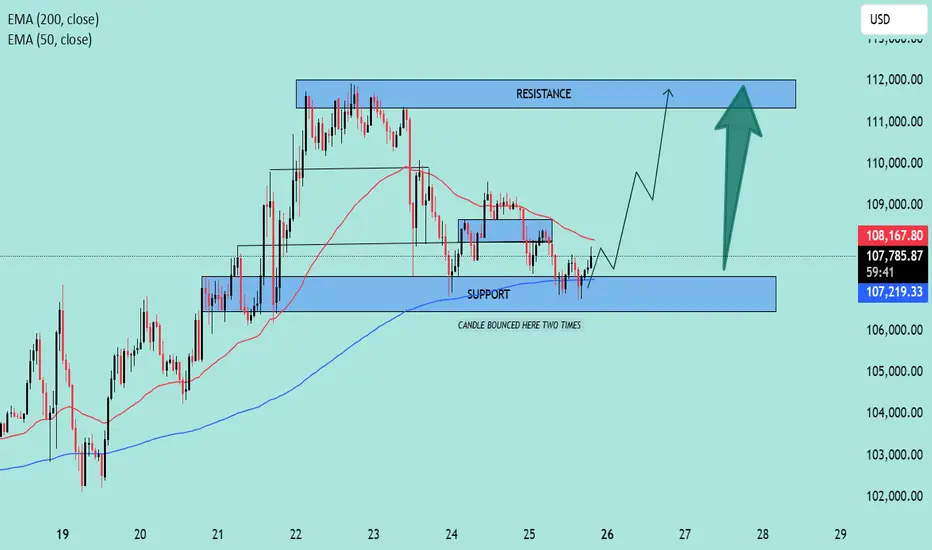
BTC/USD Rebound in Play! | Key Support Holding, Eyes on $112K📊 BTC/USD Technical Analysis
🗓️ Chart Date: May 25, 2025
🔍 Key Levels:
🔵 Support Zone: $106,800 – $107,300
Notably, price bounced twice in this region, indicating strong buying interest.
This area aligns closely with the 200 EMA (currently at $107,213.51), adding further confluence as dynamic support.
🔴 Resistance Zone: $111,800 – $112,300
Previous highs and consolidation make this a significant area where sellers may re-enter the market.
📈 Indicators:
🔵 EMA 200 (Blue): $107,213.51
Acts as a strong dynamic support; price bounced off it recently.
🔴 EMA 50 (Red): $108,182.91
Price is currently below the 50 EMA, suggesting short-term bearish pressure remains until this level is reclaimed.
🧠 Market Structure & Price Action:
After a sharp drop from the resistance zone, price found solid footing at the support zone.
Recent candles show rejection wicks from the downside, hinting at potential bullish reversal.
A breakout above minor consolidation and 50 EMA could trigger a bullish continuation toward the resistance.
📌 Forecast:
✅ If the price holds above the support zone and breaks above $108,200, we can expect a bullish move toward $112,000.
⚠️ However, a failure to break above the 50 EMA could lead to a retest of the support zone.
🧭 Trade Idea (Not Financial Advice):
📥 Long Bias:
Entry: On confirmed breakout above $108,200
SL: Below $107,000
TP: $111,800 – $112,300
📌 Conclusion:
The chart setup suggests a potential bullish reversal 📈 from a key support zone, supported by EMA 200. Watch for a break above the 50 EMA for momentum confirmation.
🧠 Always confirm with volume and wait for confirmation before entering a position.
BTCUSDT | No Rejection Yet, Higher Targets in SightThe current price action is still leaning bullish. We haven’t seen a sharp rejection or breakdown from key structure — and until that happens, I expect the move to stretch toward the 107,600 region.
Volume remains consistent, and there’s subtle support in the lower timeframes. Buyers are holding their ground, and as long as that continues, the path of least resistance remains up.
Wait for price to disprove the idea before abandoning it. That’s how you stay ahead.
📌I keep my charts clean and simple because I believe clarity leads to better decisions.
📌My approach is built on years of experience and a solid track record. I don’t claim to know it all but I’m confident in my ability to spot high-probability setups.
📌If you would like to learn how to use the heatmap, cumulative volume delta and volume footprint techniques that I use below to determine very accurate demand regions, you can send me a private message. I help anyone who wants it completely free of charge.
🔑I have a long list of my proven technique below:
🎯 ZENUSDT.P: Patience & Profitability | %230 Reaction from the Sniper Entry
🐶 DOGEUSDT.P: Next Move
🎨 RENDERUSDT.P: Opportunity of the Month
💎 ETHUSDT.P: Where to Retrace
🟢 BNBUSDT.P: Potential Surge
📊 BTC Dominance: Reaction Zone
🌊 WAVESUSDT.P: Demand Zone Potential
🟣 UNIUSDT.P: Long-Term Trade
🔵 XRPUSDT.P: Entry Zones
🔗 LINKUSDT.P: Follow The River
📈 BTCUSDT.P: Two Key Demand Zones
🟩 POLUSDT: Bullish Momentum
🌟 PENDLEUSDT.P: Where Opportunity Meets Precision
🔥 BTCUSDT.P: Liquidation of Highly Leveraged Longs
🌊 SOLUSDT.P: SOL's Dip - Your Opportunity
🐸 1000PEPEUSDT.P: Prime Bounce Zone Unlocked
🚀 ETHUSDT.P: Set to Explode - Don't Miss This Game Changer
🤖 IQUSDT: Smart Plan
⚡️ PONDUSDT: A Trade Not Taken Is Better Than a Losing One
💼 STMXUSDT: 2 Buying Areas
🐢 TURBOUSDT: Buy Zones and Buyer Presence
🌍 ICPUSDT.P: Massive Upside Potential | Check the Trade Update For Seeing Results
🟠 IDEXUSDT: Spot Buy Area | %26 Profit if You Trade with MSB
📌 USUALUSDT: Buyers Are Active + %70 Profit in Total
🌟 FORTHUSDT: Sniper Entry +%26 Reaction
🐳 QKCUSDT: Sniper Entry +%57 Reaction
📊 BTC.D: Retest of Key Area Highly Likely
📊 XNOUSDT %80 Reaction with a Simple Blue Box!
📊 BELUSDT Amazing %120 Reaction!
📊 Simple Red Box, Extraordinary Results
📊 TIAUSDT | Still No Buyers—Maintaining a Bearish Outlook
📊 OGNUSDT | One of Today’s Highest Volume Gainers – +32.44%
I stopped adding to the list because it's kinda tiring to add 5-10 charts in every move but you can check my profile and see that it goes on..
Bitcoin: Will it surpass $109k in its upward trend?Since April, Bitcoin has traded in a clearly defined upward channel with two lower and upper trend lines. This channel was formed three touchpoints both on the lower and upper trendlines.
Near a critical zone
Now, BTC is at a key resistance zone where it previously peaked around $109,000, holding its all-time high. This level resists both judgement as well as forensic level significantly of a psychological barrier because it was the peak of the last major bull cycle. The price is currently hovering around the everyday resistance line while BTC is still in the upward channel. In conjunction with the historic all-time high and the upper channel resistance, range bound price action gives us an accurate capture of BTC’s behaviour.
Bullish breakout
The scenario outlined for this resistance zone makes the most sense as a rejection may lead to a temporary pullback, likely to the somewhat lower boundary of the rising channel. This in itself would not be the termination of the bullish trend, but instead a healthy retracement within the confines of an uptrend structure. But, if the market does break out above the $109,000 level with ample volume and bullish momentum, then things could start changing in the market for the better from there. Such breakout will confirm the uptrend is strong and valid where else new breakout targets will also be set turning the old high into new low. The $109,000 level would then probably move from resistance to support, making it a critical area for bulls to protect on any retests in the future.
A bearish breakout
The ramifications of a breakdown below the rising channel should also be understood by traders. It is crucial to keep an eye on the channel's lower barrier, which is presently at about $104,000. A significant decline below this level would signal a loss of short-term bullish momentum and lead to a more thorough correction. In that scenario, Bitcoin would probably go for the imbalanced area between $97,500 and $100,500, where the price has previously moved quickly without forming any solid support or resistance. Buyers may be able to intervene in this zone and try to restore bullish dominance, which may pave the way for a new breakout attempt and another surge toward the $109,000 barrier.
Conclusion
In conclusion, Bitcoin is at a critical point right now. Bitcoin is currently facing a significant resistance zone at its prior all-time high, but the upward channel that has directed price action since April is still in place. The degree of market momentum and the actions of buyers and sellers at these critical levels will determine whether the price hits new highs or declines. Investors and traders should be alert and ready for both situations since the next action could determine how Bitcoin develops over the following few weeks.
I appreciate your help.
To ensure you do not miss the upcoming analysis, be sure to follow me!
Please leave a remark and a like!
