BTCUSD UPDATE : 27- 5 - 2025This chart shows a 1-hour time frame for Bitcoin (BTC/USD) on Bitstamp, with technical analysis indicating a potential bearish move. Here’s a breakdown of the chart:
Price Range: The chart highlights a trading range between approximately $102,714 (support) and $112,053 (resistance), marked with yellow zones.
Current Price: BTC is trading around $109,026.
Bearish Signal: A blue arrow points downward, suggesting an anticipated drop in price.
Pattern Suggestion: It looks like a potential double top or lower high is forming, signaling weakening bullish momentum.
Target Zone: The arrow points towards the support zone around $102,714, implying that the chartist expects BTC to fall to that level.
This type of analysis is often used for short-term trades and may involve setting stop-losses near $112,053 and profit targets near $102,714. Let me know if you'd like help interpreting this pattern further or backtesting the setup.
1-BTCUSD

Short-Term BTC Scalping Opportunity⚡Say less
💥Setup and forget
💥the position is off if price hits 111,959 first.
💥leverage maybe used according to your risk management

BTC weekly Weekly log chart on BTC looks ready for price discovery following bullish consolidation. If this setup plays out like the prior major breakouts, we're gonna see some new ATHs soon.


GBPAUD…being the best is a mindset!!Good day traders, I am back again with another great setup and again another opportunity to learn something new.
On the daily TF on GBpAUD we still in a bearish structure and if we use the 2022 model, we had a structure shift lower and now that price is retesting the OTE entry levels we can now expect price to shoot lower, before you asked about the recent FVG on 4H TF. That newly formed BISI is that candle that created the BPR and from what I’ve learned is that price normally shoots past BPR’s.
My poll of liquidity is resting below(weekly), that Ray line makes weekly represents previous week’s low which we want to see the market get to. Just on top of that ray line we have a FVG that price left open, we also wanna see price fill that FVG fully.

$BTC to $120K?Bitcoin is still moving strongly inside the ascending channel, respecting both support and midline zones.
After bouncing from the lower boundary and holding above key horizontal support at $104.8K, BTC is showing signs of strength again.
With the trend intact and momentum building, a breakout toward the $116k 120k supply zone looks likely in the coming days.
Bulls remain in control as long as price holds above the mid channel and key FVG (Fair Value Gap) areas.
Watch the channel closely for confirmation.
DYRO, NFA

BTCUSD: Urgently needs to break above this trendline!Bitcoin is bullish on its 1D technical outlook (RSI = 65.624, MACD = 4011.100, ADX = 25.476) but not overbought anymore as the aggressive weekly rallies since the 1W MA50 rebound have been decelerated. The next heavy obstacle is the HH trendline that runs on top of the January 20th 2025 and December 16th 2024 Highs and got hit last week. So far the price hasn't crossed above it but it needs to urgently in order to avoid a rejection with snowball effects.
The last time Bitcoin faced a similar HH trendline Resistance was on the October 23rd 2023 1W candle and it succesfully smashed through it, completing a +79.23% rise before consolidating again. If it breaks again above it, we expect the same minimum rally, which gives us a TP = 133,500.
## If you like our free content follow our profile to get more daily ideas. ##
## Comments and likes are greatly appreciated. ##

Bitcoin - This time different ?In 2021-22 bitcoin formed a higher high on weekly chart and then bear run of 2022 started, if we look at the bitcoin current chart the same pattern being formed.
Do you think bitcoin will form the similar pattern ? In my opinion it is highly unlikely that bitcoin will see similar pattern, in 2022 the second push was due to overall market euphoria which pushed the price to new high even though bear market was already on (Bitcoin hit new ATH after crashing 55% which is unusual)
If we look at the current pattern bitcoin had -30% crash, which is normal between bull runs, so its highly unlikely that bitcoin will similar fate as 2021.
Follow Our TradingView Account for More Technical Analysis Updates, | Like, Share and Comment Your thoughts.
Cheers
GreenCrypto

Bitcoin : Impulse up or Flat Trap!?If you find this information inspiring/helpful, please consider a boost and follow! Any questions or comments, please leave a comment!
BTC has staged a solid move off the May 25 low — but the context matters. We’re facing two distinct, high-stakes scenarios here: one bullish, one bearish. What happens next hinges on whether the May 25 rally is the start of a new impulse or the final leg (C wave) of an expanded flat off the all-time high.
Structure Breakdown
Bearish View: We’re completing a textbook expanded flat from the ATH:
A wave started May 23
B wave pushed to a lower low.
C wave began May 25 and is likely wrapping up now
If valid, this sets the stage for a powerful Wave 3 down.
Bullish View: The May 25 low marked the end of a corrective phase:
Rally from that low is an impulsive Wave 1
A pullback to the 108k golden zone would represent Wave 2
Wave 3/C up could follow from that base
What to Watch
The area around 108,000–107,100 is a magnet. If price retraces into this zone with a corrective look and holds, bulls could be in control. But if we roll over hard from here, it supports the expanded flat thesis — and a much deeper move likely follows.
Outlook
This is a moment for sharpen focus. The chart structure is clean, but the outcome isn't binary until we see what kind of retrace (if any) forms.
Watch 108k like a hawk. If bulls defend it, there’s room to talk new highs. If we break impulsively from here, expect acceleration lower — fast.
Trade safe, trade smart, trade clarity.

BTC in Bullish Channel – Another HH Coming ?Bitcoin continues to respect this ascending channel with clear Higher Highs (HH) and Higher Lows (HL).
Every breakout has followed consolidation and pullback patterns. RSI is neutral a breakout above $110K+ could confirm the next HH.
Watching for a move toward the top of the channel... or a deeper HL retest?
What's your take?

Bitcoin - Approaching the all time high!Bitcoin - CRYPTO:BTCUSD - will break out again:
(click chart above to see the in depth analysis👆🏻)
It has been quite some time since we saw such a strong move on Bitcoin. But finally - not totally unexpected to be honest - Bitcoin is following its destiny and about to create another new all time high. Patience is key and strategy, risk and mindset will help you master the volatility.
Levels to watch: $100.000
Keep your long term vision!
Philip (BasicTrading)

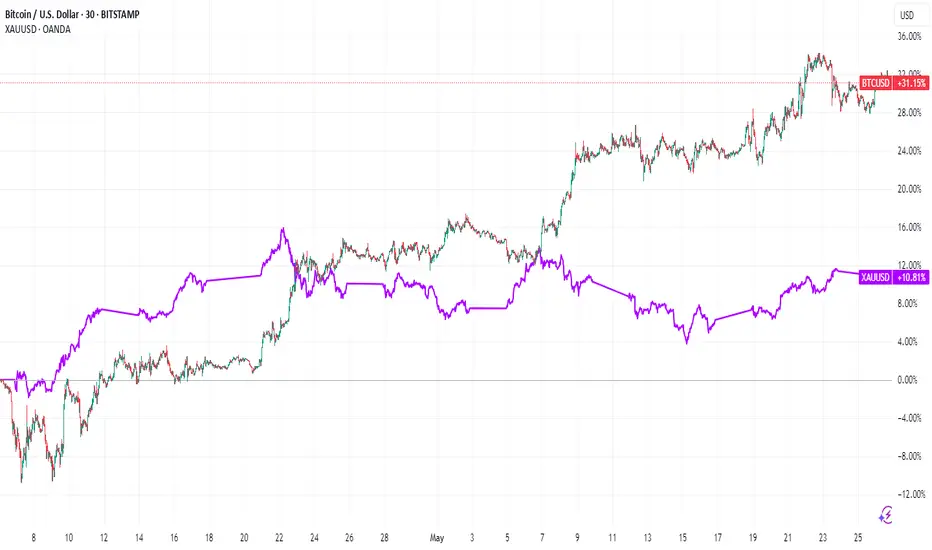
Bitcoin vs. Gold: Central Banks Pick Gold (Here's Why)
The debate over the ultimate store of value has been reignited in the digital age. For centuries, gold, the immutable yellow metal, has been the bedrock of wealth preservation, the trusted haven in times of turmoil, and a core component of central bank reserves. In the last decade, a new contender has emerged: Bitcoin, the pioneering cryptocurrency, often touted as "digital gold." Yet, as the dust settles on initial exuberance and institutional scrutiny intensifies, a clear preference is emerging from the world's most conservative financial institutions. Central banks, the guardians of national wealth and financial stability, are overwhelmingly demonstrating their continued faith in gold, signaling that when it comes to the ultimate safe reserve, tradition and tangibility still trump technological novelty.
The evidence for this preference is not merely anecdotal; it's etched in the consistent and accelerating trend of global gold accumulation by these institutions. In recent years, central banks have been on a gold buying spree, a phenomenon driven by a confluence of potent global factors. The shifting geopolitical landscape, characterized by increased tensions, trade disputes, and a move towards a more multipolar world, has spurred a desire for assets that are not tied to any single nation's political or economic fortunes. Policies emanating from major economic powers, including periods of heightened trade protectionism and shifting global alliances, have historically fanned uncertainty, prompting a flight to assets perceived as universally valuable and politically neutral – a role gold has fulfilled for millennia.
Furthermore, concerns over the long-term value of major fiat currencies, particularly the U.S. dollar which has long dominated global reserves, are playing a significant role. Persistent fiscal deficits, expanding sovereign debt levels, and unprecedented monetary stimulus measures in various countries have led to an undercurrent of apprehension about potential currency devaluation. In such an environment, central banks are actively seeking to diversify their holdings and hedge against the erosion of purchasing power. Gold, with its intrinsic value and finite supply, offers a compelling alternative to holding ever-increasing amounts of fiat currency, whose value can be diluted by policy decisions. This strategic de-dollarization, or at least a diversification away from dollar-centric reserves, sees gold as a primary beneficiary. It is a tangible asset that sits outside the traditional financial system, offering a layer of insulation from the counterparty risks inherent in holding other nations' currencies or debt.
In stark contrast to this institutional embrace of gold stands Bitcoin. While proponents champion its decentralized nature, its mathematically enforced scarcity, and its potential as an inflation hedge, its inherent characteristics currently make it a challenging proposition for central bank reserves. The most glaring issue is its extreme volatility. Bitcoin's price history is a rollercoaster of meteoric rises and precipitous falls. For an individual retail investor, this volatility might be a tolerable, even attractive, risk in pursuit of outsized returns. However, for a central bank, whose primary mandate includes capital preservation and maintaining financial stability, such wild price swings are anathema. Reserve assets must be relatively stable, liquid, and dependable. Bitcoin, in its current state, struggles to meet these criteria consistently. A significant allocation to Bitcoin could expose a nation's reserves to sudden and substantial losses, undermining public trust and potentially destabilizing its financial position.
This volatility poses a tangible risk, not just theoretically, but as observed in the experiences of investors globally, including those in the U.S. While some have reaped fortunes, many others have faced considerable losses due to ill-timed investments or the market's unpredictable nature. Institutional investors, including those in the U.S., while showing increasing interest in Bitcoin as a speculative asset class or a small part of a diversified portfolio, still largely treat it with caution. The kind of deep, unwavering institutional trust that gold commands – built over centuries of proven performance as a store of value and a crisis hedge – has yet to be earned by Bitcoin. Gold’s market is deep, liquid, and well-understood, with established clearing and settlement mechanisms. Bitcoin's market infrastructure, while maturing, is still relatively nascent and fragmented compared to the centuries-old gold market.
Beyond volatility, other factors hinder Bitcoin's adoption as a mainstream reserve asset for central banks. Regulatory uncertainty remains a significant hurdle. The global regulatory landscape for cryptocurrencies is a patchwork of differing approaches, with some nations embracing innovation while others impose strict controls or outright bans. For central banks, which operate within stringent legal and regulatory frameworks, this lack of global consensus and clarity is a major deterrent. The operational risks associated with custody and security of digital assets at a sovereign scale are also non-trivial. While blockchain technology is inherently secure, managing private keys for billions of dollars' worth of Bitcoin requires sophisticated and untested protocols for institutions of this nature.
Furthermore, the narrative of Bitcoin as "digital gold" sometimes overlooks fundamental differences. Gold is a physical commodity with diverse industrial and cultural uses, providing a baseline of demand beyond its monetary role. It is universally recognized and accepted, transcending technological barriers. Bitcoin’s value is derived primarily from its network effects, its code, and investor belief in its future utility and adoption. While powerful, these are different underpinnings than the tangible reality of physical gold bullion held in a central bank's vault.
The actions of central banks speak volumes. While a handful of smaller nations or entities might experiment with Bitcoin, the overwhelming majority of major central banks, those that collectively manage the bulk of global reserves, have either remained silent on Bitcoin or have issued cautious warnings, all while steadily increasing their physical gold holdings. This isn't to say that Bitcoin has no future role or value. It may well continue to evolve as a speculative asset, a niche store of value for some, or a technology platform for new financial applications. However, the idea that it is poised to usurp gold's position in the vaults of central banks appears premature, if not fundamentally misguided, given its current attributes.
In conclusion, the debate between Bitcoin and gold as the preferred store of value and reserve asset has a clear, if perhaps unexciting, winner in the eyes of the world's central banks. Faced with geopolitical instability, the specter of dollar devaluation, and the enduring need for reliable safe-haven assets, these institutions are doubling down on gold. Its long history, proven stability, tangibility, and lack of counterparty risk resonate deeply with their conservative mandates. Bitcoin's volatility, regulatory ambiguity, and operational complexities, while potentially surmountable in the distant future, currently render it unsuitable for the core reserve holdings of nations. While U.S. investors and others may grapple with Bitcoin's risk-reward profile, central banks have largely made their choice, and that choice, for now and the foreseeable future, remains firmly with the ancient, trusted allure of gold.
$BTC – Breaking Out of the Pattern?📈 Bitcoin ( CRYPTOCAP:BTC ) is testing the upper resistance zone of a multi-month structure.
✅ Break of Structure (BOS) has already occurred, adding fuel to the bullish case.
🚀 Just a bit more upside and CRYPTOCAP:BTC could escape this consolidation pattern completely.
Key levels to watch:
Break above ~$110K area
Green trendline remains strong support
Eyes on higher timeframe close to confirm breakout
This could be a pivot point for Bitcoin’s next leg higher — or a trap if sellers step in hard.

BTC Crypto Futures Trade Plan 2025-05-26BTC Crypto Analysis Summary (2025-05-26)
Comprehensive Summary of Each Model
Grok/xAI Report
BTC at $109,553, trading above all major MAs (20/50/200 SMAs, 9/21 EMAs) → strong bullish trend RSI 67.02 (approaching overbought), MACD positive but slight bearish divergence Volume declining → possible consolidation or reduced buying interest Funding rate low (0.0002%) → not overleveraged long Trade suggested: long at $110,000, SL $107,000, TP1 $113,000, TP2 $115,000, size 1% equity, confidence 80%
Claude/Anthropic Report
Confirms price above all key MAs, RSI approaching overbought, MACD divergence Price near upper Bollinger Band → resistance Concludes short-term momentum weakening → moderately bearish bias Recommends no trade (confidence 72%), waits for break above $111,800 or below $105,000
Llama/Meta Report
Bullish MA alignment, RSI slightly overbought, price near upper BB Funding rate neutral, sentiment generally positive Trade suggested: long on pullback to SMA20 at $105,295.59, SL $103,000, TP $110,000, size = 2–3% equity, confidence 80%
Gemini/Google Report
Strong bullish trend (EMA9 > EMA21 > SMA20 > SMA50 > SMA200), RSI 67, BB upper ~$111,724 MACD bearish crossover → potential short-term pullback Recommends long at ~$109,550, SL $107,700, TP $113,100, size 1 BTC, confidence 75%
DeepSeek Report
Price near upper Bollinger Band, MACD bearish crossover, RSI divergence Countertrend short trade: entry $109,553, SL $111,725, TP $105,295, size 1 BTC, confidence 75% Areas of Agreement and Disagreement
Agreement
BTC is in a strong uptrend, trading above all major moving averages RSI ~67 suggests rising momentum but nearing overbought MACD shows a bearish divergence or crossover, warning of short-term momentum loss Price is close to the upper Bollinger Band → stretched conditions
Disagreement
Directional bias: Grok, Llama, and Gemini bullish; Claude is cautious/no-trade; DeepSeek bearish countertrend Entry levels: ranges from pullbacks to 105k (Llama) to market price ~109.55k (Gemini/Grok) Risk appetite: varying leverage and position-sizing recommendations Trade/no-trade: Claude advises holding; others recommend active positions Conclusion and Trade Recommendation
Overall Market Direction Consensus
Moderately Bullish: the dominant trend is up, supported by MA structure and recent performance, despite short-term momentum warnings.
Recommended Trade
Direction: Long BTC futures Entry Range: Near current market (109,500–109,600) or immediate retest of EMA9 (~109,550) Stop Loss: 107,700 (below EMA9 and minor support) Take Profit: 113,100 (just above recent swing highs/upper BB) Position Size: 1 BTC (adjust per account to risk ~1–2%) Confidence Level: 78%
Key Risks and Considerations
Momentum Divergence: MACD bearish crossover and RSI near overbought may trigger a pullback Volatility Spikes: leverage can amplify slippage and liquidation risk Broader Crypto Moves: altcoin correlation or market-wide news can quickly shift prices Funding Rate Shifts: a sudden spike could accelerate long-side liquidations
TRADE_DETAILS (JSON Format) { "instrument": "BTC", "direction": "long", "entry_price": 109550.0, "stop_loss": 107700.0, "take_profit": 113100.0, "size": 1, "confidence": 0.78, "entry_timing": "market_open" }
📊 TRADE DETAILS 📊 🎯 Instrument: BTC 📈 Direction: LONG 💰 Entry Price: 109550.0 🛑 Stop Loss: 107700.0 🎯 Take Profit: 113100.0 📊 Size: 1 💪 Confidence: 78% ⏰ Entry Timing: market_open
Disclaimer: This newsletter is not trading or investment advice but for general informational purposes only. This newsletter represents my personal opinions based on proprietary research which I am sharing publicly as my personal blog. Futures, stocks, and options trading of any kind involves a lot of risk. No guarantee of any profit whatsoever is made. In fact, you may lose everything you have. So be very careful. I guarantee no profit whatsoever, You assume the entire cost and risk of any trading or investing activities you choose to undertake. You are solely responsible for making your own investment decisions. Owners/authors of this newsletter, its representatives, its principals, its moderators, and its members, are NOT registered as securities broker-dealers or investment advisors either with the U.S. Securities and Exchange Commission, CFTC, or with any other securities/regulatory authority. Consult with a registered investment advisor, broker-dealer, and/or financial advisor. By reading and using this newsletter or any of my publications, you are agreeing to these terms. Any screenshots used here are courtesy of TradingView. I am just an end user with no affiliations with them. Information and quotes shared in this blog can be 100% wrong. Markets are risky and can go to 0 at any time. Furthermore, you will not share or copy any content in this blog as it is the authors' IP. By reading this blog, you accept these terms of conditions and acknowledge I am sharing this blog as my personal trading journal, nothing more.


bitcoin on bearish#BTCUSD price have shown reverse trend which will drop below 106k.
Firstly we await for drop below 109300 for sell, Target 106k, SL 110151
But if prices move above 110151 Firstly then it will reach 110747 which will decline to head bearish.
Bullish is not valid yet.
#BTC

26/05/25 Weekly OutlookLast weeks high: $111,965.73
Last weeks low: $101,994.78
Midpoint: $106,980.26
New BTC ATHs! Well done to those who capitalized on the move and continue to believe in this Bitcoin.
For the last two weekly outlooks I have talked about the pattern of consolidation for 1 week --> expansion the next. Last week We got our expansion week right on queue and this time around BTC made a new ATH hitting just shy of $112,000.
Should the pattern continue this week will be a week of consolidation/chop, however this week is different now that we're at ATH levels. My gut says a pullback is coming after such an aggressive move up with almost no pullbacks at all.
Should BTCs price drop below the Midpoint I think there will be a big struggle to continue this rally in the short term. Initially target would be weekly low and main HTF target would be $97,000 IMO. That would be a healthy pullback to continue the rally.
For the bulls you don't want momentum to stop in the short term, flipping $110,450 and weekly high would put BTC back into price discovery, once any asset is in price discovery it's very difficult to tell where the sell pressure will come from and so shorting becomes very risky.

Daily BTC OverviewThe daily chart in its simplest form can be broken down into this range. Since President Trumps inauguration, BTC has declined from a range high of $108,000 back to the lows of $74,500 closing the FVG caused by the US election rally. After a double bottom Bitcoin mean reverted back to the range midpoint which to me is the most important area on the entire chart because it decides if the bull run can continue or if it dies.
I like to keep a close eye on the 200 EMA on multiple timeframes but the 1D is important to gauge the momentum of the move. As the US election results came in a massive push away from this moving average causes the level to steepen in its climb showing strength. Since BTC spent quite some time in the top half of the range the 1D 200 EMA flattens out signaling a loss of momentum, once this level does become flat it no longer provides support. For a bullish cycle to be just that ideally the corrective moves do not spend too much time below this level before expanding above and beyond it once again starting the next leg of the move. A persistent move down below causes a rollover and the cycle looks to be over with a bear market beginning.
Bullish scenario - The correction is over and BTC consistently posts HH's & HLs bringing the 1D 200 EMA up with price and continues the previous bullish trend. I would want to see the retest of the midpoint be successful and then move to reclaim the next local high before targeting range high. The bull market correction looks to be over and bullish continuation resumes.
Bearish scenario - This move is nothing more than a LH, BTC wicks the supply above midpoint, swing fails back under and continues to make LH's & LL's back down to range low where the 1D 200EMA will have now rolled over providing more of a resistance level. The bear market looks to have begun.
I am not here to make a call on where BTC is going next as I do not have that answer, but I do have to plan for each eventuality and that is what I have done here from a TA pint of view. Now it is entirely possible that Geo-political news or an exchange hack etc throws TA out of the window and I have to rethink the plan but in a strictly chart structure perspective this is how I see it.
The indicator "TRADING ENVIRONMENT+V1.0" used in the Idea post is now publicly available for use, give it a try and leave your thoughts and suggestions on the post, thank you.

May 23 Bitcoin Bybit chart analysisHello
It's a Bitcoinguide.
If you have a "follower"
You can receive comment notifications on real-time travel routes and major sections.
If my analysis is helpful,
Please would like one booster button at the bottom.
Here is the Bitcoin 30-minute chart.
There will be a Nasdaq indicator announcement at 11 o'clock in a little while.
Yesterday was also a sideways market with no movement,
and the participation rate was low, so I will leave it as a brief analysis.
In the case of Nasdaq, today's daily chart MACD dead cross pressure
so I judged that a vertical rise would be difficult.
I made today's strategy based on the high possibility of a sideways move.
In the upper left corner, from the analysis article on the 22nd,
I moved the 1st section / 111,426.6 dollars as it is with a purple finger.
*Red finger movement path
One-way long position strategy
1. 109,917.6 dollars long position entry section / green support line breakout stop loss price
Since the 4-hour chart MACD dead cross pressure is in progress
Based on the 1+4 pattern,
At least 2 additional 4-hour candles are created
I think there will be a long position wait after 1:30 p.m.
2. Top section 113,701.9 dollars long position 1st target -> Good 2nd target
If it breaks through the orange resistance line at the top
It can be connected to a vertical rise,
So if you were short yesterday or are going to challenge today,
Use it as a stop loss price, but be careful.
If it goes up within the purple support line after 1->2 or after touching 2 times,
It can be a vertical rise or a strong rise.
At the bottom, Bottom -> 3 times -> 106982.3 dollars
I marked the support line.
In case of a strong rise over the weekend,
Good is the Great section hidden picture search.
Up to this point, I ask that you simply use my analysis for reference and use,
and I hope that you operate safely with principle trading and stop loss prices.
Thank you for your hard work this week.
Thank you.

Bitcoin to 140k - 170k (26MAY2025)On monthly timeframe we have few trendlines which show us, 140 to $170,000 is likely according to the 100% of Fibonacci Extension as well, but above that is unlikely IMO.

BITCOIN $119k coming shortlyBitcoin (BTCUSD) has been trading within a 6-week Channel Up and Friday's tariff threats led pull-back was its latest Bearish Leg. That pull-back hit the 4H MA50 (blue trend-line) yesterday and rebounded. As long as the 4H MA100 (green trend-line) which is directly below the Channel Up holds, the current rebound is technically the pattern's new Bullish Leg.
All 4 previous Bullish Legs have ended on fairly similar % rises but the weakest has been +11.41%. With the 4H MACD just now completing a Bullish Cross (which has always been a strong buy signal), a repeat of the +11.41% minimum, gives us an immediate $119000 Target.
Do you think that's coming shortly before the beginning of June? Feel free to let us know in the comments section below!
-------------------------------------------------------------------------------
** Please LIKE 👍, FOLLOW ✅, SHARE 🙌 and COMMENT ✍ if you enjoy this idea! Also share your ideas and charts in the comments section below! This is best way to keep it relevant, support us, keep the content here free and allow the idea to reach as many people as possible. **
-------------------------------------------------------------------------------
💸💸💸💸💸💸
👇 👇 👇 👇 👇 👇

Bitcoin (BTC/USD) Bullish Breakout – Targeting $116K Using MMCBitcoin has printed one of the most powerful continuation setups in technical analysis — a Bullish Pennant — and it's playing out beautifully, backed by Mirror Market Concepts (MMC). Let's break down the structure, the reasoning behind this move, and how smart money could be driving this price action.
📈 1. Market Context – The Impulsive Rally That Set the Stage
The first thing to notice is the strong bullish move that occurred before the pennant started forming. This rally is important because a Bullish Pennant is a continuation pattern, and without a strong preceding trend, the pattern loses its credibility.
This initial move acts as the “pole” of the pennant — a clean, impulsive leg upward, driven by demand and momentum.
Such moves are often the result of strong buying from institutions, retail FOMO, or positive macroeconomic catalysts.
🧠 Psychology Insight: The rally injects confidence into the market. Buyers who missed the move now wait for a pullback, while early buyers prepare to scale in on continuation.
🔺 2. Bullish Pennant Structure – The Calm Before the Next Storm
After the bullish pole, the price enters a tight consolidation phase, forming a symmetrical triangle:
Lower highs and higher lows compress price into a pennant shape.
Volume usually declines during this phase, showing that the market is resting, not reversing.
The market is essentially "charging up" for the next big move.
💡 Why This Matters: The Pennant shows temporary equilibrium between buyers and sellers. A breakout typically signals which side wins — and in this case, buyers have taken control.
🪞 3. Mirror Market Concepts (MMC) – The Secret Weapon
This chart also showcases the power of MMC (Mirror Market Concepts), a strategy based on the idea that the market tends to reflect its previous behavior, structure, and reactions.
Here’s how MMC applies:
The price broke out of the pennant, then came back to retest the breakout area, just like it did during the previous breakout from the consolidation zone.
The Mini SR – Interchange zone acted as resistance before, and now it’s acting as support — a classic Support/Resistance flip (SR flip).
The retest behavior mirrors the earlier breakout structure, offering a confirmation that the market is following a familiar rhythm.
📊 Trading Logic: When a market behaves similarly at two different points in time, it’s often a signal of institutional activity — "smart money" repeating proven entry points and exits.
🔁 4. Retesting – The Entry Opportunity for Smart Traders
After the breakout from the pennant, price didn’t just shoot up — it pulled back to retest the broken structure. This is a high-conviction setup in technical trading:
✅ Retest confirms the breakout was valid (not a fakeout).
✅ It provides a safe entry point for traders who missed the initial impulse.
✅ Volume and bullish candle structure post-retest indicate buyer interest.
📌 The Mini SR – Interchange zone, around $106,631.69, acted as the perfect launchpad for the next bullish leg.
🎯 5. Trade Setup – High R:R Swing Opportunity
Let’s look at the exact setup this chart offers:
Entry: After the breakout and retest near $107K–$108K
Stop Loss (SL): Below the support zone at $106,631.69
Target (TP): At $116,105.65 — derived by projecting the height of the pole from the breakout zone
This gives an excellent reward-to-risk ratio, a key principle in sustainable trading.
🧠 6. Psychological Fuel – Why This Move Has Legs
Traders who missed the earlier rally are now watching closely for entries.
Retail traders are seeing confirmation.
Institutions may already be in from lower levels and are now defending support zones.
Sentiment is bullish post-retest, increasing volume and momentum.
It’s a self-fulfilling prophecy: as more traders recognize the pattern and the confluence, the trade becomes even more likely to play out.
🗓️ 7. What to Watch Next – Smart Risk Management
Even though the pattern looks strong, smart traders always remain cautious:
✅ Move SL to breakeven once price moves halfway toward the target.
🔄 Consider taking partial profits near interim resistance zones (like $112K).
📆 Stay alert for economic events or Bitcoin news that could cause sudden volatility.
📘 Conclusion: Bullish Setup with Proven Structure and MMC Confirmation
This BTC/USD chart is a textbook example of a Bullish Pennant breakout, with added strength from Mirror Market Concepts and a clean SR Flip retest. For swing traders and price action lovers, this setup offers a structured, strategic, and smart opportunity to ride the next wave of Bitcoin momentum.

BTC/USD SELL SIGNALEntry Zone: 110400 to 110850
Stop Loss: 111100
Take Profit Targets:
* TP1: 109895 ✅
* TP2: 109403 ✅
* TP3: Open/Trailing 📉
Enter with the proper confirmation
