Next Step $155,600, Bitcoin Closes 7th Week Green +AltcoinsThe next target and major All-Time High has been confirmed as $155,601.73 for Bitcoin and this isn't likely to be the end of the bull market. This target is now confirmed after Bitcoin wicked lower on the weekly timeframe to test support but ended up closing green, the 7th consecutive week Bitcoin closes green.
This is a major, major bullish signal. It means one thing only, the demand for Bitcoin is just too strong. So strong, that nobody is willing to sell, at least not for longer than a few hours or a few days.
Sold at 100K? Good! Buy back in but higher.
Sold at 105K? Bad! Bitcoin continues rising.
Bought below $80,000? Congratulations, you are a genius and you are holding a great position, you have months and months of bullish action yet ahead of you.
Bought below $90,000? You are still good, you are wise, you are great. You have to congratulate yourself and know that all the gains you receive you deserve. You bought when the time was right, you bought regardless of what the others said.
Bought at $95,000 or lower? There was higher risk because resistance was strong right in front, 100K-110K, and yet, you took action, now you will be rewarded for being brave. The market will bless you with tons of profits and continued success.
Missed the Bitcoin bus? There is absolutely no need to worry, at all, because the Altcoins market is still trading near its bottom and is soon to grow; What one does, the rest follows.
The Altcoins market will follow Bitcoin. The Altcoins will move to strong highs, new heights and new All-Time Highs.
It is not too late... Crypto (Bitcoin & The Altcoins) is going up!
Namaste.
1-BTCUSD

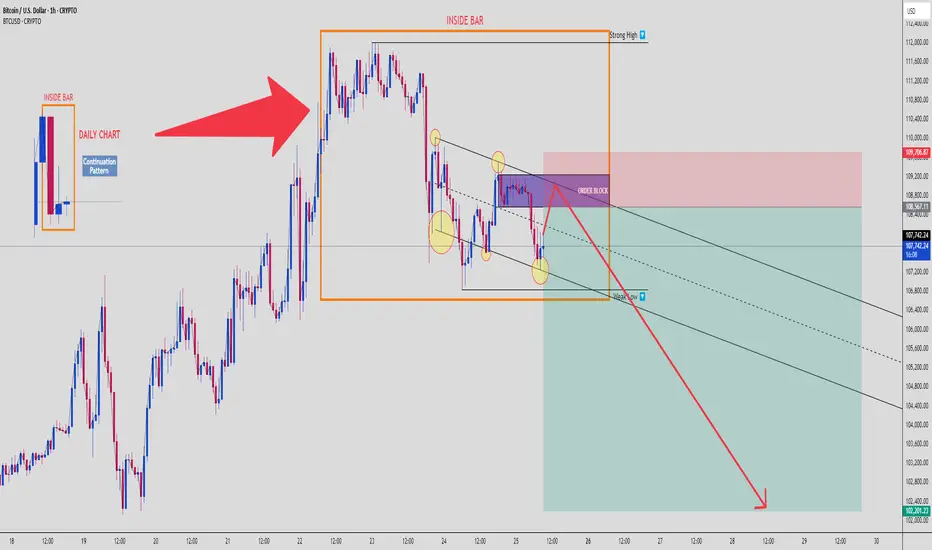
BTCUSD: Inside Bar Trap + Order Block Rejection Targeting $102K📉 Bitcoin | SMC Breakdown | 1H Chart
Welcome to a clean Smart Money setup, where retail gets baited and Smart Money gets paid. Let’s break down what’s happening on BTCUSD, 1H chart, using multi-timeframe confluence and Smart Money Concepts. 👇
🗓️ 1. Daily Chart Confluence
We start with a Daily Inside Bar Pattern – a classic continuation setup, often used by institutions to trap traders before expansion. BTC ranged tightly, then broke to the upside to grab liquidity, not start a rally.
🟥 Daily High = Liquidity Pool
🟧 Inside Bar Range = Manipulation Zone
This is the trap zone.
🧱 2. Order Block Rejection (1H)
Price tapped a clearly defined Bearish Order Block in premium pricing, just above the mid-range of the Inside Bar.
💥 Reaction confirmed:
Rejection candles from OB
Structure respecting downside bias
Fakeout = Fuel for downside expansion
📉 3. Bearish Continuation Structure
Price is moving within a descending channel, respecting internal supply zones. Each lower high is met with supply pressure, and internal lows are swept before moving lower.
You’re looking at a high-probability continuation move toward the weak low marked near $102,200.
🧊 4. Weak Low as Final Target
This level is a classic liquidity magnet – weak lows = retail stop clusters = Smart Money target.
We expect BTC to:
Tap OB
Reject with minor pullback
Break structure
Fill imbalance and target weak low
It’s a beautiful setup if managed correctly.
🧠 5. Psychology & Trap Narrative
Retail is:
Buying the breakout of Inside Bar
Placing stops under weak lows
Ignoring the OB rejection
Smart Money is:
Selling from OB
Riding the imbalance
Grabbing liquidity from below
This is where you flip from reaction-based trading to narrative-based execution.
🧮 6. Trade Setup Summary
📍 Entry Zone: $108,500–$109,700 (OB zone)
🔐 Stop Loss: Above $109,800 (invalidate OB)
🎯 Target:
TP1: $106,500
TP2: $104,000
TP3: $102,200 (Sell-side Liquidity Sweep)
⚖️ RRR: Approx. 1:4 to 1:5 depending on entry
⚠️ Risk Management:
Do not overleverage.
This setup rewards patience and narrative confirmation, not emotional entries. Wait for OB confirmation and rejection.
📈 If this hits, it’s a chart you screenshot and study again and again.
💬 Comment “INSIDE BAR MASTERCLASS” if you’re watching this play out live. Share with your trading circle.
BTC- New Impulse Soon You Can See read captionbitcoin (BTC) – Bullish Outlook
Price action breaking above key resistance, signaling potential trend continuation
Strong volume supports the move, confirming buyer strength
Higher highs and higher lows forming—classic bullish market structure
RSI and MACD both showing bullish divergence
Next target zone: TSXV:XX ,XXX – watch for consolidation or breakout
Overall sentiment shifting positive with macro tailwinds

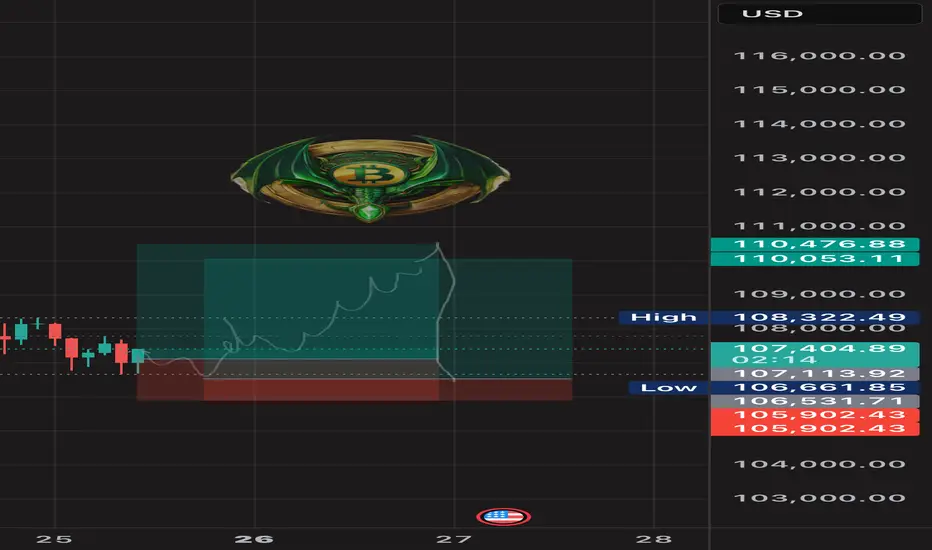
BTC LONG TP:110,000 25-05-2025🚀 LONG setup in play
Looking to enter between 106,500 and 107,000, targeting 109,800–110,300 on the 2H chart.
Estimated duration: 24 hours ⏳
We’re riding a bullish rebound — clean structure, strong reaction.
If the move doesn’t happen within the projected window, the setup is invalid.
We don’t use indicators, we’re not out here drawing lines or cute little shapes — I just give you a clean trade.
#BTC #PriceAction #Reydragon21
Bitcoin H1 | Overlap support at 50% Fibonacci retracementBitcoin (BTC/USD) is falling towards an overlap support and could potentially bounce off this level to climb higher.
Buy entry is at 106,479.20 which is an overlap support that aligns with the 50.0% Fibonacci retracement.
Stop loss is at 104,000.00 which is a level that lies underneath a swing-low support.
Take profit is at 110,363.00 which is a pullback resistance that aligns close to the 61.8% Fibonacci retracement.
High Risk Investment Warning
Trading Forex/CFDs on margin carries a high level of risk and may not be suitable for all investors. Leverage can work against you.
Stratos Markets Limited (tradu.com ):
CFDs are complex instruments and come with a high risk of losing money rapidly due to leverage. 63% of retail investor accounts lose money when trading CFDs with this provider. You should consider whether you understand how CFDs work and whether you can afford to take the high risk of losing your money.
Stratos Europe Ltd (tradu.com ):
CFDs are complex instruments and come with a high risk of losing money rapidly due to leverage. 63% of retail investor accounts lose money when trading CFDs with this provider. You should consider whether you understand how CFDs work and whether you can afford to take the high risk of losing your money.
Stratos Global LLC (tradu.com ):
Losses can exceed deposits.
Please be advised that the information presented on TradingView is provided to Tradu (‘Company’, ‘we’) by a third-party provider (‘TFA Global Pte Ltd’). Please be reminded that you are solely responsible for the trading decisions on your account. There is a very high degree of risk involved in trading. Any information and/or content is intended entirely for research, educational and informational purposes only and does not constitute investment or consultation advice or investment strategy. The information is not tailored to the investment needs of any specific person and therefore does not involve a consideration of any of the investment objectives, financial situation or needs of any viewer that may receive it. Kindly also note that past performance is not a reliable indicator of future results. Actual results may differ materially from those anticipated in forward-looking or past performance statements. We assume no liability as to the accuracy or completeness of any of the information and/or content provided herein and the Company cannot be held responsible for any omission, mistake nor for any loss or damage including without limitation to any loss of profit which may arise from reliance on any information supplied by TFA Global Pte Ltd.
The speaker(s) is neither an employee, agent nor representative of Tradu and is therefore acting independently. The opinions given are their own, constitute general market commentary, and do not constitute the opinion or advice of Tradu or any form of personal or investment advice. Tradu neither endorses nor guarantees offerings of third-party speakers, nor is Tradu responsible for the content, veracity or opinions of third-party speakers, presenters or participants.

Volatility Period: Up to May 29
Hello, traders.
If you "Follow", you can always get the latest information quickly.
Have a nice day today.
-------------------------------------
(BTCUSDT 1D chart)
It is showing a downward trend below the previous ATH range.
Accordingly, we need to see if it can rise to around 109588.0 and receive support.
However, since it is currently going through a period of volatility, we need to be careful about trading until May 28th.
-
If it falls further, we need to check if it can receive support near the Fibonacci ratio range of 1.902 (101784.54) ~ 2 (106178.85).
In particular, whether it can receive support near the M-Signal indicator on the 1D chart is key.
If it falls below the M-Signal indicator on the 1D chart, there is a possibility that it will touch the M-Signal indicator on the 1W chart, so we need to think about a response plan for this.
Therefore, if it shows support near the M-Signal indicator on the 1D chart, there is a possibility that it will show a pull back pattern.
The HA-High indicator of the 1D chart is formed at 102302.08, so it is important to see if there is support around this point.
-
The OBV indicator shows that OBV is falling below the High Line, and the StochRSI indicator is also showing that it has switched to a state of K < D.
Therefore, it is necessary to check whether OBV can touch the previous High Line or OBV EMA and rise.
If it falls below that, it is highly likely to lead to further decline.
I compared the previous OBV movements, that is, A, B, C, and the current movement, and the difference can be distinguished by whether it fell below the previous candle or not.
You can see that there is a difference from the previous movement because it is highly likely to close below the previous candle.
Therefore, the point to watch is whether it falls below 102302.08 after the volatility period or rises above 109588.0-110787.38.
If it falls below 102302.08 and receives resistance, it will turn into a short-term downtrend, and if it rises above 109588.0-110797.38, it is likely that the uptrend will resume, so it is a meaningful section.
-
Thank you for reading to the end.
I hope you have a successful trade.
--------------------------------------------------
- This is an explanation of the big picture.
(3-year bull market, 1-year bear market pattern)
I will explain more details when the bear market starts.
------------------------------------------------------

2 year Bitcoin roadmapThis is the way.
In time, you will understand the power of simple lines and the cyclical nature of markets across time. It all repeats, whether it is algorithms or human action; 80% of things follow patterns.
Randomness and outliers are always a minority.

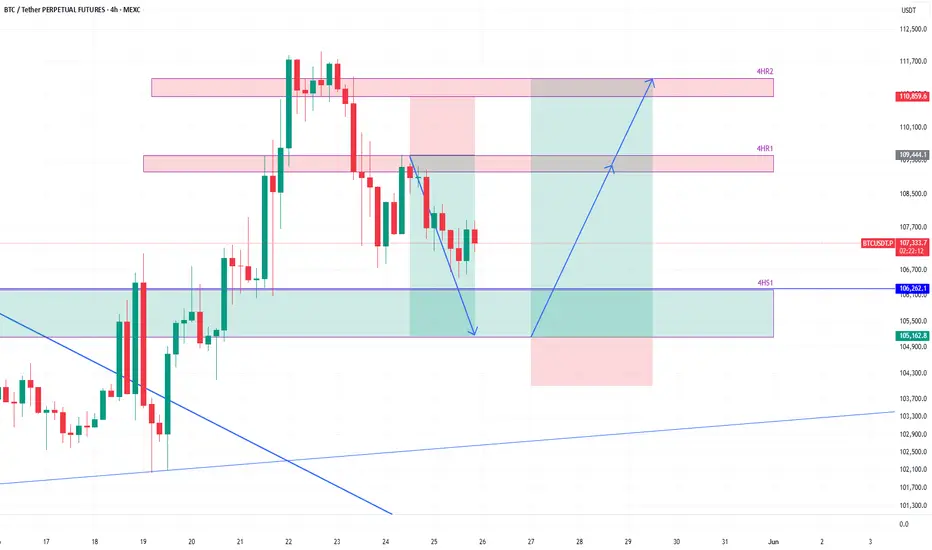
BTCUSDT to bounce from 4h supportHere is an idea for trade on BTCUSDT. The price is coming close to the 4h support zone 4HS1.
It is likely that it will find support there and bounce from there towards 4h resistance 4HR1 and possibly towards 4HR2.
We will take some profit at 4HR1 level if the price reaches there and look to refill the position on any pullback.
We will also reevaluate if the price is really heading towards 4HR2 or likely to go around 96k-97k before fueling up for upward move.
Bullish bounce?The Bitcoin (BTC/USD) is falling towards the pivot and could bounce to the 1st resistance.
Pivot: 105,255.25
1st Support: 101,983.62
1st Resistance: 111,758.60
Risk Warning:
Trading Forex and CFDs carries a high level of risk to your capital and you should only trade with money you can afford to lose. Trading Forex and CFDs may not be suitable for all investors, so please ensure that you fully understand the risks involved and seek independent advice if necessary.
Disclaimer:
The above opinions given constitute general market commentary, and do not constitute the opinion or advice of IC Markets or any form of personal or investment advice.
Any opinions, news, research, analyses, prices, other information, or links to third-party sites contained on this website are provided on an "as-is" basis, are intended only to be informative, is not an advice nor a recommendation, nor research, or a record of our trading prices, or an offer of, or solicitation for a transaction in any financial instrument and thus should not be treated as such. The information provided does not involve any specific investment objectives, financial situation and needs of any specific person who may receive it. Please be aware, that past performance is not a reliable indicator of future performance and/or results. Past Performance or Forward-looking scenarios based upon the reasonable beliefs of the third-party provider are not a guarantee of future performance. Actual results may differ materially from those anticipated in forward-looking or past performance statements. IC Markets makes no representation or warranty and assumes no liability as to the accuracy or completeness of the information provided, nor any loss arising from any investment based on a recommendation, forecast or any information supplied by any third-party.

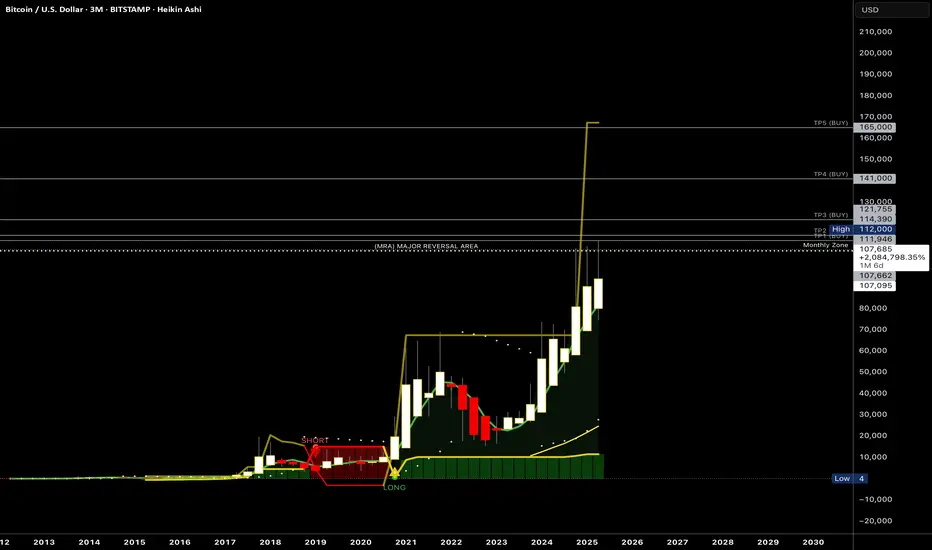
BTC Market Analysis for Q2BTC Market Analysis for Q2 - As we end the month the market tends to rescind. Pay close attention to the monthly and weekly zones. Price needs to break above the monthly zone. Let’s see if the month of June opens up above $107,700 that would indicate a continuation to the upside - possibly to $120-125K…
"BTC - Time to buy again!" (Update)As mentioned in the previous analysis, the price reached the top of the wedge and broke out with a price increase. Now that Bitcoin's price is above the wedge, it can be said that with a slight price correction, it could follow the pattern and make a measured move where AB = CD.
PREVIOUS ANALYSIS
Give me some energy !!
✨We spend hours finding potential opportunities and writing useful ideas, we would be happy if you support us.
Best regards CobraVanguard.💚
_ _ _ _ __ _ _ _ _ _ _ _ _ _ _ _ _ _ _ _ _ _ _ _ _ _ _ _ _ _ _ _
✅Thank you, and for more ideas, hit ❤️Like❤️ and 🌟Follow🌟!
⚠️Things can change...
The markets are always changing and even with all these signals, the market changes tend to be strong and fast!!

Bitcoin: Too Early To Buy The Retrace.Bitcoin may be entering a brief corrective formation within the broader bullish trend. The large red candle that rejected the 113K resistance (see my previous article), could be the beginning of a retrace that can take price as low as the 102,500 to 100K area IF bearish momentum persists. The mistake to avoid is buying this pullback too early, especially since there is no bullish confirmation on this time frame.
The red candle off the 113K area is what I like to refer to as the "mother bar". As you will notice, the following candle is a bearish pin bar which failed to break back above the 50% point of the mother bar (see blue arrow). This is a "mini" lower high and is typically a bearish sign for those operating on smaller time frames. A break below 106,500 would confirm a sell signal on this time frame as well as smaller time frames like 4H and 1H. This can be attractive for aggressive shorts, BUT it is very important to keep the broader trend in perspective.
This bearish development does NOT constitute a change in the broader trend. This means support levels are still more likely to hold, and resistances more likely to break. The higher probability scenarios in my opinion are bullish reversal patterns between the 102,500 - 100K area. Double bottoms, failed lows etc. on 1H, 4H or this time frame would be ideal for swing trade longs (see illustration). IF the bullish trend is going to stay intact, then a higher high is within reason which can see price test 113K or higher (120K is my next resistance).
Another VERY important consideration is the overall location of price. Currently in a Wave 5 (v) configuration which signifies limited potential in the near future. In other words, RISK is elevated and only continues to increase as price climbs higher. As "optimistic" as everyone may seem to be, this is a time to be more defensive, NOT aggressive. This can be accomplished by reducing expectations, operating on smaller time frames, and taking smaller positions. My Trade Scanner Pro helps to quantify risk which is especially helpful in rising risk environments such as this one.
In contrast, the location to be aggressively bullish was the 76K area low. Sure I can say this after the fact, BUT if you read my analysis and watch my streams from that time, I was pointing out the potential and the bullish signs as they were developing in real time.
Market situations like the one Bitcoin is in right now can be very confusing at times. Navigating this environment successfully depends on how you interpret price structures, trends and levels across multiple time frames and letting the MARKET validate ideas or not the other way around. Always consider arguments on both sides of the market and weigh those arguments against the style or strategy that you intend to deploy. And if confusion ensues, then the easiest thing to do is walk away. When potential is limited, there is nothing to fear in terms of missing out.
Thank you for considering my analysis and perspective.

where to buy ?Hello friends
Given the good growth of this currency, we are witnessing a price correction and this is an opportunity to buy in the price correction in the support areas and move with it to the specified goals, of course with capital and risk management.
*Trade safely with us*

BTC 4H AnalysisBTC overall trend is still bullish based on previous analysis . nowadays we see exact rejection of price from our resistance level. on higher time frame the trend is still bullish. important support levels are highlighted on the chart. The 93-94 zone is the most important one. this zone will determine the direction of BTC movement

btcusd sel of after each bitcoin conferenceAfter each b.tc8conference there were sell offs as of everybody discovering who really are holding bitcoin and there are still no killer app to make bitcoin useful for anything else than gambling, money laundry
Bitcoin conference this year is even worse with JD Vance and Trump Family using the opportunity to spread their bullshit fake news and narratives.
Bitcoin will blow off top to 120k and went to 60k till end of the year liquidating everybody including biggest hodler saylor strategy when trump will be impeached for abusing public office of presidency for personal enrichment.
Trump must pray that his own MAGA didn't shot him like Kennedy for betrayal.
Only way to survive for him would be resign before he get's impeached and removed from office.

BTC Hits ATH Time But Dont Let Euphoria Ruin Your PerceptionBitcoin has pushed into new all-time highs and is now testing the same resistance zone we saw back in December–January. While the breakout is technically impressive, price is stalling at the exact level where strong sell pressure previously kicked in.
Today’s weekly close is a key confirmation point. But the bigger issue? Next week is stacked with macro volatility — PPI, FOMC, and other data drops that could rattle risk-on assets.
⚠️ What I’m Seeing:
- Weekly RSI divergence continues to build
- Volume is drying up, not confirming the move
- Macro pressure is incoming — timing matters
🧠 My Bias:
I wouldn’t be surprised by a final liquidity grab into the $120K–125K range — enough to trap late longs and generate downside liquidity.
Personally, I’m de-risking. Not shorting yet — just locking in some gains.
Ask yourself: Are those extra 10% upside gains worth the risk of giving back 30%-50%?
Not calling tops. Just following structure.
Always open to opposing views — discussion sharpens conviction.
Don’t let euphoria cloud your perception.
📉 Stay safe out there.

BTCUSD: Strong Bullish Sentiment! Long!
My dear friends,
Today we will analyse BTCUSD together☺️
The in-trend continuation seems likely as the current long-term trend appears to be strong, and price is holding above a key level of 107,147.58 So a bullish continuation seems plausible, targeting the next high. We should enter on confirmation, and place a stop-loss beyond the recent swing level.
❤️Sending you lots of Love and Hugs❤️

BTCUSD: Growth & Bullish Continuation
Remember that we can not, and should not impose our will on the market but rather listen to its whims and make profit by following it. And thus shall be done today on the BTCUSDpair which is likely to be pushed up by the bulls so we will buy!
Disclosure: I am part of Trade Nation's Influencer program and receive a monthly fee for using their TradingView charts in my analysis.
❤️ Please, support our work with like & comment! ❤️

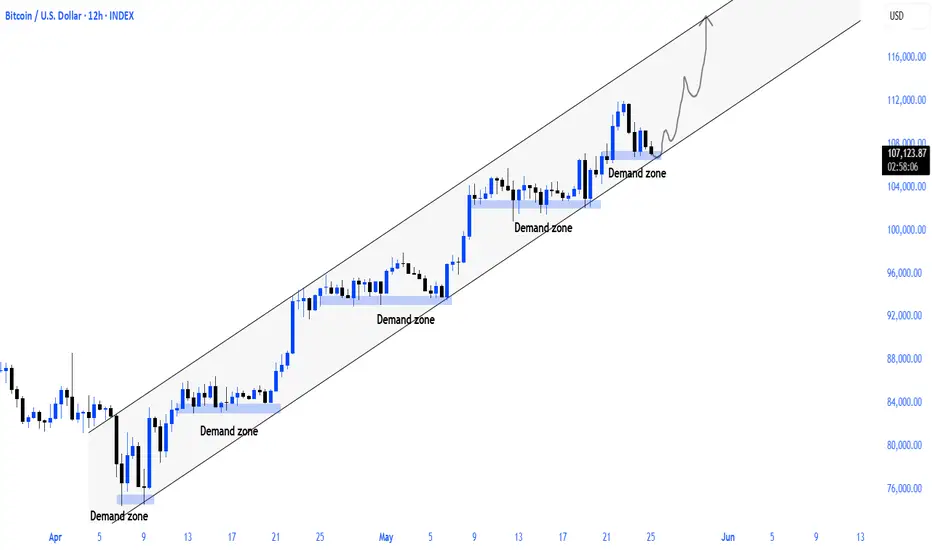
btc 12hbitcoin continues to maintain its rising trend support starting with 74k. i think it will start to move upward from the trend support equivalent to the current demand zone
BTCUSD MMC Breakdown – Curve Collapse & H&S Sell-Off Loading🔍 Chart Overview – BTC/USD (1H Timeframe)
This setup uses Mirror Market Concepts (MMC) to forecast Bitcoin’s next potential major move, blending institutional-level curve analysis, pattern recognition, and structure shifts.
We are currently seeing a Head & Shoulders (H&S) pattern develop under a Black Mind Curve Resistance, supported by a sloping neckline and a clear zone of structure breaks and retests. Price is positioned for a significant bearish continuation if confirmation hits.
📐 Breakdown of Key Components:
🧠 1. Mirror Market Concepts (MMC)
MMC focuses on the symmetry and memory of market behavior. When certain price structures mirror past reactions (support, resistance, or rejection points), we gain an edge in anticipating where big moves will happen.
Here, the curve structure and neckline level align to mirror prior bearish reactions.
👤 2. Head & Shoulders Pattern
Left Shoulder: Formed with rising volume and strong bullish momentum.
Head: A sharp move upward forming a new high, but eventually fails to sustain above the curve.
Right Shoulder: A weaker bullish attempt, indicating exhaustion and imbalance.
The neckline is clearly marked — a break below it validates the reversal pattern.
🟠 3. Black Mind Curve Resistance
This is an institutional resistance arc — an MMC dynamic level that mirrors prior selling patterns. Price reacted strongly under this curve, confirming its relevance.
It acted as a ceiling for the head formation, capping bullish continuation and turning price downward.
🔵 4. Black Mind Curve Support
Drawn beneath the price action, this dynamic support is about to be tested again. A clean break below the curve and neckline would likely result in a strong drop.
⚠️ 5. Major CHoCH & BOS Zones
CHoCH (Change of Character): Price failed to form new highs and showed early bearish shift.
BOS (Break of Structure): Confirmed when neckline is broken.
These are vital MMC confirmation points that strengthen the short idea.
🔁 6. Retest & Boom (Bearish Version)
Price could retest the neckline or the broken trendline (shown by the blue arrows), offering a perfect "sell on retest" opportunity before dropping to the target.
This is a classic MMC play — breakdown ➝ retest ➝ continuation.
🎯 7. Target Zone
Projected based on:
Height of the H&S pattern.
Previous key structure zone.
MMC symmetry principles.
Expected target: near $101,700 – $102,000.
🧨 Trade Idea:
✅ Bearish Setup (Preferred Bias)
Wait for a clean neckline break and candle close.
Look for retest of neckline or curve (lower timeframes).
Sell with target near $101,700, SL above right shoulder.
🚫 Invalidation:
Price closes back above right shoulder and curve.
Invalidates the bearish structure.

Is the BTC Bull Tired ? A Healthy Pullback May Be on the Horizon🚨 Market Watch Update 🚨
Hey fam while the macro trend is still bullish overall, I'm noticing signs that this current uptrend might be running out of steam. There’s a good chance we’re nearing a breakdown from the rising channel, which could open the door for a healthy correction down toward that ~$90K area.
Last week’s breakout really shook things up a ton of short positions got liquidated, which helped push the price higher in the short term. Classic squeeze move. 👀
But here’s what I’m watching next
🔻 In the near term, I’m leaning slightly bearish. I wouldn’t be surprised if price pulls back into the $102K–$99K zone sometime this week. That range could offer a decent reset before the next major move.
🧠 Remember, when green candles start popping, retail FOMO tends to kick in hard — folks jump in late, thinking the rally will never end.
That’s exactly where market makers step in, taking profits and reloading at better levels. Don’t be the exit liquidity.
Stay patient. Stay sharp. And as always I’ll keep you posted with a deeper dive soon. 🎯

btc target 5x in a year from now One of the rarest charts on the planet is unfolding on $BTC.
📈 Triple Cup + Accumulation
📍 CMP: $107,976
🎯 Target: $500,000 by mid-2025/26
🧠 This is not just a trade. It’s a historic setup.
If you miss this, you might miss the decade.

Bitcoin 97k??(USD gaining strength)Good day traders, I’m back again with this beauty of a setup on BTCUSD, first things first on the daily TF price created a balanced price confirming our Thursday’s high as the high of the week.
On the 4H TF and this is where my focus is at, on the chart you can clearly see the levels that I would like to see price reaching to. The first one is my 4 hour FVG that I would like to see price leave open because of the second rectangle(1H BPR), to see how I came about this hourly balanced price range, you can just jump to the hourly and try to see how I got to that BPR for educational reward.
On the hourly if we take a closer look, we see that the 4H FVG and the 1 hour FVG are on top of each other again that’s a confirmation to consider. Back on this TF what I’m expecting to see is price try and fail getting to that 4H FVG and than shoot lower to our relative lows.
