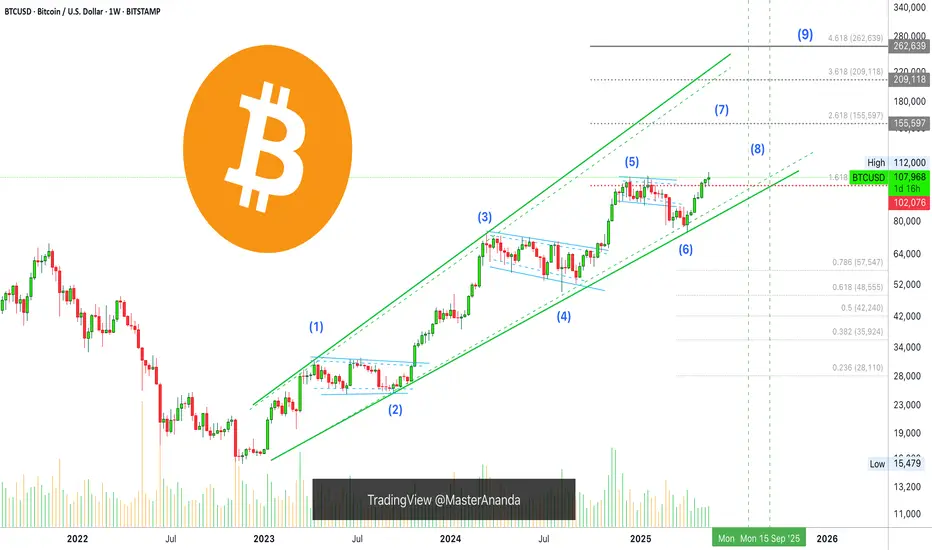
9-Up Waves—Extended Bullish Impulse—Bitcoin's 2025 Bull MarketIn Elliot Wave Theory, a bullish impulse has a total count of 5 waves but this isn't all. There is something called an "extension." Extensions can lead not only to 9 total waves but even 13 waves.
We can easily see this happen if we consider Bitcoin's bull market based on the long-term chart structure, starting in November 2022, see the chart above.
A bull market is defined as a sequence of higher highs and higher lows. This is perfectly visible on this chart. Contrary to many Altcoins, Bitcoin is in a long-term bull market.
If we consider even some of the big Altcoins projects, we can see that no long-term bull market is present, many are producing lower lows, but at the same time, others are producing long-term uptrends like Tron. So there are variations.
Seeing a perfect long-term 5 waves pattern completed when Bitcoin hit $110,000 in January 2025, seeing a strong higher low and the continuation of this trend, we can easily conclude that an extension is taking place.
Will this extension end at 9 waves or 13 waves?
Bitcoin is going up. It is already happening. There will be more.
Thank you for reading.
Namaste.
1-BTCUSD
BTC USD Price Action End of May 2025Sunday 25th May 2025
Well what a month for BTC.
Dominance has remained strong remaining above 64% month to date.
The DXY has been losing strength which has been helping BTC's case.
Record BTC ETF inflows going into BTC recently.
Trump making deals in the Middle East.
BTC is still in s trong stance and it is looking like it is coiling up for the top. Whether that is a grind up through the Northern Summer, or a choppy North Summer and then spike up into September October and a double top forming before the decline into the bear, who knows.
But overall it is bullish.
It is risk on, as Gold also cools off with sideways action, not so much a major pull back as yet.
US Stocks are looking strong also in a bullish stance on the indices.
Strictly with BTC we have officially hit a new All Time High of $111,965 with some exchanges breaking the $112k USD mark.
Will all this bullish action, we are looking for a pull back of some sort. A cool off soon would be very healthy for the market.
The cycle timing is indicating a 60 day low occuring in or around Friday 6th June 2025, plus or minus few days.
We could see a shallow dip to the low $100k's / high $90k's.
We have FOMO level of $98,501 at the 50% Fib.
OTE long zone sweet spot between $95,370 (61.8%) and $90,913 (78.6%).
And the back the truck up level at $88,367 (88.2%).
The bodies of the yellow candles are price zones may need to be filled, so would make good retracement entry points.
Also to support the pullback / cool off, VZO/PZO is in overbought territory.
Bear divergences in the double ribbon, Fisher, Squeeze Momentum and Commodity Channel Index.
The Bollinger Bands are Squeezing which is a sign of coming volatility or consolidation (not shown).
We are on a TD7, so two more days to perfect the TD9 count and another possible 1 to 4 days of upside, so we could still see positive price action up until Saturday 31st May to close out the month.
The a dip and grind up the the next 60 day cycle top which may occur in or around the 21st July give or take a few.
In the news, ETF's see 4.5 x growth as there has been $2.75 Billion USD in inflows in the past week.
Let's see how the week and month closes out for a better picture.
Happy Trading Crypto Pirates.
Peace out.
F.Govt. F.Police.
Snake Plissken signing out.

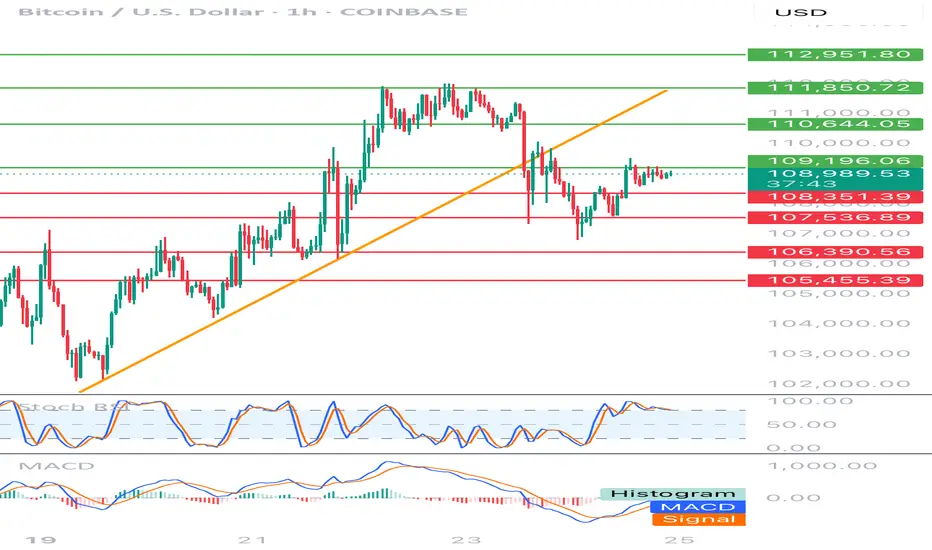
BTC-USD 1h chart targets and stoplossHello everyone, let's look at the 1H BTC chart to USD, in this situation we can see how the price dropped below the local upward trend line. Going further, let's check the places of potential target for the price:
T1 = 109196 $
T2 = 110644 $
Т3 = 111850 $ t4 = 112951 $
Let's go to Stop-Loss now in case of further declines on the market:
SL1 = 108351 $
SL2 = 107537 $
SL3 = 106390 $
SL4 = 105455 $
Looking at the RSI indicator, we see staying over the upper limit, which can give price drops, while the MacD indicator lasts at the bottom of the range and is close to returning to the upward trend.
Bitcoin: LEVELS LOOKOUT!If you find this information inspiring/helpful, please consider a boost and follow! Any questions or comments, please leave a comment!
BTC on Watch: Short-Term Levels That May Show the Market’s Hand
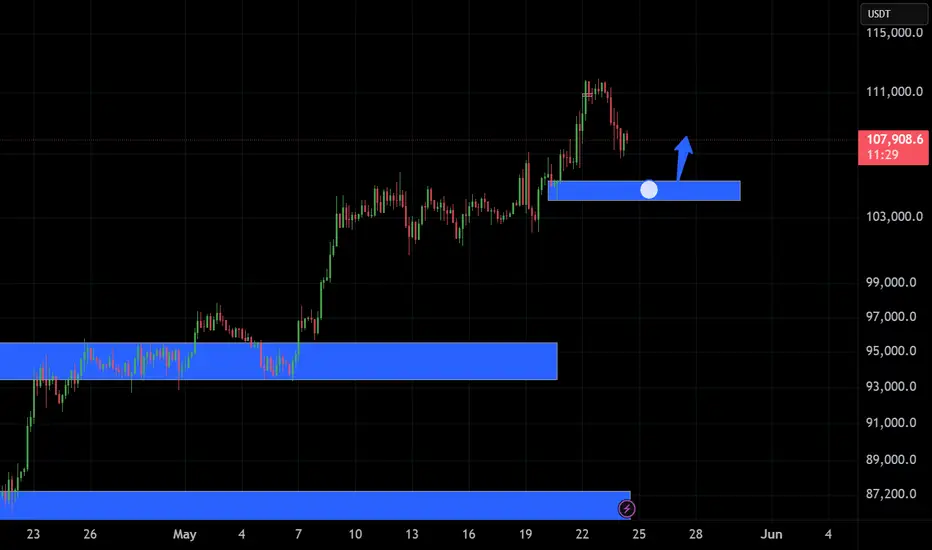
#Bitcoin is hovering around all-time highs, but traders should be on high alert. There’s a visible level just beneath price that’s acting as the current line in the sand.
What to Look At
Rather than overanalyze, just focus on the chart. A clean level around $100k is marked — if that gives way, it may not just be a smaller degree pullback on news. It could be the start of something more revealing and deeper.
What Comes Next?
If price breaks that 107k zone, watch what the market prints in response. Does it flush impulsively? Does it grind? Those reactions will show intent — and possibly confirm or deny a larger corrective wave unfolding.
Outlook
We’re not guessing the future — we’re waiting to observe the market’s decision point. Eyes on that level. If it breaks, the chart will speak louder than words.
Trade Safe!
Trade Clarity!

Bitcoin - Confirmed Breakout#BTC/USDT #Analysis
Description
---------------------------------------------------------------
+ Bitcoin has successfully broken out from the resistance, this is the third time bitcoin has broken out from the resistance line, in the previous two breakouts bitcoin had significant growth and we can expect similar growth this time.
+ the next target for bitcoin is around 150k and this is an easy target for bitcoin.
+ Bitcoin can see some consolidation around previous resistance (around 109k) but this can be broken easily.
+ Lets see how this plays out.
---------------------------------------------------------------
Enhance, Trade, Grow
---------------------------------------------------------------
Feel free to share your thoughts and insights. Don't forget to like and follow us for more trading ideas and discussions.
Best Regards,
VectorAlgo

BTC Futures : My first attempt with a target price of 0Hello friends; I think not believing in Bitcoin is as natural as believing in Bitcoin.
I can't express my opinion here with moving averages and/or RSI levels.
The Beyond Technical Analysis might make sense for this trade.
If we are wrong, what is important here is our position and risk management. We do not open a transaction to say "I told you so".
I cannot explain this with any technical analysis method, blockchain data, etc.
Technically; everything that will be built based on this is the same as building a sand castle.
I don't think Bitcoin has an equivalent.
If we consider serious inflation rates, it is obvious that people will have much bigger and more vital priorities than buying Bitcoin or other cryptocurrencies. I am not even talking about electricity costs.
I definitely don't think it can be in the same class as Gold.
This trade alone offers us a very good risk/reward ratio.
I chose the contract covering the next period ending on May 30th, not the continuous CME contract, in order to save time.
A good place for a first try.
I will definitely try something similar.
I don't think I will have any views other than the short side in the future.
For years I have been asked, "If you don't believe us, why don't you open a short position?" I will try to achieve this.
So there's also an experimental side to this.
HIGHLIGHTS
We are closing our position before the contract switch date of May 30, 2025, without looking at the price. If necessary, we will try again in the next contract.
The value of 113690 is our stop value. We end our trade at this value.
We choose the smallest value as the position size.
If you expect something to be 0,
you should choose trading instruments that evaluate your position in currencies rather than in BTC value.
I chose CME because it is suitable for this.
Contracts that are further away are definitely not liquid.
It may be difficult to find buyers even at high values.
Target : 0
Absolutely no margin addition.
Best regards.

Bitcoin Lines- What you can see if you remove Bars and replace them by Lines ?
- Congratulation, you just removed the noise in the chart.
- Everything is in graph.
- Covid19 Black Swan included.
- Not a price prediction.🤷♂️.
Happy Tr4Ding !

BItcoin; Heikin Ashi Trade IdeaCOINBASE:BTCUSD
Picture tells more than 1000 words!
Thank you for checking out!

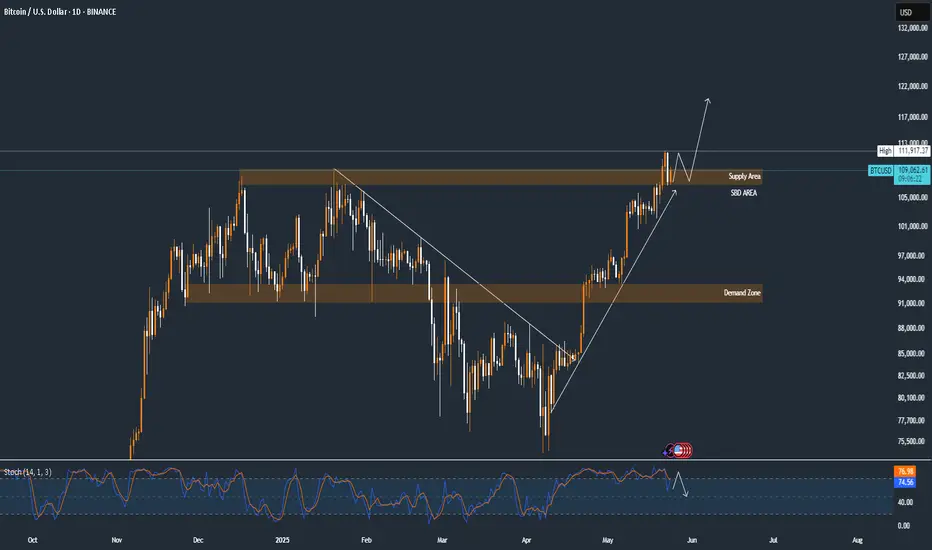
BTCUSD RETEST? CONTINUE BULLISH?BINANCE:BTCUSD Hello Traders, BTCUSD 1D 24/05/2025
Bitcoin has already completed a clean retest of the breakout structure, yet Stochastic remains in the overbought zone (above 75), signaling a potential short-term correction.
Key Observations:
- Price may push further toward the 111,917 resistance zone
- Due to overbought momentum, there’s a possibility for a bounce back toward the SBD (Supply
Become Demand) zone before any continuation
- As long as market sentiment remains bullish, we may see a breakout above 111,917 after the correction
Key Zones:
- Resistance: 111,917
- Demand/SBD Area: Around 102,000
- Major Demand: Below 94,000
Short-term caution ⚠️, long-term structure possible continue bullish 📈
Bitcoin’s Fake Pump Ends HERE! OB + FVG = Bearish Trap?📊 BTCUSD SMC Breakdown (3D Chart)
Price tapped into a High Probability Reversal Zone (OB + 61.8–79% Fib) with strong downward projection. This is a classic case of Smart Money selling into late bull euphoria. 👀
🧠 Smart Money Story:
Sell-side Liquidity Grab: Prior highs got swept—liquidity hunted 💧
Order Block (OB) + 61.8–79% Fib: This area is confluence-rich
Channel Top + Trendline Rejection = Extra confluence 🧱
Strong bearish reaction wick confirms Smart Money presence 🔥
Projection drawn toward 105,968 = -27% extension
📌 Key Technical Zones:
Zone Type Level / Range
Order Block : 108,267.68 (Purple Zone)
Premium Zone (OB + FVG) : 108,267 – 108,938
Entry Trigger : 108,251.52 (Current Price)
SL Zone (Invalidation) : Above 109,000
TP1 – TP2: 106,800 – 105,968 (TP2 = -27%)
🛠️ Trade Setup Idea (Short):
Sell Entry: 108,251 – 108,937
Stop Loss: 109,200
Take Profit 1: 106,800
Take Profit 2: 105,968
RRR: ~1:4 📉💰

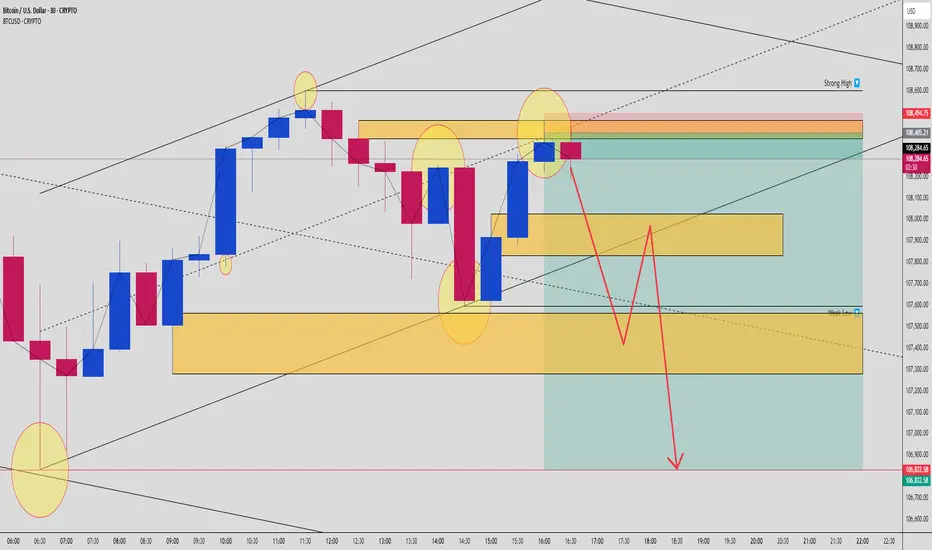
BTCUSD Smart Money Reversal: OB + FVG Trap Targets Weak Lows🚨 BTCUSD Smart Money Concept Alert (30-Min Timeframe)
A classic bearish setup is unfolding on Bitcoin, and it’s screaming trap + reversal for anyone watching closely. Here’s why this could be your high-probability short of the week… 👇
🔍 1. Liquidity Sweep at Key High
We just saw a clean sweep of prior swing highs near 108,400 – a clear signal that Smart Money has hunted liquidity above weak retail stops. That big push into the premium zone? Not real demand. It’s engineered manipulation. 🔧
📉 2. Premium OB + FVG Confluence
Price has just tapped into a juicy confluence zone:
🔲 Order Block @ ~108,400–108,494
🟦 Fair Value Gap (FVG) imbalance sits right below
🎯 All aligning with 61.8–79% Fib retracement from the prior bearish leg
This is where Smart Money institutions enter the party. Look left: it’s the same game played again and again. Trap the highs, fill the imbalance, then dump.
🔄 3. Reversal Evidence Already In Play
A bearish reaction candle confirms rejection from this OB zone. The wick shows aggression – a clear sign of selling pressure stepping in at the premium.
Expectations now shift from retracement to trend continuation toward unmitigated demand zones below.
🧠 4. Weak Low & Liquidity Engineering
Below current price lies a weak low around 107,300 – that’s your magnet. Price needs to sweep that inefficiency, and the structure suggests liquidity vacuum mode is active.
Key zone targets:
🟨 First TP: 107,800 (FVG base)
🟨 Second TP: 107,300 (weak low sweep)
🔻 Final TP: 106,832 (full mitigation zone = 1400+ pip potential)
🎯 5. Execution Plan
💼 Smart Entry:
Entry zone is anywhere from 108,250 to 108,490 (OB + FVG overlap)
SL above 108,600 (structure invalidation)
📊 Targets:
TP1 – 107,800
TP2 – 107,300
TP3 – 106,832
⚖️ RR: ~1:3 or better if executed precisely
🧩 Market Psychology:
This isn’t just technicals. It’s narrative vs. reality.
Retail sees breakout → Long
Smart Money sees sweep → Sell
Retail buys late → Fuel for Smart Money exits
🛡️ Risk Reminder:
Trade the setup, not emotions. Let price come to your zones. Stay mechanical, not emotional. Partial out and trail stops once TP1 hits. Never chase.
✅ Summary:
BTCUSD is showing a perfect bearish Smart Money setup. OB + FVG confluence, strong premium reaction, engineered weak low, and liquidity zones below. Textbook SMC pattern. Play it right, and this setup could deliver clean, high-RR profits.
⚡ Drop a “BTC READY” in the comments if you're watching this one with sniper focus.
🧠 Tag a trading buddy who still thinks we’re in a breakout!
BTC/USDT Long Buy TradeBINANCE:BTCUSDT.P
Entry 108100
SL 107200
TGT 113700
BTC forming The Signature W Pattern

Bitcoin (BTC/USD) – Rising Wedge Pattern Signals & BreakdownThis chart illustrates a Rising Wedge Pattern on the weekly timeframe for Bitcoin (BTC/USD), which is generally considered a bearish reversal pattern in technical analysis. The pattern appears after a strong upward move and typically signals that the price is losing momentum and may be preparing for a significant correction.
📐 What is a Rising Wedge Pattern?
A rising wedge is a chart pattern formed when the price consolidates between two upward-sloping trendlines – the support line (bottom) and the resistance line (top) – with the two lines converging toward each other.
As price climbs higher, it forms higher highs and higher lows.
However, the slope of the highs is less steep than the slope of the lows, showing a loss of bullish strength.
Eventually, the price breaks below the support line, often leading to a sharp move downward.
🔍 Key Highlights from the Chart:
📌 1. Major Resistance Zone (~$110K–$120K):
BTC is currently facing heavy resistance in this area.
This zone has historically acted as a supply zone where bulls have struggled to break through.
Multiple rejection wicks indicate strong selling pressure.
📌 2. Pattern Touchpoints:
BTC has now formed multiple touchpoints on both the support and resistance lines of the wedge, confirming the structure.
This gives the pattern higher validity from a technical analysis perspective.
📌 3. SR Interchange Zone (~$65K–$70K):
This is a key horizontal zone where past resistance could act as future support.
A successful breakdown may first test this level before continuation.
📌 4. Retesting After Breakdown:
After breaking the wedge support, a retest of the broken trendline is often seen.
If the retest is rejected, it confirms the breakdown and opens the door to deeper bearish movement.
🎯 Target Projection:
If the wedge breaks down and the bearish scenario plays out, we could see Bitcoin fall to the $22,000–$25,000 region – marked as the final target zone on the chart. This level aligns with:
Previous macro-support zones from 2021
Fibonacci retracement levels
Psychological price levels where buyers may re-enter
⚠️ Bearish Factors to Watch:
Bearish divergence on indicators like RSI or MACD (not shown on chart but worth checking)
Volume decreasing as price rises – a classic wedge behavior
Macroeconomic headwinds or Bitcoin halving-related exhaustion
Rejection from major resistance with strong bearish candles
🕒 Timeframe & Patience:
This is a weekly chart, which means the pattern will play out over weeks or months, not days. Patience is key. A clear break, retest, and rejection would be the most reliable confirmation to expect further downside.
✅ Invalidation Scenario:
If BTC breaks above the wedge resistance line with strong bullish volume and holds above the $120K level, this bearish thesis becomes invalid.
In that case, BTC could enter price discovery mode, making new all-time highs.
💬 Final Thoughts:
This analysis is a technical outlook, not financial advice. Always use stop-loss strategies and manage your risk carefully. Market sentiment, news, and macro factors can quickly shift the scenario. However, from a purely technical standpoint, the rising wedge pattern is a powerful signal that should not be ignored.

BTCUSDin higher time frame it gave a trend line brake out towards down side
it also in down trend
so catching up that trend

Bitcoin Closes Red! Is The Bull Market Over?The end of the bull market and the start of a strong bearish cycle is now confirmed? That's the question that I received from one of my new followers based on much news all across the Cryptocurrency market.
How far down is Bitcoin going in this long-term, very strong, hard and surely-highly confirmed marketwide ultra-bearish correction? None.
I have news good for you, there is no correction, Bitcoin closed one day red. Yesterday's candle produced a 4.4% drop right after Bitcoin hit $112,000, a new All-Time High.
The truth is that Bitcoin just hit a new All-Time High and this reinforces the bullish bias for this Cryptocurrency market, it bolster the Altcoins market; Everything is set to continue growing.
What does $500,000,000 in liquidations, a new ATH and a 4% drop have in common?
Over-leveraged traders.
These are the only losers right now. In order to be liquidated after such a very small move it means that you were trading with more than 15X. That's it. The rest of the market is solid, everything else is strong and there is no need to fear; remember, retraces and corrections and an opportunity to buy-in, rebuy and reload.
Just wanted to tell you that all is well, the rise is not over, this is just a minor pause. Look back to late April, early May, mid-May and so on, the market can and does produces red days, it never moves straight down but neither straight up.
A new bear market now? FALSE.
Bitcoin will continue growing long-term. The Altcoins are on the same train.
A retrace can last a few days just as it can last a few weeks.
A correction can last a few weeks just as it can last a few months.
A bull market can go on for years, and we are in bull market territory now, so be ready and prepared for additional growth. Bitcoin is going up!
Rest easy and hold strong.
Continue to buy and accumulate the Altcoins.
This is not the end, it is only the start.
Namaste.

Bitcoin - Correction Is Finally Happening!Hello, Skyrexians!
Let's continue trying to guess when BINANCE:BTCUSDT will have a correction. This time it's very likely, but I am not recommend to short this correction because this is the trade against the major trend.
Let's take a look ate 12 hours time frame. Wave 3 is likely to be finished with internal double divergence on Awesome Oscillator. Now it's finally time for the wave 4. 0.38 Fibonacci is the most likely target at $101k. After that wave 5 is expected and it's going to be only higher degree wave 1.
Best regards,
Ivan Skyrexio
___________________________________________________________
Please, boost this article and subscribe our page if you like analysis!

BTCUSDT 4H Analysis BTC ~ 4H Analysis
#BTC Let's start Long/Buy back at this support block with long term target of $120K - $130K - $140K - $150K above this is just bonus for you.

$CHILL/USDT Trade SetupPrice is bouncing off a key demand zone + ascending trendline on the 1H chart, showing strong bullish structure. 📈
- Entry Zone: CMP
- Stop Loss: $0.09114
- Targets:
• TP1: $0.1070
• TP2: $0.1150
• TP3: $0.1187
As long as price holds above the trendline and demand zone, upside targets stay valid. Break below SL kills the setup.
DYOR, NFA

BTC/USD IS A STRATEGIC CORRECTION OR A NEW RALLY AHEAD?BTC/USD 24 MAY – IS A STRATEGIC CORRECTION OR A NEW RALLY AHEAD?
🌐 MACRO & FUNDAMENTAL CONTEXT
Federal Reserve Outlook: Recent statements from Fed officials remain hawkish, signaling that interest rate cuts may not arrive soon. Inflation data remains sticky, adding pressure on risk-on assets like crypto in the short term.
Market Sentiment: Investors are cautious, with capital flowing back into safer assets amid global uncertainty. However, long-term sentiment on BTC remains strong, supported by fundamentals.
On-Chain Metrics: Wallet activity and hash rate growth continue to reflect strong underlying demand. This suggests accumulation despite short-term price pressure.
📉 TECHNICAL STRUCTURE (H1 CHART)
BTC/USD is currently correcting after reaching the 111,947 resistance area. Price bounced from the 106,831 support zone and is now approaching the mid-range levels again.
Chart Formation: A possible "bull trap" pattern is forming. Price may retest the 110,000 – 111,947 supply zone before deciding the next move.
EMA Signals: Short-term EMAs have crossed downward on the H1 timeframe, indicating a weakening bullish momentum.
🎯 TRADE SETUPS FOR TODAY
🔻 SCALP SELL ZONE:
Entry: 111,800 – 111,950
Stop Loss: 112,200
Targets: 110,000 → 108,500 → 106,800 → 102,567
🔺 BUY ZONE (PULLBACK SUPPORT):
Entry: 106,800 – 106,600
Stop Loss: 106,200
Targets: 107,800 → 109,000 → 110,000
🔍 TECHNICAL KEY LEVELS
Resistance Zone: 111,947 – 112,000
Support Zone: 106,831 → 106,600 → 102,567
FIBO Key Levels: 0.5 – 109,393 | 0.382 – 108,763
⚠️ STRATEGY OUTLOOK
If BTC breaks above 112,000 with strong volume, expect a bullish continuation toward 114,000+ levels.
However, if price fails to hold above 110,000 and drops below 106,800, a deeper correction to 102,500 may follow.
📌 CONCLUSION
"BTC is at a decision point, trading between macro hawkish pressure and technical liquidity zones. Stay flexible and wait for confirmation before committing heavily."
Watch the US Jobless Claims data tonight for volatility triggers.
Avoid emotional trades. Use strict risk management.
Follow this profile for more real-time plans and updates.

BTCUSDHello Traders.
This is my analysis for BTCUSD.
I am not a professional and I would be happy if you share your opinion in the comments.

The future trend for Bitcoin is very likely to be bearish.Hello everyone
According to what I get from the chart and also from the RSI, we are going to have a downtrend
From the part where the red arrow is placed, we are going to have a temporary or maybe long-term downtrend to the desired support levels

BTC is nearly to the End of journeyAs the Chart tells everything for addition, based on the Elliot Wave Sequence, 5 waves of impulsive ended on December 23, also Divergence on RSI is obvious.
This proof of the 5 Impulsive ended. Right now we are at ABC Correction, and now the B Wave is close to the end, and Wave C is coming on a big.
