BTCUSD Double Tap Into OB Before Massive Sell-Off! 2,000+ PipsHere’s why this could be one of the cleanest bearish setups of the week based on institutional flow and price action:
🚨 Step 1: Liquidity Engineering in Full Effect
We’ve got multiple areas where price was engineered to grab liquidity — clearly visible with those highlighted zones. Bitcoin pumped into a Strong High, tagging liquidity above a key trendline while respecting an internal parallel channel.
This move was not random. It was a textbook liquidity sweep.
🔁 Step 2: Order Block + 70.5% Fib Confluence
After the sweep, price retraced precisely into a bearish Order Block that overlaps perfectly with the 70.5% Fibonacci level — a hidden gem Smart Money loves to use for optimal entries. It’s the sniper zone.
This is where the first rejection came in, marking the start of bearish intent.
⚠️ Step 3: Break of Structure + Weak Low Exposed
As price dropped, it broke back under a weak low, confirming shift in market structure. This is your Change of Character (ChoCh) — the moment sellers regain control.
We’re now seeing retracement candles struggling to push above the OB/Fib zone. Rejection here confirms the setup.
🎯 Target Zones Breakdown:
✅ TP1 - Weak low around 110,200
✅ TP2 - -27% Extension (~109,500)
✅ TP3 - -62% Fib extension (109,268)
🚀 Extended Target - Possible sweep of Sell Side Liquidity all the way to 108,000–107,500
This is a potential 2000+ pip move if the full extension plays out.
🧠 Market Psychology in Play:
Institutions love to trap traders long after major breakouts. That last pump into the high? It wasn’t retail demand — it was liquidity generation. Now that they’ve swept the highs, they're driving price down to rebalance and mitigate.
Every highlighted zone on this chart? It’s a Smart Money footprint.
📌 Entry Game Plan:
Watch how price behaves around the current OB zone (111,250–111,618).
If price rejects and flips back under the midpoint (111,116), that’s your trigger.
Enter with tight SL above 111,750 and aim for TP1, TP2, and trail the rest to TP3 or lower.
📈 Risk Management Reminder:
Set your SL above structure.
Don’t overleverage — this is a clean setup, but patience is 🔑.
Let price come to you, not the other way around.
✍️ Final Thoughts:
This BTCUSD setup screams Smart Money — we’ve got:
Liquidity grabs ✅
Clean OB + Fib confluence ✅
ChoCh + structural rejection ✅
Strong R:R with multiple targets ✅
This might be the move to catch before the weekend liquidity sweep.
💬 Comment "BTC MOVE" if you’re watching this with me!
🔁 Tag your trading fam who needs to see this breakdown!
1-BTCUSD

Bitcoin Remains Bulish once again, almostinner cycle 5 waeces impulse looks completed , but bigger cycle not just yet,
Sell from current levels to 103.000
Buy from 103.000 Targetting 117.000 / 123.000
GG

Bitcoin H1 | Pullback support at 23.6% Fibonacci retracementBitcoin (BTC/USD) is falling towards a pullback support and could potentially bounce off this level to climb higher.
Buy entry is at 109.174.00 which is a pullback support that aligns with the 23.6% Fibonacci retracement.
Stop loss is at 105,800.00 which is a level that lies underneath a multi-swing-low support and the 50.0% Fibonacci retracement.
Take profit is at 113,948.50 which is a resistance that aligns with the 100.0% Fibonacci projection.
High Risk Investment Warning
Trading Forex/CFDs on margin carries a high level of risk and may not be suitable for all investors. Leverage can work against you.
Stratos Markets Limited (tradu.com ):
CFDs are complex instruments and come with a high risk of losing money rapidly due to leverage. 63% of retail investor accounts lose money when trading CFDs with this provider. You should consider whether you understand how CFDs work and whether you can afford to take the high risk of losing your money.
Stratos Europe Ltd (tradu.com ):
CFDs are complex instruments and come with a high risk of losing money rapidly due to leverage. 63% of retail investor accounts lose money when trading CFDs with this provider. You should consider whether you understand how CFDs work and whether you can afford to take the high risk of losing your money.
Stratos Global LLC (tradu.com ):
Losses can exceed deposits.
Please be advised that the information presented on TradingView is provided to Tradu (‘Company’, ‘we’) by a third-party provider (‘TFA Global Pte Ltd’). Please be reminded that you are solely responsible for the trading decisions on your account. There is a very high degree of risk involved in trading. Any information and/or content is intended entirely for research, educational and informational purposes only and does not constitute investment or consultation advice or investment strategy. The information is not tailored to the investment needs of any specific person and therefore does not involve a consideration of any of the investment objectives, financial situation or needs of any viewer that may receive it. Kindly also note that past performance is not a reliable indicator of future results. Actual results may differ materially from those anticipated in forward-looking or past performance statements. We assume no liability as to the accuracy or completeness of any of the information and/or content provided herein and the Company cannot be held responsible for any omission, mistake nor for any loss or damage including without limitation to any loss of profit which may arise from reliance on any information supplied by TFA Global Pte Ltd.
The speaker(s) is neither an employee, agent nor representative of Tradu and is therefore acting independently. The opinions given are their own, constitute general market commentary, and do not constitute the opinion or advice of Tradu or any form of personal or investment advice. Tradu neither endorses nor guarantees offerings of third-party speakers, nor is Tradu responsible for the content, veracity or opinions of third-party speakers, presenters or participants.

Altcoin Season Brewing?Hi,
The OTHERS/BTC pair represents the collective market capitalization of altcoins relative to Bitcoin. This ratio is a critical indicator of altcoin strength or weakness against Bitcoin. The weekly chart reveals a prolonged bearish phase for altcoins, with Bitcoin dominance persisting. However, recent data suggests potential inflection points worth monitoring.
Key Technical Elements:
- Ascending Channel: The pair is moving within a well-defined macro upward channel. It is currently sitting at the bottom boundary, suggesting a potential reversal point.
- Support Zone: The lower boundary of the channel (purple line) aligns with previous bounce points (2019, 2020, mid-2023), reinforcing its validity.
- RSI Indicator: The RSI has shown bullish divergence with price making lower lows while RSI forms higher lows.
My Opinion:
This chart suggests we are near the bottom for altcoins vs BTC, and the risk/reward is heavily tilted in favor of a bounce, especially going into a potential Q3-Q4 altseason. It’s a classic accumulation zone where smart money tends to position.
And what to do?
- scale into altcoin positions cautiously.
- Use the channel low as a stop-loss zone.
- Look for confirmation over the next 1–2 weeks with bullish candles or increased volume.
Happy Trading,

Next Target: Right Fibonacci Ratio 2.24 (116940.43)
Hello, traders.
If you "Follow" me, you will always get the latest information quickly.
Have a nice day today.
-------------------------------------
(BTCUSDT 1D chart)
It was supported near the Fibonacci ratio 2 (106178.85) and rose to renew the new high (ATH).
If this upward trend continues, it is expected to rise near the Fibonacci ratio 2.24 (116940.43).
-
If it falls,
1st: 102302.08
2nd: 97226.92
3rd: 89294.25
You need to check which of the 1st and 3rd areas above is supported.
Since the M-Signal indicator on the 1D chart is passing near the 1st area, if it falls below this, there is a possibility that it will turn into a short-term downtrend.
The M-Signal indicator on the 1W chart is still rising around 94K, but since the 97226.92 point is the HA-High indicator point on the 1W chart, I think it is likely to continue the upward trend if it receives support around this area.
The 89294.25 point is the HA-Low indicator point on the 1D chart, so if it receives support around this area, it is a good time to buy.
-
(30M chart)
If the price continues to rise by renewing the ATH, it is difficult to set support and resistance points.
Therefore, you need to be careful when trading coins (tokens) that are renewing the ATH.
Therefore, I think it is better to trade in a short-term trading (day trading) method, but to leave the number of coins (tokens) corresponding to the profit for the profit realization method.
In other words, when the price rises and then falls by the purchase price, the method is to sell only the purchase amount (+ transaction fee) to leave the coin (token) corresponding to the profit.
When selling, you should not sell the number of coins (tokens), but you should sell only the purchase amount.
You do not necessarily have to sell all of the purchase amount, but if possible, it is better to sell close to the purchase amount.
The reason is that when the price plummets or turns downward, there is a possibility of psychological pressure.
In my chart, the trading strategy is when the HA-Low and HA-High indicators are touched.
If it is supported near the HA-Low indicator, it is the time to buy, and when it meets the HA-High indicator, it is the time to sell.
However, if it is supported near the HA-High indicator, there is a possibility that a stepwise upward trend will continue, so a split selling strategy is necessary.
On the other hand, if it falls after receiving resistance from the HA-Low indicator, it is likely to show a stepwise downtrend, so a split buying strategy is needed.
-
When you meet the HA-Low and HA-High indicators, if you check the movement of the OBV indicator, it can help you create a trading strategy.
That is, when the OBV indicator breaks upwards through the Low Line, High Line, and OBV EMA, the price is likely to rise, and if the opposite happens, the price is likely to fall.
-
Thank you for reading to the end.
I hope you have a successful trade.
--------------------------------------------------
- This is an explanation of the big picture.
(3-year bull market, 1-year bear market pattern)
I will explain more details when the bear market starts.
------------------------------------------------------

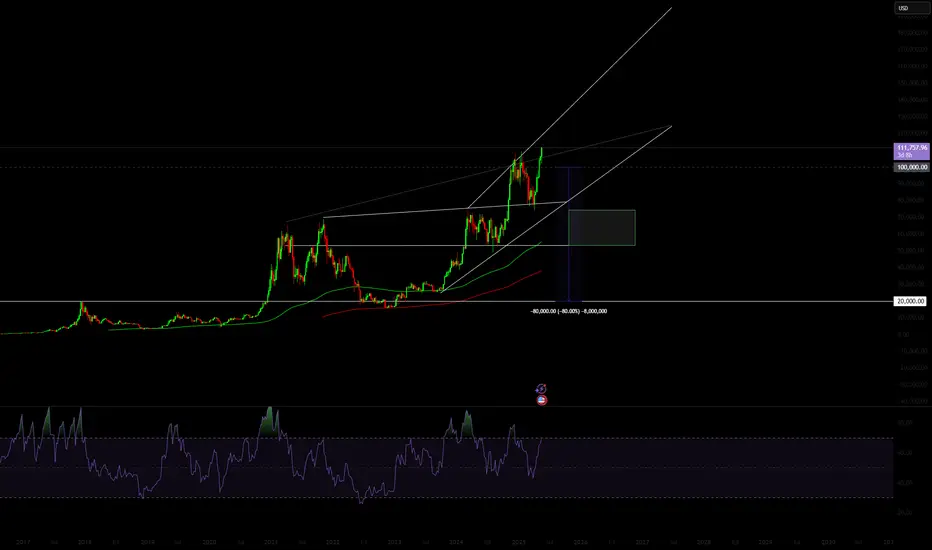
Bitcoins LinesPrice is approaching previous highs with strong bullish momentum and no major resistance until the red-marked level around 240,000. Given the breakout structure and Fibonacci confluence, the most likely scenario is continuation toward the 140,000–160,000 range before facing any significant rejection. A stop loss would be prudent just below 91,000, with the initial target set at 139,000, and extended TP zones at 155,000 and 239,000. This trade aligns with a longer-term macro trend.

BTCUSD update May 22nd, 2025I have returned and here is my updated chart. I'm such a perfectionist sometimes when it comes to lines that it takes my hours to get them exactly how I envision. To start off, yes I am bullish on Bitcoin and believe that this cycle hasn't ended yet but I will admit that I think the end of it is closer than the beginning. With that being said, I will not disappear when the bear market starts, I will simply make updates and try to catch the bottom like I did in the past. So far I am going with history and my bottom target is above 66,800 and I expect the floor to fizzle out around 71-73k; if it ends up being higher than that, great! Overall this idea is just an update for my own personal records and my prediction is based on what has happen that last time this pattern was brought to us.
Stay safe out there, happy trading, and as always--Cheers!


BTC traffic update and channel exit.As we can see, the BTC price is moving according to the previously mentioned rules. Here we can see how the price left channel number 1 at the top, and the increase after leaving the channel gave an upward movement at the level of the height of the channel itself.
In this situation, it is worth paying attention to channel number 2, from which we also previously got an exit at the top with a strong upward movement, currently we can see how the price is fighting with strong resistance at the level of $ 111,500, however, taking into account the height of channel number 2, we can mark the level of around $ 121,500 as another very strong resistance.

ETHUSDT IDEAThings still looks inside a consolidation phase and some breaks upside or downside is needed for long momentum trades.

Sensitive supportHello friends
Considering the good growth we had, you can see that the price has corrected after reaching its ceiling and has reached a sensitive support.
Now, with the price correction, there is a good opportunity to buy in stages and with capital management and move towards the specified goals.
*Trade safely with us*

TRUMPPPPPPPPPPPPPPPPPPPHello friends
Considering the good growth we had, you can see that the price formed a flag and corrected after reaching its ceiling.
Now, with the price correction, there is a good opportunity to buy in stages and with capital management and move towards the specified goals.
*Trade safely with us*

NEAR NEAR NEAR Hello friends
Considering the good growth we had, you can see that the price has corrected after reaching its ceiling.
Now, with the price correction, there is a good opportunity to buy in stages and with capital management and move towards the specified goals.
*Trade safely with us*

BITCOIN : FREE SIGNAL (DON'T MISS)Hello friends
According to the upward trend we had, you can see that the price is stuck in a channel and after the third collision with the channel ceiling, it has managed to break the channel, which indicates the power of buyers and you can buy within the specified support ranges with capital and risk management and move with it to the upcoming goals.
*Trade safely with us*

DOGS : be carefulHello friends
As you can see, after the price growth we had, the price has fallen. Given the severity of the fall, we recommend that you buy in stages, manage your risk and capital, and move with it to the specified goals.
*Trade safely with us*

SEI LIVE TRADEHello friends
Given the decline we had, we expect to experience another decline and we can open a trade in the direction of the trend with capital and risk management.
*Trade safely with us*

Buy in fear, sell in greed.Hello dears
Due to the price growth, now in the pullback you can buy in support areas in steps and move with it to the specified targets, of course with capital management.
*Trade safely with us*

Be prepared for everything...Hello dears
Given the recent growth, the price is stuck in a range and now that it has reached the bottom of the range, there are two options:
1_The price grows from here and hits our target.
2_The price continues to fall and falls to the support area below and our second buying step is activated and grows from there.
Buy a step and be ready for anything.
*Trade safely with us*

A bullish pattern was formed...Hello friends
Given the entry of buyers and the formation of an ascending pattern, you can enter into a transaction with capital and risk management and move towards the specified goals.
*Trade safely with us*

BTC hits ATH – But this hidden signal could ruin the rally!Bitcoin (BTC) has been in a steady and impressive uptrend over the past two months, with nearly seven consecutive weekly green candles forming on the chart. This sustained bullish momentum signals strong buying pressure and growing confidence among market participants. Such a consistent rally is rare and often indicates a broader shift in sentiment, suggesting that Bitcoin may be entering a new phase in its market cycle.
Price discovery
Recently, BTC broke through its previous all-time high (ATH) of 110K on the lower timeframes, a significant technical development. This breakout means BTC is now trading in price discovery territory, where there is no historical resistance to guide price action. While this opens the door for further gains, traders should remain cautious. Upcoming daily and weekly candle closes will be critical in determining whether this breakout is sustainable. For the move to be confirmed, Bitcoin needs to close multiple weekly candles above the previous ATH. If instead, the price falls back below the ATH on either this weekly close or the next, it could introduce downward pressure and potentially signal a failed breakout.
As we navigate this pivotal moment, it's crucial not to get swept up in the euphoria. While the price action is undoubtedly bullish, certain technical indicators warrant close monitoring to avoid complacency. In particular, the weekly Stochastic RSI and the weekly RSI are now at levels that deserve attention.
Stochastic RSI
The weekly Stochastic RSI is entering overbought territory, even before this week’s candle has closed. This suggests strong bullish momentum is currently driving the market. However, history shows that when the Stochastic RSI enters the overbought zone, it often marks areas where it was wise to take partial profits. If the blue and orange lines on the Stochastic RSI begin to cross back below the 80 level, it could indicate a weakening of momentum and the possibility of a short-term correction. That scenario becomes more likely if Bitcoin fails to continue making higher highs in the weeks ahead.
Relative Strenght Index (RSI)
Meanwhile, the Relative Strength Index (RSI) is approaching a critical resistance trendline. In previous market highs, we’ve seen the RSI top out at 89, followed by a high of 80 despite new highs in BTC’s price, a classic case of bearish divergence. If Bitcoin fails to push significantly higher in the coming weeks and the RSI does not break above the 80 level, we could be looking at a potential triple bearish divergence. This would be a strong warning signal that momentum is waning, and it could lead to a broader correction.
For this reason, it is crucial that Bitcoin continues to push upward with conviction. The RSI must break through its historical trendline and post a new high above 80 in order to invalidate the threat of bearish divergence. Should the market fail to do so and instead roll over, we may experience increased volatility and downside pressure as we move into the summer months.
Conclusion
In conclusion, while Bitcoin is exhibiting powerful bullish behavior and appears poised for further gains, the sustainability of this rally hinges on continued momentum and strong technical follow-through. Specifically, Bitcoin must maintain closes above its previous all-time high, avoid a bearish cross on the Stochastic RSI, and see the RSI break above its recent highs to neutralize the threat of bearish divergence. If these conditions are not met and momentum fades, the market may face a period of consolidation or correction in the near term. Staying vigilant and objectively monitoring these indicators will be essential for navigating what comes next.
Thanks for your support.
- Make sure to follow me so you don't miss out on the next analysis!
- Drop a like and leave a comment!

Bitcoin is expected to rise in a volatile upward trend.The Bitcoin market has demonstrated extremely eye-catching performance, with prices strongly breaking through key resistance levels and hitting new all-time highs. It has successfully surged past the $110,000 threshold, and Bitcoin's total market capitalization has exceeded $2.1 trillion, rising to the fifth position in the global asset market capitalization ranking, trailing only gold, Microsoft, NVIDIA, and Apple. Since May, Bitcoin has accumulated a nearly 16% gain, with a year-to-date (YTD) increase of approximately 17%, significantly outperforming U.S. equities and gold.
Most analysts believe that if Bitcoin can effectively breach the $109,000 resistance level, it is expected to test the $120,000-$150,000 range within this year. Institutions such as JPMorgan Chase and Standard Chartered Bank have provided target price forecasts of $120,000-$150,000, primarily based on factors including the current upward trend of Bitcoin, capital inflows, and market sentiment.
In the market, there are no absolutes, and neither upward nor downward trends are set in stone. Therefore, the ability to judge the balance between market gains and losses is your key to success. Let money become our loyal servant.

The Bitcoin “Big Short”: Whales Are Quietly Leaving the PartyBitcoin just broke $111,000. Headlines are celebrating. Retail is euphoric. But under the surface, on-chain data tells a very different story: wallets holding over $1,000,000 in BTC—commonly referred to as whales—are quietly exiting.
According to Glassnode, the number of $1M+ wallets has dropped by nearly 9% over the last 60 days, even as price soared to new highs. This isn't a coincidence. It's the classic distribution phase—whales cashing out while late-stage buyers, lured in by ETF hype and bullish momentum, absorb the risk.
Bloomberg Crypto reported this month that over $10 billion in BTC has been moved from cold storage to exchanges, much of it from long-dormant wallets and miner reserves. This pattern echoes what we saw before the 2021 crash—strategic selling into strength.
ETFs: Fuel and Trap
Spot Bitcoin ETFs were pitched as the final gateway to mass adoption. In reality, they’re a liquidity funnel. Retail investors pile in via retirement accounts and brokerages, buying exposure—but not the asset itself. Meanwhile, institutional whales sell BTC into these passive flows.
As Bloomberg’s ETF Weekly noted in May 2025, “The majority of ETF inflows are retail-led, while OTC desks are reporting increased large-lot sell requests.” It’s a perfect storm: passive inflows mask whale exits, and the average buyer is blind to what’s really happening on-chain.
On-Chain Red Flags
The blockchain doesn’t lie. Key warning signs are flashing:
$1M+ wallets falling: Down from ~139K to ~126K since March.
Exchange reserves rising: Indicating coins are being positioned for liquidation.
Long-term holder profit-taking: SOPR is above 1.6—profit margins not seen since the last major top.
Dormant coins awakening: Older UTXOs (2+ years) are being spent at the fastest rate since late 2021.
Even miners are capitulating. Miner-held balances are down 12% YTD, and transfer spikes suggest they're taking advantage of inflated prices to fund operations.
Why It Matters
This isn’t FUD. It’s math. When the most informed market participants offload supply into a leveraged, overextended retail-driven rally, the result is rarely soft. If BTC loses key support around $95K, the slide to $60K—or lower—could be violent and fast.
The chart may look bullish. But the blockchain shows distribution, not accumulation. The whales aren’t tweeting. They’re cashing out.
Retail is late to the party. The smart money is already gone.
BTC is high! Any Weakness?If you find this information inspiring/helpful, please consider a boost and follow! Any questions or comments, please leave a comment!
Bitcoin Breaks to All-Time Highs — What’s Next for Price Structure?
Bitcoin has officially pushed into new all-time highs, and while the move wasn’t entirely unexpected, it still packs a punch. We discussed this possibility in recent videos, though I wasn’t fully convinced at the time. That’s the nature of trading—uncertainty is the cost of admission, and conviction builds as structure confirms.
As always, I was watching the price action closely. BTC started providing the clues needed to lean into the more bullish interpretation. The levels held. The flips were clean. Momentum lined up.
That said, I did take some speculative shorts at lower degrees—not to fight the trend, but to respect possible overextensions within the count. For those following the Elliott Wave roadmap, these intraday reactions were worth probing, but nothing confirmed a larger reversal yet.
The key now is structure.
We’re currently navigating uncharted territory, and in these zones, understanding wave context and market behavior around prior resistance becomes even more critical. There’s no overhead supply—only psychology, fib projections and profit-taking to watch for.
Here’s what I’m focused on:
Clear labeling of the motive sequence—is this the end of a Wave 3 or just a smaller subdivision?
Volume behavior and momentum divergence—looking for any signals that we’re near exhaustion.
Pullback zones—marking areas where Wave 4 or consolidation might emerge, if it’s due.
This is a time to stay sharp, not euphoric.
Trade safe, trade smart, trade clarity.
