Buy in fear, sell in greed.Hello dears
Due to the price growth, now in the pullback you can buy in support areas in steps and move with it to the specified targets, of course with capital management.
*Trade safely with us*
1-BTCUSD

Be prepared for everything...Hello dears
Given the recent growth, the price is stuck in a range and now that it has reached the bottom of the range, there are two options:
1_The price grows from here and hits our target.
2_The price continues to fall and falls to the support area below and our second buying step is activated and grows from there.
Buy a step and be ready for anything.
*Trade safely with us*

A bullish pattern was formed...Hello friends
Given the entry of buyers and the formation of an ascending pattern, you can enter into a transaction with capital and risk management and move towards the specified goals.
*Trade safely with us*

BTC hits ATH – But this hidden signal could ruin the rally!Bitcoin (BTC) has been in a steady and impressive uptrend over the past two months, with nearly seven consecutive weekly green candles forming on the chart. This sustained bullish momentum signals strong buying pressure and growing confidence among market participants. Such a consistent rally is rare and often indicates a broader shift in sentiment, suggesting that Bitcoin may be entering a new phase in its market cycle.
Price discovery
Recently, BTC broke through its previous all-time high (ATH) of 110K on the lower timeframes, a significant technical development. This breakout means BTC is now trading in price discovery territory, where there is no historical resistance to guide price action. While this opens the door for further gains, traders should remain cautious. Upcoming daily and weekly candle closes will be critical in determining whether this breakout is sustainable. For the move to be confirmed, Bitcoin needs to close multiple weekly candles above the previous ATH. If instead, the price falls back below the ATH on either this weekly close or the next, it could introduce downward pressure and potentially signal a failed breakout.
As we navigate this pivotal moment, it's crucial not to get swept up in the euphoria. While the price action is undoubtedly bullish, certain technical indicators warrant close monitoring to avoid complacency. In particular, the weekly Stochastic RSI and the weekly RSI are now at levels that deserve attention.
Stochastic RSI
The weekly Stochastic RSI is entering overbought territory, even before this week’s candle has closed. This suggests strong bullish momentum is currently driving the market. However, history shows that when the Stochastic RSI enters the overbought zone, it often marks areas where it was wise to take partial profits. If the blue and orange lines on the Stochastic RSI begin to cross back below the 80 level, it could indicate a weakening of momentum and the possibility of a short-term correction. That scenario becomes more likely if Bitcoin fails to continue making higher highs in the weeks ahead.
Relative Strenght Index (RSI)
Meanwhile, the Relative Strength Index (RSI) is approaching a critical resistance trendline. In previous market highs, we’ve seen the RSI top out at 89, followed by a high of 80 despite new highs in BTC’s price, a classic case of bearish divergence. If Bitcoin fails to push significantly higher in the coming weeks and the RSI does not break above the 80 level, we could be looking at a potential triple bearish divergence. This would be a strong warning signal that momentum is waning, and it could lead to a broader correction.
For this reason, it is crucial that Bitcoin continues to push upward with conviction. The RSI must break through its historical trendline and post a new high above 80 in order to invalidate the threat of bearish divergence. Should the market fail to do so and instead roll over, we may experience increased volatility and downside pressure as we move into the summer months.
Conclusion
In conclusion, while Bitcoin is exhibiting powerful bullish behavior and appears poised for further gains, the sustainability of this rally hinges on continued momentum and strong technical follow-through. Specifically, Bitcoin must maintain closes above its previous all-time high, avoid a bearish cross on the Stochastic RSI, and see the RSI break above its recent highs to neutralize the threat of bearish divergence. If these conditions are not met and momentum fades, the market may face a period of consolidation or correction in the near term. Staying vigilant and objectively monitoring these indicators will be essential for navigating what comes next.
Thanks for your support.
- Make sure to follow me so you don't miss out on the next analysis!
- Drop a like and leave a comment!

Bitcoin is expected to rise in a volatile upward trend.The Bitcoin market has demonstrated extremely eye-catching performance, with prices strongly breaking through key resistance levels and hitting new all-time highs. It has successfully surged past the $110,000 threshold, and Bitcoin's total market capitalization has exceeded $2.1 trillion, rising to the fifth position in the global asset market capitalization ranking, trailing only gold, Microsoft, NVIDIA, and Apple. Since May, Bitcoin has accumulated a nearly 16% gain, with a year-to-date (YTD) increase of approximately 17%, significantly outperforming U.S. equities and gold.
Most analysts believe that if Bitcoin can effectively breach the $109,000 resistance level, it is expected to test the $120,000-$150,000 range within this year. Institutions such as JPMorgan Chase and Standard Chartered Bank have provided target price forecasts of $120,000-$150,000, primarily based on factors including the current upward trend of Bitcoin, capital inflows, and market sentiment.
In the market, there are no absolutes, and neither upward nor downward trends are set in stone. Therefore, the ability to judge the balance between market gains and losses is your key to success. Let money become our loyal servant.

The Bitcoin “Big Short”: Whales Are Quietly Leaving the PartyBitcoin just broke $111,000. Headlines are celebrating. Retail is euphoric. But under the surface, on-chain data tells a very different story: wallets holding over $1,000,000 in BTC—commonly referred to as whales—are quietly exiting.
According to Glassnode, the number of $1M+ wallets has dropped by nearly 9% over the last 60 days, even as price soared to new highs. This isn't a coincidence. It's the classic distribution phase—whales cashing out while late-stage buyers, lured in by ETF hype and bullish momentum, absorb the risk.
Bloomberg Crypto reported this month that over $10 billion in BTC has been moved from cold storage to exchanges, much of it from long-dormant wallets and miner reserves. This pattern echoes what we saw before the 2021 crash—strategic selling into strength.
ETFs: Fuel and Trap
Spot Bitcoin ETFs were pitched as the final gateway to mass adoption. In reality, they’re a liquidity funnel. Retail investors pile in via retirement accounts and brokerages, buying exposure—but not the asset itself. Meanwhile, institutional whales sell BTC into these passive flows.
As Bloomberg’s ETF Weekly noted in May 2025, “The majority of ETF inflows are retail-led, while OTC desks are reporting increased large-lot sell requests.” It’s a perfect storm: passive inflows mask whale exits, and the average buyer is blind to what’s really happening on-chain.
On-Chain Red Flags
The blockchain doesn’t lie. Key warning signs are flashing:
$1M+ wallets falling: Down from ~139K to ~126K since March.
Exchange reserves rising: Indicating coins are being positioned for liquidation.
Long-term holder profit-taking: SOPR is above 1.6—profit margins not seen since the last major top.
Dormant coins awakening: Older UTXOs (2+ years) are being spent at the fastest rate since late 2021.
Even miners are capitulating. Miner-held balances are down 12% YTD, and transfer spikes suggest they're taking advantage of inflated prices to fund operations.
Why It Matters
This isn’t FUD. It’s math. When the most informed market participants offload supply into a leveraged, overextended retail-driven rally, the result is rarely soft. If BTC loses key support around $95K, the slide to $60K—or lower—could be violent and fast.
The chart may look bullish. But the blockchain shows distribution, not accumulation. The whales aren’t tweeting. They’re cashing out.
Retail is late to the party. The smart money is already gone.
BTC is high! Any Weakness?If you find this information inspiring/helpful, please consider a boost and follow! Any questions or comments, please leave a comment!
Bitcoin Breaks to All-Time Highs — What’s Next for Price Structure?
Bitcoin has officially pushed into new all-time highs, and while the move wasn’t entirely unexpected, it still packs a punch. We discussed this possibility in recent videos, though I wasn’t fully convinced at the time. That’s the nature of trading—uncertainty is the cost of admission, and conviction builds as structure confirms.
As always, I was watching the price action closely. BTC started providing the clues needed to lean into the more bullish interpretation. The levels held. The flips were clean. Momentum lined up.
That said, I did take some speculative shorts at lower degrees—not to fight the trend, but to respect possible overextensions within the count. For those following the Elliott Wave roadmap, these intraday reactions were worth probing, but nothing confirmed a larger reversal yet.
The key now is structure.
We’re currently navigating uncharted territory, and in these zones, understanding wave context and market behavior around prior resistance becomes even more critical. There’s no overhead supply—only psychology, fib projections and profit-taking to watch for.
Here’s what I’m focused on:
Clear labeling of the motive sequence—is this the end of a Wave 3 or just a smaller subdivision?
Volume behavior and momentum divergence—looking for any signals that we’re near exhaustion.
Pullback zones—marking areas where Wave 4 or consolidation might emerge, if it’s due.
This is a time to stay sharp, not euphoric.
Trade safe, trade smart, trade clarity.

BTC - Why THIS TIME is DIFFERENT (⊙ˍ⊙)This time IS DIFFERENT. Bitcoin has made a new ATH as I predicted in a few previous posts, but something's off...🤔
If we look at BTC from a macro view, the dates for this run up was quite extended. We do see some similarities in terms of the retracement (highlighted in blue) but from a timeframe analysis, there is no comparing this high to the previous:
stretching from March to October where classical bear market symptoms were show - lower highs and lower lows, with a duration unlike any of the previous cycles.
Interestingly, the previous season we increased not even 7% from the previous peak. And if we were to look at the same fractal, that places us around $116k.
But the ONE thing, that has had me suspicious this entire time (🥁) was ETH. Overlaying the ETH chart, we see that historically, ETH peaked a week or two after the BTC ATH - until this time.
The fact that BTC made such a dramatic ATH and Ethereum didn't? That was a new one. And even up to now, ETH is still 80% away only from it's previous ATH - imagine the altseason we will have IF ETH makes a new ATH... or will this time just be , different ?

BITCOIN (BTCUSD): The Next Resistances
As Bitcoin is trading in the no man's land again,
violating a resistance cluster based on a previous ATH,
here are the next potentially strong resistance to watch.
Resistance 1: Narrow area based on 115000 level - the closest strong
psychological level.
Resistance 2: Narrow area based on 120000 level - the next
psychological level.
Resistance 1 is going to be the next goal for the buyers
and will most likely reached soon.
Its breakout will push the prices to Resistance 2.
❤️Please, support my work with like, thank you!❤️

XRUSDT IDEAWe can see a consolidation on the daily time frame. Btc has reached to new highs but alternate coins have not moved along with same motivation. Why?

SPY/QQQ Plan Your Trade For 5-22 : Inside Breakaway CountertrendToday's Inside Breakaway in Countertrend mode suggests the markets may attempt to move downward - away from the recent highs.
I believe the SPY/QQQ will move into a sideways/consolidation range over the next 3-5+ trading days before attempting to make any big moves. We have a holiday-shortened trading week next week, and I believe the markets are moving into the Summer doldrums.
Overall, I would ask traders to stay cautious of this transition in the markets over the next 5--10+ days and prepare for volatility to increase after June 1st.
You all know what I believe is the most likely outcome - a rollover topping pattern followed by a breakdown in price targeting the 525-535 level on the SPY. We'll see what happens going forward.
Gold and Silver pullback back overnight which suggests the metals markets were a bit overheated to the upside. I still believe Metals will continue to push higher.
BTCUSD is trading up above $111k. Here we go.
BTCUSD is moving up into the potential rejection level that I suggested in my 5-20 video as a MASSIVE WARNING setup.
This is where we'll see how BTCUSD plays out - if we continue to push higher or if we REJECT and move into a broad downtrend.
I didn't expect it to happen only TWO DAYS after my video - but here we are.
Time to get muddy and play what price puts in front of us.
Get some.
#trading #research #investing #tradingalgos #tradingsignals #cycles #fibonacci #elliotwave #modelingsystems #stocks #bitcoin #btcusd #cryptos #spy #gold #nq #investing #trading #spytrading #spymarket #tradingmarket #stockmarket #silver

Cryptocurrency: Analyzing the Digital Asset RevolutionSince Bitcoin’s creation in 2009, cryptocurrencies have evolved from a niche tech experiment into a dynamic sector disrupting global finance. Grounded in decentralization and blockchain technology, cryptocurrencies aim to remove intermediaries and redefine money.
Key Characteristics
Decentralization: Operate on peer-to-peer networks, free from central authority.
Blockchain Technology: Immutable, transparent ledger ensures trust and security.
Tokenization: Real-world assets like real estate or art can be turned into digital tokens.
Market Dynamics
As of 2024, total crypto market cap exceeded $2.5 trillion.
Bitcoin remains the dominant asset, but Ethereum’s smart contract ecosystem has catalyzed massive growth across DeFi and NFTs.
Opportunities and Risks
Opportunities:
Financial Inclusion: Access for the unbanked via mobile wallets and stablecoins.
Innovation: Enabling decentralized apps, automated lending, and cross-border payments.
Risks:
Regulatory Uncertainty: Governments are actively evaluating oversight frameworks.
Volatility: Sudden price swings create high risk for investors.
Security: Hacks and scams continue to plague the sector, especially in DeFi.
Conclusion
Cryptocurrencies have launched a financial paradigm shift, but for mass adoption to take root, regulation, user protection, and scalability must mature.

Maybe your biggest risk is your biggest chance !!!Bitcoin will reach $130k with a slight price correction.
my previous analysis in last year !!
Give me some energy !!
✨We spend hours finding potential opportunities and writing useful ideas, we would be happy if you support us.
Best regards CobraVanguard.💚
_ _ _ _ __ _ _ _ _ _ _ _ _ _ _ _ _ _ _ _ _ _ _ _ _ _ _ _ _ _ _ _
✅Thank you, and for more ideas, hit ❤️Like❤️ and 🌟Follow🌟!
⚠️Things can change...
The markets are always changing and even with all these signals, the market changes tend to be strong and fast!!

Bitcoin: 106K Breakout To 113K Resistance.Bitcoin is attempting to break out of a minor consolidation which is a typical momentum continuation pattern. The updated wave count illustrates the potential (113K area) IF this breakout follows through over the coming week. While the structure is clearly bullish, I suspect this is a 5th of a 5th wave relative to the wave structure dating back to the 2017 peak (weekly chart). For traders this offers plenty of opportunities particularly on the long side, BUT for investors this means the higher it goes, the GREATER the risk. In other words, a break out to new highs should be considered an opportunity to take profits or reduce risk. Wave 5's typically appear to be the "best" time to get involved in a market, but offer the LEAST potential and the greatest risk.
I was not able to write my analysis over the previous week because I was hosting the ICTC 2025 (link in signature). My analysis the week before that was still bullish but I was anticipating a broader retrace which never materialized. Again the key in this game is ADJUSTING, not getting stuck on opinions. IF the 106K is compromised, and the daily candle closes strong, the breakout is more likely to follow through. This can lead price back to the 109K all time high. Since Wave 5's typically go higher than the Wave 3 peak, the next price objective is the 113K area which is proportional to Wave 1 on this impulse (similar length) when projected from the consolidation breakout (see illustration).
It is possible that Wave 5 can extend further, because the broader price structure is bullish. The mistake to avoid is thinking "it's just getting started". The further it goes, the greater the risk. Longer term investors are MOST vulnerable in situations like this because they are more likely to follow the "hype" that surrounds such moves while be completely ignorant to the shrinking shorter term potential. Wave 5's often characterize the idea that the majority of participants who were going to buy have bought, which means there will be much less potential demand in the near future.
This concept is NOT to be confused with long term fundamentals which often don't change. What changes is the sentiment and sentiment is what motivates price. The recent corrective move to the 76K low also illustrates this phenomenon. Fundamentally there was no reason for price to be pushing such lows. Such a move was provoked by the "perceived" risks brought on by the tariff drama which we know now was nothing more than a knee jerk reaction and an enormous buying opportunity for those who have the ability to see through the hype (read my analysis of that time).
In my opinion the best way to navigate this market is on smaller time frames. Anywhere from 1 minute to 4H offers more precise price references to mitigate risk from. Another consideration is if you plan to trade the broader time frame, use smaller than usual sizing if you plan to dollar cost average into higher prices. The trend is clearly BULLISH which means support levels are more likely to hold while resistances are likely to break. Expect more from longs and LESS from shorts. Short setups, while tempting are going to be lower probability. This should only be done by more experienced traders who understand how to manage the elevated risk. This is the mindset I will maintain UNTIL the market proves otherwise.
Thank you for considering my analysis and perspective.

BTC/USD: Structural Breakout of Curved Resistance – Eyes on $116Technical Overview:
Bitcoin (BTC) has successfully completed a significant technical breakout after months of accumulation and resistance interaction. The chart highlights a precise market structure where price has moved from a phase of consolidation into a confirmed bullish breakout, with a clearly defined target and invalidation level.
1. SR Interchange Zone (Support-turned-Resistance):
From May to October 2024, BTC price action was trapped in a sideways range, marked by an extended accumulation phase between approximately $60,000 to $73,000. This zone acted as a historical resistance level during the downtrend, but was later flipped into support, forming a classic SR Interchange — a foundational concept in market structure analysis.
This area provided a strong base from which BTC launched its late 2024 rally.
2. Consolidation Below Curved Resistance (Dec 2024 – Apr 2025):
Following a steep bullish impulse, BTC entered a multi-month consolidation phase, forming a rounded top pattern — shown on the chart as the Black Mind Curve Resistance. This curved resistance represented a psychological and structural ceiling, suppressing bullish momentum and trapping liquidity.
Price action was tightly compressed under this dynamic resistance curve, with multiple failed breakout attempts. This period was marked by range-bound volatility and low directional commitment — classic behavior during a re-accumulation phase.
3. Breakout of Black Mind Curve Resistance (May 2025):
A major technical event occurred as BTC broke decisively above the Black Mind Curve Resistance, accompanied by a surge in bullish momentum. This move not only invalidated the prior rounding top structure but also confirmed a trend continuation breakout.
The breakout was clean, with strong follow-through volume and a higher high structure above the Major Horizontal Resistance Zone (~$105,000–$109,000) — now confirmed as flipped support.
4. Bullish Continuation & Price Target:
Following the breakout, BTC has established a higher low and continued its upward trajectory toward the marked target zone at $116,065. This zone coincides with:
Previous untested supply levels
Technical Fibonacci extension (1.272–1.618 zone)
Measured move from the curve structure base
With current momentum and structure intact, BTC remains bullishly biased until it either reaches the target zone or breaks below the invalidation level.
5. Invalidation & Risk Management:
A close below $102,005 — the defined SI (Support-Invalidation) level — would be considered structurally bearish. This level represents:
The most recent higher low
Base of the breakout structure
Re-entry into previous consolidation range
A breakdown below this level would invalidate the bullish thesis and may open the door for a deeper pullback toward $95,000 or even $88,000.
✅ Conclusion:
The breakout of the Black Mind Curve Resistance marks a significant technical shift in Bitcoin’s trend. With momentum in favor of the bulls and market structure supporting higher prices, BTC appears poised to test the $116,000 target zone in the short to mid-term — barring a breakdown below key support.
📌 Key Levels Recap:
Level Type Price
Target Zone $116,065
Current Price $110,902
Support / Invalidation (SI) $102,005
📈 Strategy Outlook:
Bias: Bullish
Entry Area: Retest of $107,000–$109,000 (if offered)
Target: $116,065
Stop-Loss: Below $102,005 (structural invalidation)
💬 Stay focused on structure, not emotions. The best trades are born from patience, not prediction.
Let me know if you'd like a summary version for use on social media or a custom signature block for your TradingView profile.

Bitcoin Overextended? Watch These Key Levels for the Next Move!BTC/USDT 1H – Retrace Before the Next Leg? 🚦
Bitcoin has shown impressive strength recently. On the 1-hour chart the current price action looks overextended 📈. After a strong impulsive move up, we’re seeing signs of exhaustion, with price stalling near the $111,800 region. Liquidity appears thin on the buy side, and there’s a cluster of potential sell stops resting below the current high in the form of sell stop.
I’m anticipating a retrace into the Fibonacci zone, with key levels at the 50% - 61.8% retracement. This area aligns with previous consolidation and could act as a magnet for price, especially as liquidity is swept from late long positions. If we see price rotate and break structure bullishly at my point of interest, I’ll be looking for a long entry opportunity. 🔄
Fundamentals & Macro Backdrop 🌍
On the fundamental side, Bitcoin remains sensitive to macroeconomic and geopolitical developments. Ongoing uncertainty in global politics and central bank policy continues to drive volatility across risk assets. Bitcoin’s correlation with tech stocks and the NASDAQ remains significant—recent data shows that when the NASDAQ pulls back, Bitcoin often follows suit. If we see a correction in tech stocks, be prepared for a retrace in BTC as well. 📉
Institutional interest is still strong, but short-term sentiment is cautious as traders await clarity on inflation, interest rates, and regulatory news. Keep an eye on U.S. economic data releases and any major headlines out of Washington or global hotspots, as these can quickly shift risk appetite.
Fundamentals and macro news remain key drivers—stay nimble!
Let’s see if BTC can reload for another leg up, or if broader market weakness drags it lower. Trade safe! 🚀

May 21 Bitcoin Bybit chart analysisHello
It's a Bitcoinguide.
If you have a "follower"
You can receive comment notifications on real-time travel routes and major sections.
If my analysis is helpful,
Please would like one booster button at the bottom.
This is the Nasdaq 30-minute chart.
There is no separate indicator announcement today.
After the red finger chase purchase,
I explained the main demand section drawing and price.
I applied it to Bitcoin as is.
This is a Bitcoin 30-minute chart.
At the bottom left, the purple finger
connects the strategy to the long position entry section that was entered on the 20th.
*When the red finger moves,
it is a one-way long position strategy.
1. $105,263.7 long position entry section / stop loss price when the sky blue support line is broken
2. $108,207.6 long position 1st target -> Top 2nd target -> Good 3rd target price
The 1st section at the top is the rising wave confirmation section,
and the strategy is more likely to succeed if the purple support line is broken after the touch.
(If it goes up right away, there is a possibility of a vertical rise)
Red finger long hold
If it goes down right away without touching, it is the final long hold strategy at 2.
From the 2nd section deviation, I marked Bottom -> 3
Since the mid-term pattern was broken yesterday,
you should succeed in rebounding within the green support line if possible.
Up to this point, I ask that you simply use my analysis for reference and use,
and I hope that you operate safely with principle trading and stop loss prices.
Thank you.

My buy view for BTCFollowing my previous analysis, BTC has retraced back to around $95K zone.
If the zone continues to hold, we should expect BTC to continue to rally towards north.
Lets keep our eyes on $100K target if the support zone of $95 holds strong

The BTC/USD Short PlayNew high, new trend lines.
I saw a correction coming on the charts, using two trendline - 1 as my trend, the second as my safety, I set up a short for a lower level profit target.

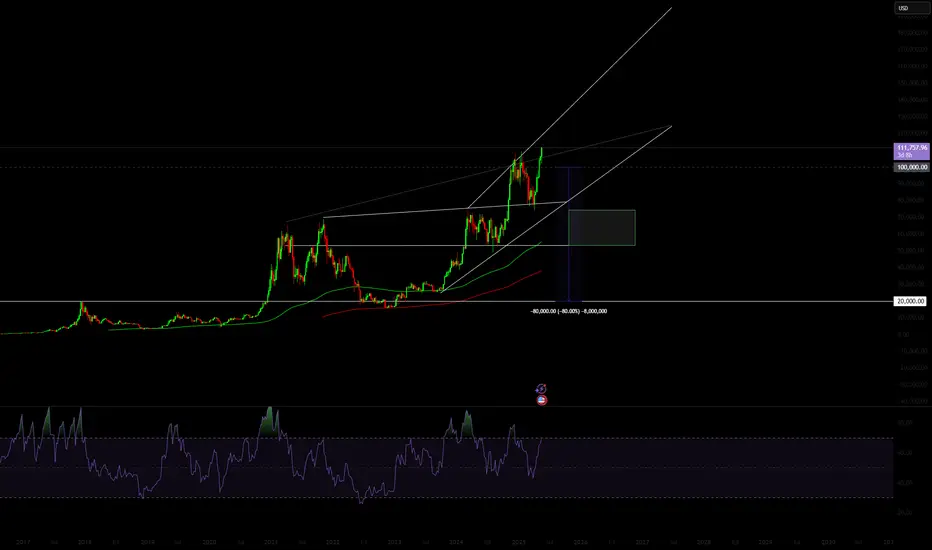
BITCOIN made new ATH but still much time left before a Cycle topBitcoin (BTCUSD) is about to enter the final week of May, with the month mostly likely to close on a strong green candle, the 2nd straight. Though it made yesterday a new All Time High (ATH) above 109k and many are already talking about a bearish reversal, this chart shows that there is still plenty of time left before the current Bull Cycle tops.
If fact a simple measurement of the Bottom to Bottom and Bottom to Top ranges of the last 3 Cycles is enough to present all the evidence that are needed for this case.
As you can see, the previous 2 Bull Cycles lasted for 35 months (1065 days) from Bottom to Top. Similarly, the Bottom to Bottom (Bear Cycle to Bear Cycle) measurement has been 47 months (1430 days).
This amazing symmetry suggest that BTC is more likely than not to repeat this feat on the current Cycle as well. A 35 month range from Top to Top indicates that the Bull Cycle is expected to peak on October 2025, while a 47 month Bottom to Bottom range indicates that the next Bear Cycle should bottom in October 2026! As far as a potential price top is concerned, various of the previous analyses we've conducted show that $200k is a fair maximum, but the current study focuses on the timing of profit taking and not specific price levels.
So are you willing to book your profits by this October? Feel free to let us know in the comments section below!
-------------------------------------------------------------------------------
** Please LIKE 👍, FOLLOW ✅, SHARE 🙌 and COMMENT ✍ if you enjoy this idea! Also share your ideas and charts in the comments section below! This is best way to keep it relevant, support us, keep the content here free and allow the idea to reach as many people as possible. **
-------------------------------------------------------------------------------
💸💸💸💸💸💸
👇 👇 👇 👇 👇 👇


Hellena | BITCOIN (4H): LONG to resistance area of 110,000.Colleagues, I believe that the upward movement is not over yet, so I move wave “3” higher as prolonged.
I believe that the price will reach a strong resistance level of 110,000.
A small correction is possible, as usual.
Manage your capital correctly and competently! Only enter trades based on reliable patterns!

