SPY/QQQ Plan Your Trade Update Update For 4-2 : ConsolidationThis quick update shows why I believe the SPY/QQQ will struggle to make any big move as long as we stay within the 382-618 "Battle Zone".
The SPY continues to rally up into this zone and stall out. If the SPY stays within this zone, I believe the markets will simply roll around in a tight range and go nowhere today.
Thus, I published this article to warn traders not to expect any big trends until we breakout - away from this Fibonacci "Battle Zone".
You can't kick the markets to make it go anywhere. And, unless you are trading very short-term swings in price - you are probably better off sitting on the sidelines waiting for a broad market trend to establish.
This is a warning. As long as we stay in the Fibonacci "Battle Zone", price will struggle to build any major trend.
So, play your trades accordingly - or just take a break from trading while you wait for the markets to roll out of the "Battle Zone".
Get some.
#trading #research #investing #tradingalgos #tradingsignals #cycles #fibonacci #elliotwave #modelingsystems #stocks #bitcoin #btcusd #cryptos #spy #gold #nq #investing #trading #spytrading #spymarket #tradingmarket #stockmarket #silver
1-BTCUSD

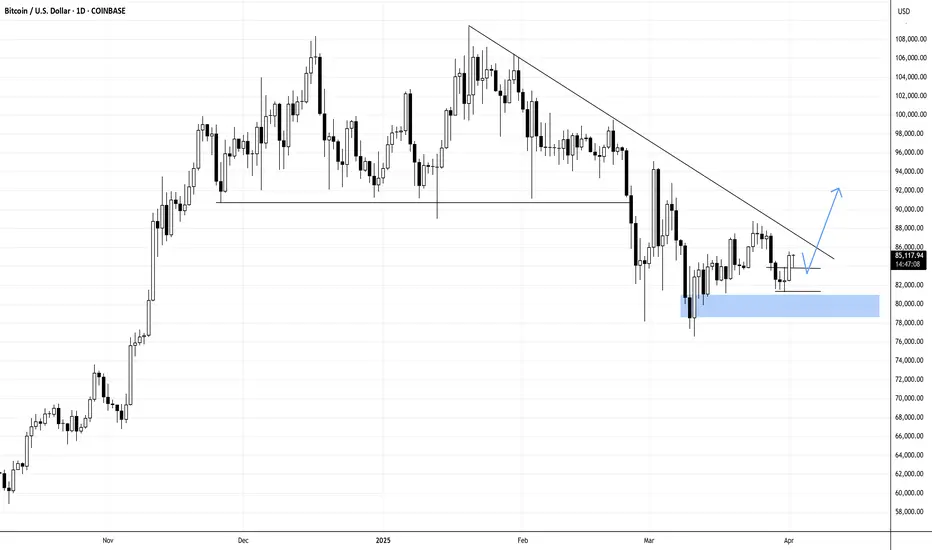
BTC Major Breakout - Symmetrical TriangleBTC is currently trading in a symmetrical triangle. This pattern is indecisive and has a 50/50 chance of breaking to the upside or downside. Meaning in the coming days or weeks, BTC will have a major breakout.
My guess would be to the downside but honestly, the direction wont be clear until it actually breaks out.

SPY/QQQ Plan Your Trade For 4-2 : GAP Reversal Counter TrendToday's pattern suggests price may attempt to move downward in early trading, trying to find support near recent lows, then potentially roll a bit higher.
I do expect price to move into a downward price trend - attempting to break below the 549 price level and targeting the 535-545 target Fib level this week.
Today, Thursday, and Friday are all GAP/Breakaway types of patterns. So we should be entering an expansion of price trend and I believe that trend will be to the downside.
Gold and Silver are nearing a Flag Apex level. Very exciting for a potential breakout rally driving Gold up above $3250 and Silver up above $36.
I personally believe there is nothing stopping Gold and Silver in this rally phase until Gold reaches levels above $4500. GET SOME.
BTCUSD had a very interesting spike low. I still believe BTCUSD will roll downward - targeting the $76-78k level, then break downward towards the $60k level. Time will tell.
The rest of this week should be very exciting with the Breakaway and GAP patterns.
Get some.
#trading #research #investing #tradingalgos #tradingsignals #cycles #fibonacci #elliotwave #modelingsystems #stocks #bitcoin #btcusd #cryptos #spy #gold #nq #investing #trading #spytrading #spymarket #tradingmarket #stockmarket #silver

BTC-----More around 83300, target 85000 areaTechnical analysis of BTC contract on April 2: Today, the large-cycle daily level closed with a small positive line yesterday, and the K-line pattern was a single positive line with continuous negatives. The price was at a low level, and the attached indicator was a golden cross with a shrinking volume. In the big trend, the decline was very obvious, and the pullback was difficult to continue. The probability of breaking the previous high point was even smaller. Instead, it was easy to fall under pressure and break the low. This is the trend law, not speculation; the four-hour chart showed a pullback trend for two consecutive trading days. The K-line rose and fell after a continuous positive yesterday. The current K-line pattern was a continuous negative. From the technical indicators, the current correction will enter the second stage of the downward trend. The short-cycle hourly chart yesterday's US market rose to a high in the early morning and continued to fall in the morning. The current K-line pattern was a continuous negative, and the attached indicator was a dead cross. Then there is a high probability of falling during the day, depending on the strength and the breakout of the European market.
Today's BTC short-term contract trading strategy: Sell at the 85,000 area of the pullback, stop loss at the 85,500 area, and target the 84,000-83,500 area;

Tariff Tensions, Dollar Dips & Gold’s Record Rally!"As of April 2, 2025, the financial markets have been significantly influenced by recent economic data releases and geopolitical developments, particularly concerning the U.S. Dollar Index (DXY), gold (XAU/USD), and Bitcoin (BTC/USD).
1. Key Economic Data Reports and Their Impact:
U.S. Dollar Index (DXY): The DXY has experienced fluctuations due to recent economic indicators and policy announcements. The Job Openings and Labor Turnover Survey (JOLTS) reported softer figures, indicating a slight cooling in the labor market. Additionally, the Institute for Supply Management (ISM) released data reflecting a slowdown in manufacturing activity. These reports have contributed to a marginal decline in the DXY, which decreased by 0.02% to 104.2418 on April 2 .Financial TimesTrading Economics
Gold (XAU/USD): Gold prices have surged to record highs, nearing $3,150 per ounce. This increase is largely driven by investor concerns over potential economic slowdowns and uncertainties surrounding impending tariff announcements by President Trump . The anticipation of these tariffs has led investors to seek safe-haven assets, bolstering demand for gold.
Bitcoin (BTC/USD): Bitcoin has shown signs of recovery, trading above $84,000 with a nearly 2% gain in the past 24 hours . This rebound follows weeks of price weakness and is occurring amid the backdrop of upcoming tariff announcements, which have introduced volatility into the cryptocurrency markets.
2. Implications of the Data Reports:
Labor Market and Manufacturing Data: The softer JOLTS figures and the ISM manufacturing slowdown suggest a potential deceleration in economic growth. These indicators may influence the Federal Reserve's monetary policy decisions, potentially impacting interest rates and, consequently, the strength of the U.S. dollar.The Guardian+3EWF Pro+3KuCoin+3
Tariff Announcements: The anticipation of new tariffs has heightened market uncertainty. Investors are closely monitoring these developments, as they could have significant implications for international trade relations and economic stability. Such uncertainties often lead to increased demand for safe-haven assets like gold and can introduce volatility into both traditional and digital asset markets.
3. Major Contributors to Recent Market Movements:
Tariff Uncertainty: President Trump's impending announcement of new tariffs has been a primary driver of recent market volatility. The potential for widespread tariffs has led to concerns about a global economic slowdown, prompting shifts in investor sentiment .
Investor Sentiment and Safe-Haven Demand: The uncertainty surrounding trade policies has led investors to seek refuge in assets perceived as safe havens, such as gold. This shift has contributed to the significant rise in gold prices.
Cryptocurrency Market Dynamics: While Bitcoin has faced headwinds from global trade tensions, it has also shown resilience. Analysts suggest that traders may be overstating the impact of the U.S.-led tariff war on Bitcoin's price, indicating that other factors, such as market sentiment and technological developments, also play crucial roles .
In summary, the recent economic data releases and the anticipation of new tariffs have collectively influenced the DXY, gold, and Bitcoin markets. Investors are advised to monitor these developments closely, as they have the potential to significantly impact market dynamics in the near term.

BITCOIN!BTCUSD!
N.B!
- BTCUSD price might not follow the drawn lines . Actual price movements may likely differ from the forecast.
- Let emotions and sentiments work for you
- ALWAYS Use Proper Risk Management In Your Trades
#ethusd
#crypto
#btcusd
#BTC Dominance: This is when ALTS will start Rallying!!BTC Dominance Update by Cryptorphic
🚨 Crossover Alert 🚨
Looking at the current BTC Dominance chart, we can see that the 21 WMA (Blue) and the 50 WMA (Red) are moving almost parallel to each other. A key moment to watch for is when the 21 WMA crosses below the 50 WMA. This will be a strong confirmation of a potential trend reversal.
🔴 Historical Context:
- The previous crossover led to a significant drop in BTC dominance, triggering altcoins to rally.
- The current market structure shows BTC dominance at a crucial resistance level. We are looking for a possible rejection at this level, which could signal an entry point for altcoins.
📈 Price Action:
- BTC Dominance is currently testing the upper boundary of the rising channel.
- A rejection around 64.25% to 65.66% is expected, and the best entry for altcoins would likely come on that rejection.
🚀 Next Move:
Keep an eye on the crossover between the 21 WMA and 50 WMA for confirmation. A downward crossover will likely signify the start of a broader altcoin rally.
If you like this update, please support it with your likes and share your feedback/requests in the comments section.
Thank you
#PEACE

BITCOIN This is where the most aggressive part begins.Bitcoin (BTCUSD) has turned sideways amidst the tariffs implementation today and on the longer picture (1W time-frame) it remains supported just above the 1W MA50 (blue trend-line). On this chart we display our Parabolic Growth Channel (PGC), which is the long-term Zone where BTC is a buy opportunity.
Throughout the market's historic Cycles, the time when BTC was supported above the 1W MA50 but still within its PGC was known as an Accumulation Phase (blue ellipse) before the final parabolic rally of the Cycle and its eventual Top (green Arc).
Based on this model, so far we haven't seen any such rally, despite the undoubtedly strong rallies of October 2023 - March 2024 and October 2024 - December 2024. Only the March 2024 and then the recent Tops can be counted as marginal breaches above the PGC and it's been no surprise that the market corrected back inside the Buy Zone but remained supported by the 1W MA50.
As long as it does, the probabilities of that final, most aggressive Cycle rally get stronger. On the last Cycle the peak was priced just above the 1.618 Fibonacci extension. That is currently a little below $170k and that is why our final Target is just below at $160000. Also right now we are marginally below the 0.618 Cycle top-to-top Fib, which is in line to where all previous final Cycle parabolic rallies started.
So do you think the 1W MA50 will now push BTC to its final Cycle rally? Feel free to let us know in the comments section below!
-------------------------------------------------------------------------------
** Please LIKE 👍, FOLLOW ✅, SHARE 🙌 and COMMENT ✍ if you enjoy this idea! Also share your ideas and charts in the comments section below! This is best way to keep it relevant, support us, keep the content here free and allow the idea to reach as many people as possible. **
-------------------------------------------------------------------------------
💸💸💸💸💸💸
👇 👇 👇 👇 👇 👇

BITCOIN - Long Trade Update - Third-of-a-Third Wave Incoming...In this video, I share an update on the developments I've observed since yesterday as we prepare for a move higher in a third-of-a-third wave.
As price movements become smaller and sharper at lower degrees, identifying the correct count becomes more challenging.
That’s why I always consider bearish alternatives and play devil’s advocate. However, at the moment, I don’t see any conflicting signals, so it’s just a matter of waiting for the next upward thrust to begin from here.

Bitcoin (BTC/USD) Price Analysis: Bearish Breakdown Ahead?🔥 Bitcoin (BTC/USD) 1-Hour Chart Analysis 🔥
🔹 Trend Analysis:
🟡 Price was moving in an ascending channel 📈 but has broken below the trendline.
🟠 A retest of the broken trendline is happening, suggesting a potential drop 📉.
🔹 Trade Setup:
🔽 Short Entry: Expected rejection from the trendline.
❌ Stop Loss: $85,671 - $85,710 (Above resistance).
✅ Take Profit Target: $81,386 - $81,347 (Bearish target 🎯).
🔹 Indicators & Confirmation:
📊 EMA (9) at $84,254 → Acting as resistance 🚧.
🔄 Break & Retest Pattern → Typical for a bearish continuation 🛑📉.
🔹 Conclusion:
⚠️ Bearish Bias: If the price rejects the trendline, it could drop towards $81,386 🎯.
🚨 Invalidation: If the price breaks above $85,710, the short setup is canceled ❌.

Bitcoin first HLIt looks like after a long time bitcoin is making its first higher low on daily time frame above the trendline.

Could the Bitcoin bounce from here?The price is falling towards the pivot which lines up with the 50% Fibonacci retracement and could bounce to the 1st resistance.
Pivot: 83,509.64
1st Support: 81,260.77
1st Resistance: 88,031.16
Risk Warning:
Trading Forex and CFDs carries a high level of risk to your capital and you should only trade with money you can afford to lose. Trading Forex and CFDs may not be suitable for all investors, so please ensure that you fully understand the risks involved and seek independent advice if necessary.
Disclaimer:
The above opinions given constitute general market commentary, and do not constitute the opinion or advice of IC Markets or any form of personal or investment advice.
Any opinions, news, research, analyses, prices, other information, or links to third-party sites contained on this website are provided on an "as-is" basis, are intended only to be informative, is not an advice nor a recommendation, nor research, or a record of our trading prices, or an offer of, or solicitation for a transaction in any financial instrument and thus should not be treated as such. The information provided does not involve any specific investment objectives, financial situation and needs of any specific person who may receive it. Please be aware, that past performance is not a reliable indicator of future performance and/or results. Past Performance or Forward-looking scenarios based upon the reasonable beliefs of the third-party provider are not a guarantee of future performance. Actual results may differ materially from those anticipated in forward-looking or past performance statements. IC Markets makes no representation or warranty and assumes no liability as to the accuracy or completeness of the information provided, nor any loss arising from any investment based on a recommendation, forecast or any information supplied by any third-party.

New ALL TIME HIGHS Bullish divergence on the 3M chart forming on RSI and OBV indicator. Very very high probability of seeing new highs. Dont be fooled by the news. Numbers are more important than words.
Stay blessed.
DYTRDR.

btc big comeback preparingCRYPTOCAP:BTC PREPARING FOR PARABOLIC RUN!
#Bitcoin Bollinger Bands and Momentum Point to Major Reversal in Weekly!

BTC @ ~$100k == GOLD @ ~$1kGold is always a good fractal to use for projecting Bitcoin.
Gold price action around the MIL:1K area is very similar to what we are seeing on BTC currently.
Flip $90k to support and it's go time for BTC.
1st target is ~$200k.
-@CryptoCurb

BITCOIN Will it finally break the 2 month Resistance?Bitcoin / BTCUSD is having an impressive 1day candle,recovering the losses of the last 3 days and with the 1day RSI bouncing on its Rising Support.
Now it faces the most important Resistance of all, the Falling trend line that started on the January 20th ATH.
This is just under the 1day MA50 and this will be the 5th test.
If successful, it will be an early validation that the trend has finally shifted to long term bullish again.
The first technical target will be the 2.0 Fibonacci extension. Aim a little bit lower at the top of February's Resistance Zone at $100000.
Follow us, like the idea and leave a comment below!!

PEPE(UPDATE)Hello friends
Due to the heavy price drop, you can see that buyers are slowly entering, and now there is a good opportunity to buy in stages and with capital management and move towards the specified goals.
Don't forget to save profit on each target.
*Trade safely with us*

Why is Eth Falling? ETH/BTC Ratio Hits All-Time Low Since 2020Why is Ethereum Falling? ETH/BTC Ratio Hits All-Time Low Since 2020
The cryptocurrency market is a volatile landscape, constantly shifting and evolving. Recent data has revealed a significant development: the Ethereum to Bitcoin (ETH/BTC) ratio has plummeted to an all-time low since 2020. This stark decline, currently resting at a mere 0.02 has ignited a wave of speculation and concern within the crypto community, raising questions about Ethereum's current standing and future trajectory.
The ETH/BTC ratio serves as a crucial metric for comparing the relative performance of Ethereum against Bitcoin. When the ratio falls, it indicates that Bitcoin is outperforming Ethereum, and conversely, a rising ratio suggests Ethereum's ascendancy. The current dramatic drop highlights a significant divergence in the fortunes of these two leading cryptocurrencies.
The backdrop to this decline is multifaceted. Bitcoin, often seen as the “digital gold” of the crypto world, has exhibited remarkable resilience and strengthened its position. This consolidation is likely driven by several factors, including increased institutional adoption, regulatory clarity in some jurisdictions, and its established reputation as a store of value. These factors have contributed to a sense of stability and confidence in Bitcoin, attracting capital and bolstering its market position.
Ethereum, on the other hand, has faced challenges in maintaining its momentum. While it remains the leading platform for smart contracts and decentralized applications (dApps), it has struggled to keep pace with Bitcoin's surge. Several factors contribute to this relative underperformance.
Firstly, regulatory uncertainty surrounding Ethereum and its classification has cast a shadow over its future prospects. The evolving regulatory landscape, particularly in major economies like the United States, has created a sense of unease among investors. The lack of clear guidelines and the potential for stricter regulations have dampened enthusiasm and limited institutional investment.
Secondly, Ethereum has faced competition from emerging layer-1 blockchains that offer faster transaction speeds and lower fees. These “Ethereum killers,” as they are sometimes called, have attracted developers and users seeking alternatives to Ethereum's perceived limitations. While Ethereum has undergone significant upgrades, such as the transition to proof-of-stake (The Merge), the benefits have not yet translated into a sustained surge in its relative value.
Thirdly, the overall market sentiment has played a role. Bitcoin's narrative as a safe haven and store of value has resonated strongly during periods of economic uncertainty. In contrast, Ethereum, with its focus on innovation and development, is perceived as a riskier asset. When market volatility increases, investors often gravitate towards the perceived safety of Bitcoin.
The decline in the ETH/BTC ratio raises several critical questions. Is Ethereum in trouble? Is this a temporary setback or a sign of a more fundamental shift in the crypto landscape?
While the current situation is concerning, it is essential to consider the long-term potential of Ethereum. Its robust ecosystem, driven by a vibrant community of developers and innovators, remains a significant asset. Ethereum's role in powering decentralized finance (DeFi), non-fungible tokens (NFTs), and other emerging technologies positions it as a crucial player in the future of the internet.
Furthermore, Ethereum's ongoing development efforts, including layer-2 scaling solutions and future upgrades, aim to address its scalability and efficiency challenges. These improvements could potentially revitalize Ethereum's performance and restore its competitive edge.
However, the current market dynamics suggest that Ethereum faces an uphill battle. To regain its footing, it needs to overcome regulatory hurdles, address its scalability issues, and effectively communicate its value proposition to a broader audience.
The cryptocurrency market is notoriously unpredictable, and past performance is not indicative of future results. The ETH/BTC ratio could rebound, or it could continue its downward trajectory. The outcome will depend on a complex interplay of factors, including regulatory developments, technological advancements, and market sentiment.
In the meantime, the low ETH/BTC ratio serves as a stark reminder of the dynamic nature of the cryptocurrency market. It underscores the importance of diversification and the need for investors to consider the risks and potential rewards of each asset carefully.
The current situation also highlights the need for Ethereum developers and community members to focus on the core values of the project, and to continue to innovate and improve the technology. Ultimately, the success of Ethereum will depend on its ability to adapt to the changing landscape and deliver on its promise of a decentralized and equitable future.
In conclusion, while the record low ETH/BTC ratio raises concerns about Ethereum's current standing, it is premature to declare its demise. The cryptocurrency market is constantly evolving, and Ethereum's long-term potential remains significant. However, the current challenges demand a proactive and strategic approach to ensure its continued relevance and success in the years to come.

BTC - MAY BE READY FOR MASSIVE BREAKOUT (OCT 2024)BTC - MAY BE READY FOR MASSIVE BREAKOUT (OCT 2024)
If Bitcoin forms another higher high and higher low, it could break out of its current boring range and experience a significant upward move.

Bitcoin Daily HEADS UP - Nice start to Week But RESISTANCE NOW
The daily chart shows the line of resistance we now hit
This is the line that has rejected PA since january
It is Strong.
We May break through but we have to wait and see but it is certainly Wise to be prepared for rejection
Even more so when you look at the Apex we are coming to with in the next 7 days
PA ALWAYS REACTS BEFORE THE APEX
The Volume profile on the right suggests resistance overhead is strong but we do sit above the POC ( point of control )
All to play for this week and it coulf get emotional
And YES, that is a Fib circle we are hitting too
Double resistance could lead to a Drop in the near future and yet, it is also worth knowing that PA can pick an intersection of two lines of resistance to break through. Kind of 2 birds with one stone attitude.
We need to wait and see
What ever happens, I feel this week may be VERY interesting.
Enjoy

BTC - BORING TIME BUT STILL BULLISH (JULY 2024)BTC - BORING TIME BUT STILL BULLISH (JULY 2024)
BTC has been quite dull over the past few months. However, I remain confident that the market is still bullish in the long term. It's just a matter of time, and a bullish phase is likely approaching soon.

BTC - POSSIBLE LONG TERM SCENARIO (JAN 2024)This is my first post in 2024.
BTC - POSSIBLE LONG TERM SCENARIO (JAN 2024)
This is what I see BTC in a big picture at the moment. The lowest I anticipate (if happens) would be 36k. Moreover, BTC can correct when reaches around 48k. The top also can be around 150k in 2025. Let's see what will happen.

BITCOIN | 4H | KEY POINTS Hey traders, what's up
I've marked the key levels for Bitcoin on the chart. Right now, it's holding within the 4-hour supply and demand zone. But if this level breaks, I expect Bitcoin to drop all the way down to around $78K.
For spot buyers, there’s no real risk at the moment. But if you're trading on margin and currently in the red, be extra cautious.
The market will liquidate you first, then move on its way.
Big thanks to everyone supporting my analysis with likes
I will provide continuous updates under this analysis.
