Bitcoin Hits New Highs: Is The Institutional Money Here To Stay?Bitcoin Hits New Highs, Gains Stability and Scale in Its Institutional Era: Will It Last?
From a volatile and often misunderstood outsider, Bitcoin has embarked on a remarkable transformation, evolving into what many now see as a foundational financial layer. This new era is not fueled by the fleeting whims of retail hype, but by the calculated, long-term strategies of professional capital. The steady influx of institutional investors is profoundly reshaping Bitcoin's character, taming its notorious volatility and broadening its accessibility to everyday individuals. This seismic shift begs the question: is this newfound stability and scale a permanent feature of the financial landscape, or a transient phase in Bitcoin's tumultuous history?
The Dawn of a New Epoch: The Institutional Stampede
For years, the narrative surrounding Bitcoin was one of a grassroots monetary experiment, a digital curiosity championed by cypherpunks and early internet adopters. Wall Street remained a skeptical spectator, wary of the asset's wild price swings, its lack of regulatory clarity, and its disruptive potential. However, Bitcoin's unyielding resilience and its core value proposition of a decentralized, finite digital asset gradually wore down this institutional resistance. The floodgates did not just creak open; they were blown apart with the regulatory approval of spot Bitcoin Exchange-Traded Funds (ETFs). This landmark decision marked a clear and decisive tipping point, a formal invitation for mainstream finance to embrace the world's first cryptocurrency.
This regulatory green light has had a profound and cascading impact. It has, in a single stroke, legitimized Bitcoin in the eyes of the most conservative financial establishments. More importantly, it has provided a familiar, regulated, and highly accessible entry point for a vast and previously untapped ocean of capital. Exposure to Bitcoin is no longer confined to specialized crypto-native platforms, which often carried a steep learning curve and perceived security risks. Now, it can be seamlessly integrated into the traditional investment portfolios that millions of people rely on, managed through their existing brokerages, pension funds, and even insurance products. This growing wave of institutional adoption is not merely inflating Bitcoin's price; it is fundamentally anchoring it more firmly within the global economy, weaving it into the very fabric of the system it was once designed to challenge.
The numbers illustrating this shift are staggering. In a remarkably short period, spot Bitcoin ETFs have amassed well over $138 billion in assets. This figure is not static; it represents a dynamic and growing pool of capital, reflecting sustained institutional interest. Registered Investment Advisors (RIAs), who manage the wealth of millions of Americans, along with sophisticated hedge funds and forward-thinking pension funds, represent a growing share of this investment. These are not speculative day traders but entities with long-term horizons and rigorous due diligence processes. Their participation signals a deep conviction in Bitcoin's future.
This institutional embrace extends far beyond the realm of ETFs. Major corporations have continued their aggressive accumulation of Bitcoin, viewing it as a treasury reserve asset superior to cash. This trend of corporate and institutional adoption is a key driver of Bitcoin's maturation, lending it a newfound sense of legitimacy and stability that was unimaginable just a few years ago. The current market cycle is thus being defined not by the frenetic energy of individual retail investors, but by the methodical and powerful currents of professional capital.
Taming the Beast: Volatility in the Institutional Age
One of the most significant and welcome consequences of this institutional influx has been the taming of Bitcoin's infamous volatility. For most of its history, Bitcoin's price chart resembled a dramatic mountain range, with breathtaking peaks and terrifying valleys. This volatility was its defining characteristic and its biggest barrier to mainstream acceptance. Institutional capital, however, operates on a different wavelength. With its longer time horizons and more systematic, data-driven approach, it behaves differently from the often emotionally-driven retail market.
While individual investors are more prone to panic-selling during sharp price dips or piling in during euphoric rallies, large institutions are more likely to employ disciplined strategies like dollar-cost averaging. They see price corrections not as a reason to panic, but as a buying opportunity. This behavior provides a stabilizing force, creating a floor during downturns and tempering the irrational exuberance of market tops.
This shift in market dynamics is evident in the flow of funds into the new financial products. These investment vehicles have frequently seen strong net inflows during price corrections, with major asset managers absorbing billions in capital even as retail sentiment soured. This institutional buying pressure acts as a powerful buffer, moderating the extreme price swings that have historically characterized the Bitcoin market.
While Bitcoin's volatility remains higher than that of traditional assets like gold or global equities, its trajectory is one of marked and consistent decline. This decline is a natural consequence of its growing market capitalization. As the total value of the network expands, the relative impact of new capital inflows or outflows is diminished, leading to smoother price action.
Interestingly, Bitcoin's volatility has at times converged with, and even fallen below, that of some mega-cap technology stocks, which themselves can exhibit significant price swings. This convergence is making traditional investors take a closer look, as the risk-reward profile of Bitcoin becomes more palatable and understandable. Historically, investors have been well-compensated for taking on Bitcoin's volatility, with its risk-adjusted returns often outperforming major stock indices over multi-year periods.
From Digital Gold to a Financial Base Layer: An Evolving Narrative
For much of its existence, Bitcoin has been championed as "digital gold." This narrative is powerful and intuitive. Like gold, it has a finite, predictable supply. It is decentralized, meaning no single entity can control it or create more of it at will. And it is censorship-resistant, offering a store of value outside the traditional financial system. This narrative has been a potent driver of adoption, particularly among those seeking a hedge against inflation, currency debasement, and geopolitical uncertainty.
However, the increasing stability brought about by institutional investment is fostering a new and complementary narrative: Bitcoin as a potential medium of exchange and, more broadly, as a foundational settlement layer for the global financial system. Lower volatility is a crucial prerequisite for any asset to function effectively as a currency. When prices are relatively stable, merchants and consumers can transact with confidence, knowing the value of their money will not drastically change overnight.
The development of Layer 2 solutions, most notably the Lightning Network, is a critical piece of this puzzle. These protocols are built on top of the Bitcoin blockchain and are designed to enable faster, cheaper, and more scalable transactions. They address the primary technical hurdles that have hindered Bitcoin's use for everyday payments, such as coffee or groceries. As this technological infrastructure continues to mature and gain adoption, Bitcoin's utility beyond a simple store of value is poised to expand significantly.
Furthermore, Bitcoin's historically low correlation with traditional assets like stocks and bonds makes it an exceptionally valuable tool for portfolio diversification. In a world where asset classes are becoming increasingly interconnected, Bitcoin offers a unique return stream. Adding even a small allocation of Bitcoin to a traditional 60/40 portfolio can potentially enhance returns over the long term without a commensurate increase in overall risk. This diversification benefit is a key part of the thesis for many institutional investors.
Navigating the Market's Pulse: Price, Psychology, and Predictions
As Bitcoin navigates this new institutional era, the question on every investor's mind is: where does the price go from here? The recent surge to new all-time highs above the $123,000 mark has been met with a mix of bullish enthusiasm and cautious optimism. After reaching this peak, the market saw a natural retreat, with bulls pausing for a breath and prices consolidating. The price action has been dynamic, with a fresh increase starting above the $120,000 zone before finding temporary resistance and trading near the $118,500 level. This kind of price discovery, including breaks below short-term bullish trend lines, is characteristic of a market absorbing new information and establishing a new support base.
Technical analysis suggests that the current rally may have further to run. Having decisively broken through key psychological and technical resistance zones, some analysts see a clear path toward $135,000 or even $140,000 in the medium term. The price trading well above key long-term moving averages confirms that the underlying momentum remains strongly bullish.
However, a closer look at market sentiment and on-chain data reveals a more nuanced and perhaps even more bullish picture. Despite the record-breaking prices, the market has yet to enter the state of "extreme greed or euphoria" that has characterized the absolute peaks of previous bull cycles. Key metrics that track the profitability of long-term holders remain below the "euphoria" zone, suggesting that the smart money is not yet rushing to take profits. This could indicate that the current rally, while impressive, is still in its early or middle phases, with more room to grow before reaching a cyclical top. A delay in the full-blown bull market euphoria could ultimately push Bitcoin higher than many expect.
Of course, the market is not a one-way street. The spike to $123,000 was followed by an increase in Bitcoin flowing into exchanges, a potential sign of short-term profit-taking and a cooling-off period. Even large, strategic players may take profits during rallies. The news of Bhutan's sovereign wealth fund strategically unloading a portion of its holdings is a prime example. While these sales can introduce short-term selling pressure, they are also a healthy part of a functioning market. The fact that inflows, even at the peak, were just a fraction of those seen in earlier parts of the year suggests that the selling pressure is not yet overwhelming.
The Sustainability of the Institutional Era: A Critical Analysis
The institutionalization of Bitcoin is undoubtedly a paradigm shift, but its long-term sustainability is not a foregone conclusion. While the current trend is one of increasing adoption and stability, there are several factors that could challenge this new status quo and must be considered by any serious investor.
One potential risk is the concentration of Bitcoin in the hands of a few large institutions. While this brings stability in the short term, it also introduces a potential point of centralization in a decentralized system. If a handful of major asset managers were to simultaneously decide to sell their holdings—perhaps due to a change in their own internal risk models or a major macroeconomic shock—it could trigger a significant market downturn. Such a move would likely be exacerbated by retail investors following the lead of these financial giants.
Regulatory risk also remains a significant and unpredictable concern. While the approval of spot Bitcoin ETFs in the United States was a major step forward, the global regulatory landscape is a complex and evolving patchwork. Any future crackdowns, unfavorable tax treatments, or restrictive regulations in major jurisdictions could dampen institutional enthusiasm and hinder further adoption. The path to full regulatory clarity is likely to be long and fraught with challenges.
Furthermore, the narrative of Bitcoin as an inflation hedge has yet to be definitively proven across all possible economic conditions. While it has performed well during recent periods of high inflation and monetary expansion, its correlation with risk assets means it can also be sensitive to economic downturns and tightening financial conditions. A prolonged period of global recession or stagflation could test its resilience as a store of value in new and unexpected ways.
Conclusion: A Maturing Asset in an Evolving World
Bitcoin has come an immeasurably long way from its obscure beginnings as a niche digital currency for a small community of technologists. The influx of institutional capital has ushered in a new era of stability, accessibility, and legitimacy. The launch and wild success of spot Bitcoin ETFs has been the primary catalyst, providing a regulated and familiar on-ramp for a vast pool of professional money that is reshaping the asset's very DNA.
This institutional embrace is about far more than just price appreciation; it is fundamentally changing the character of Bitcoin. Its volatility, while still present, is on a clear downward trend, making it a more viable contender as both a global store of value and a neutral settlement network. The long-held dream of Bitcoin as a foundational layer of a new, more transparent financial system is slowly but surely taking shape.
However, the road ahead is not without its challenges. The risks of institutional concentration, regulatory uncertainty, and macroeconomic headwinds are real and should not be underestimated. The sustainability of this new era will depend on a delicate interplay of market forces, regulatory developments, and continued technological innovation on its network.
What is clear is that Bitcoin has earned its place on the world's financial stage. It is no longer an outsider looking in, but a maturing asset that is being progressively integrated into the global economic fabric. Whether this institutional era will be a lasting one remains the defining question of our time. But one thing is certain: Bitcoin's journey is far from over, and its evolution will continue to be one of the most compelling and consequential stories in the world of finance for years to come.
1-BTCUSD
Bitcoin is still bullish (4H)Bitcoin appears to be in a dual bullish structure, currently in the second bullish phase following wave X.
Considering the expansive nature of the correction in the second pattern, it seems we are within an expanding triangle or a diametric structure.
Based on the duration of wave C, it appears that the bullish wave of the second structure is not yet complete.
We expect such fluctuations for Bitcoin in the coming period.
A daily candle close below the invalidation level would invalidate this outlook.
For risk management, please don't forget stop loss and capital management
Comment if you have any questions
Thank You

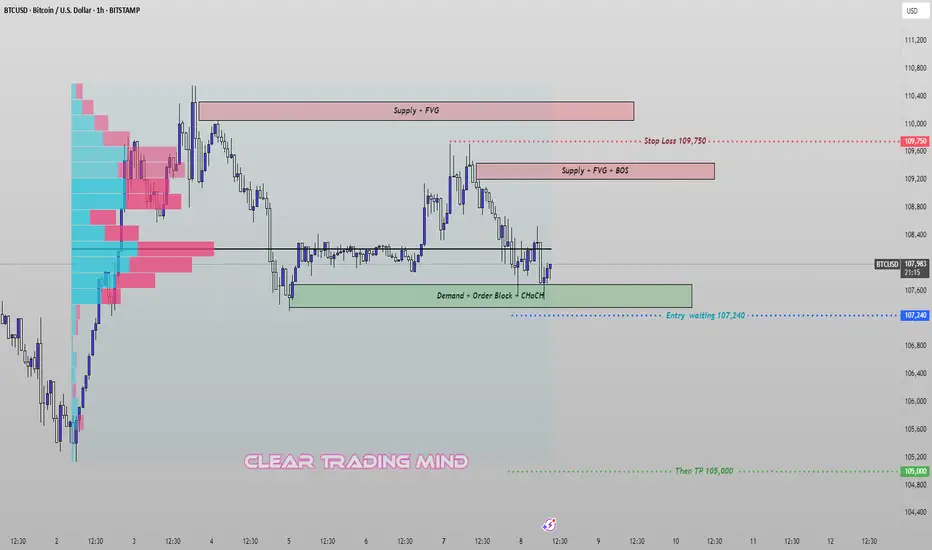
BTCUSD – Breakout Plan from Demand Zone (CHoCH + OB Setup)🔹 Current View:
I'm closely watching the 107,240 zone, where we have a strong Demand + Order Block + CHoCH (Change of Character) setup. This is a key support area that could trigger a fresh bearish move if broken.
🔹 My Plan:
I'm waiting for a clear breakout below 107,240 to enter a short position.
➡️ Entry: 107,240 (after confirmed breakout)
➡️ Stop Loss: 109,750 (above supply + BOS zone)
➡️ Target: 105,000 (previous inefficiency zone)
🔹 Supply Zones Noted:
- 109,250–109,500: Supply + FVG + BOS
- 110,000–110,500: Strong Supply + FVG
This trade is based on price breaking demand structure and retesting key supply areas above. Volume profile also shows heavy activity above, indicating possible resistance on any pullbacks.
TURBO/USDT - H4 - Wedge Breakout (29.06.2025)The TURBO/USDT pair on the H4 timeframe presents a Potential Buying Opportunity due to a recent Formation of a Wedge Breakout Pattern. This suggests a shift in momentum towards the upside and a higher likelihood of further advances in the coming Days.
Possible Long Trade:
Entry: Consider Entering A Long Position around Trendline Of The Pattern.
Target Levels:
1st Resistance – 0.005173
2nd Resistance – 0.005994
🎁 Please hit the like button and
🎁 Leave a comment to support for My Post !
Your likes and comments are incredibly motivating and will encourage me to share more analysis with you.
Best Regards, KABHI_TA_TRADING
Thank you.

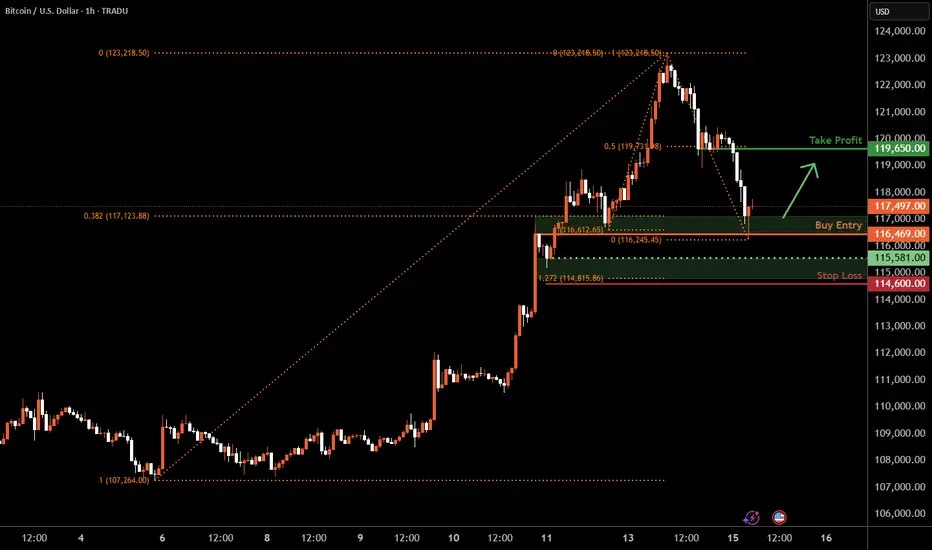
Bitcoin H1 | Potential bounce off a pullback supportBitcoin (BTC/USD) is falling towards a pullback support and could potentially bounce off this level to climb higher.
Buy entry is at 116,469.00 which is a pullback support that aligns closely with the 38.2% Fibonacci retracement.
Stop loss is at 114,600.00 which is a level that lies underneath a swing-low support and the 127.2% Fibonacci extension.
Take profit is at 119,650.00 which is a pullback resistance that aligns with the 50% Fibonacci retracement.
High Risk Investment Warning
Trading Forex/CFDs on margin carries a high level of risk and may not be suitable for all investors. Leverage can work against you.
Stratos Markets Limited (tradu.com ):
CFDs are complex instruments and come with a high risk of losing money rapidly due to leverage. 63% of retail investor accounts lose money when trading CFDs with this provider. You should consider whether you understand how CFDs work and whether you can afford to take the high risk of losing your money.
Stratos Europe Ltd (tradu.com ):
CFDs are complex instruments and come with a high risk of losing money rapidly due to leverage. 63% of retail investor accounts lose money when trading CFDs with this provider. You should consider whether you understand how CFDs work and whether you can afford to take the high risk of losing your money.
Stratos Global LLC (tradu.com ):
Losses can exceed deposits.
Please be advised that the information presented on TradingView is provided to Tradu (‘Company’, ‘we’) by a third-party provider (‘TFA Global Pte Ltd’). Please be reminded that you are solely responsible for the trading decisions on your account. There is a very high degree of risk involved in trading. Any information and/or content is intended entirely for research, educational and informational purposes only and does not constitute investment or consultation advice or investment strategy. The information is not tailored to the investment needs of any specific person and therefore does not involve a consideration of any of the investment objectives, financial situation or needs of any viewer that may receive it. Kindly also note that past performance is not a reliable indicator of future results. Actual results may differ materially from those anticipated in forward-looking or past performance statements. We assume no liability as to the accuracy or completeness of any of the information and/or content provided herein and the Company cannot be held responsible for any omission, mistake nor for any loss or damage including without limitation to any loss of profit which may arise from reliance on any information supplied by TFA Global Pte Ltd.
The speaker(s) is neither an employee, agent nor representative of Tradu and is therefore acting independently. The opinions given are their own, constitute general market commentary, and do not constitute the opinion or advice of Tradu or any form of personal or investment advice. Tradu neither endorses nor guarantees offerings of third-party speakers, nor is Tradu responsible for the content, veracity or opinions of third-party speakers, presenters or participants.
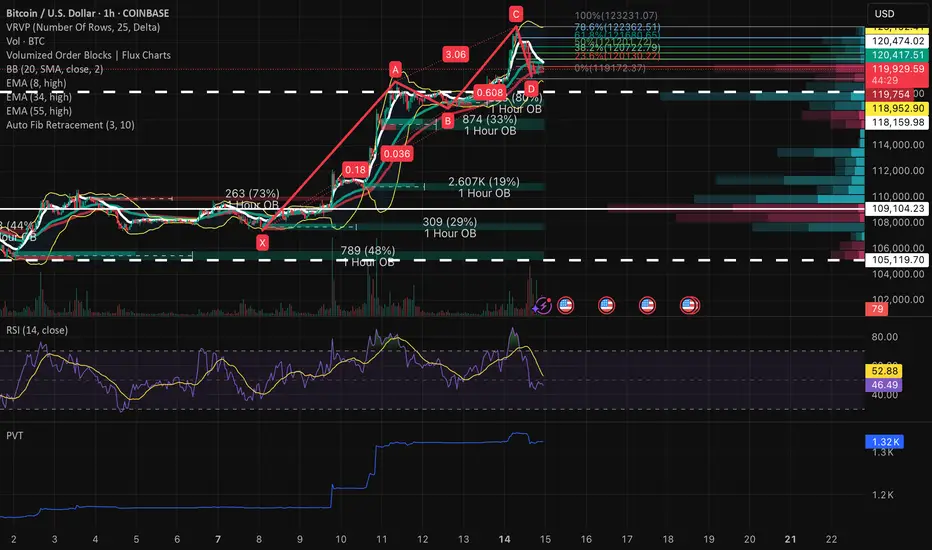
BTCUSD • 1H ABCD Completion at Key Confluence – Long Bias1) Macro → Micro Context
Daily / 4H Trend:
Still a clear up-trend on the daily & 4-hour: higher highs / higher lows above the 8, 34 & 55 EMA ribbon.
The $120 K–$121 K zone houses the largest Volume-by-Price node in two weeks, now acting as near-term support.
1H Context:
X→A: $106 100 → $118 950 impulsive run
A→B: ~15% pullback into $117 000 (≈0.15 XA)
B→C: 3.06× extension to $123 230
C→D: Retrace into $119 900–$120 300, matching 0.618 BC & ~80% XC Fib
2) Structural & Momentum Breakdown
AB=CD & Fib Confluence: D at $119 900–$120 300 aligns perfectly with both 0.618 BC and ~80% XC retracements.
1H Bullish Order Block: $119 900→$119 750
20-period SMA (mid-BB): ≃$120 100
VRVP High-Volume Node: Centered ≃$120 400
RSI (14): Holding 47–50 on the hour, flattening and poised to curl up
PVT: Flat-to-up on the pullback—sign of absorption
Volume: Contracts into D, then a slight uptick on the last 1 h bar
3) Exact Trade Plan
Entry: $119 400 - $120 300
Stop-Loss: $117 300 - $118 000
Take-Profit 1: $121 800 → $122 200
Take-Profit 2: $123 000 → $123 500
Optional “Hype” TP instead of TP 2: $125 000 → $126 500
(for a parabolic push if the upcoming House vote prints strong headlines — targets at 78.6%–100% BC extensions)
Entry Confirmation (any one):
1 h bullish engulfing or inside bar within entry zone
RSI (14) closes back above 50 on the hourly
PVT prints a higher low with renewed buy-side volume
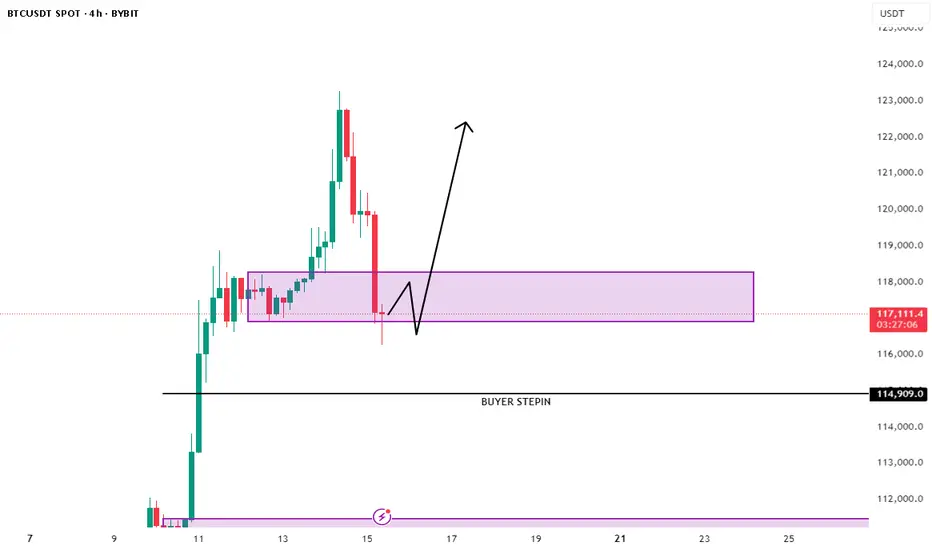
BTC/USDT Long Position Plan🔥 BTC/USDT LONG IDEA (4H CHART)
Published by: Ali15349323
Timeframe: 4H
Exchange: Bybit Spot
Date: July 15, 2025
📊 Analysis Summary:
Bitcoin is pulling back after a strong impulsive move upward. Price has now entered a key 4H demand zone between 116,200 – 117,300, which previously acted as a consolidation base before the breakout.
We are now watching for a potential long entry in this zone, with a bounce confirmation and invalidation criteria clearly defined.
📌 Trade Plan (Long Setup)
Entry Zone:
🔹 116,200 – 117,300 USDT
🔹 Price is currently reacting within this support range
Stop Loss (Invalidation):
🔹 Below 114,900 USDT
🔹 A 4H candle close below this level would break structure and invalidate the setup
Take Profit Targets:
🔹 TP1: 121,000 – Local resistance
🔹 TP2: 123,000 – 124,000 – Imbalance fill zone
🔹 TP3 (Optional): 125,500+ – If momentum continues
🧠 Reasoning Behind the Trade:
✅ Strong demand zone with historical reaction
✅ Wick rejection from the lower boundary, showing early buyer interest
✅ Price structure still bullish unless 114.9k breaks
✅ Previous sell-off likely triggered liquidation — now a chance for recovery bounce
⚠️ Invalidation Criteria:
❌ A 4H candle close below 114,900 signals demand has failed
❌ In this case, the setup is no longer valid — next demand sits around 111k – 112k
🧾 Summary:
We’re looking for a bullish continuation if BTC holds above the current demand zone. A sweep-and-reclaim structure could give confirmation. If the zone fails, no trade — we step aside and wait for deeper support.
📣 Don’t forget to:
🔁 Like & Share
🧠 Follow me @Ali15349323 on X for more trades
#BTC #Bitcoin #Crypto #LongSetup #TechnicalAnalysis #TradingView
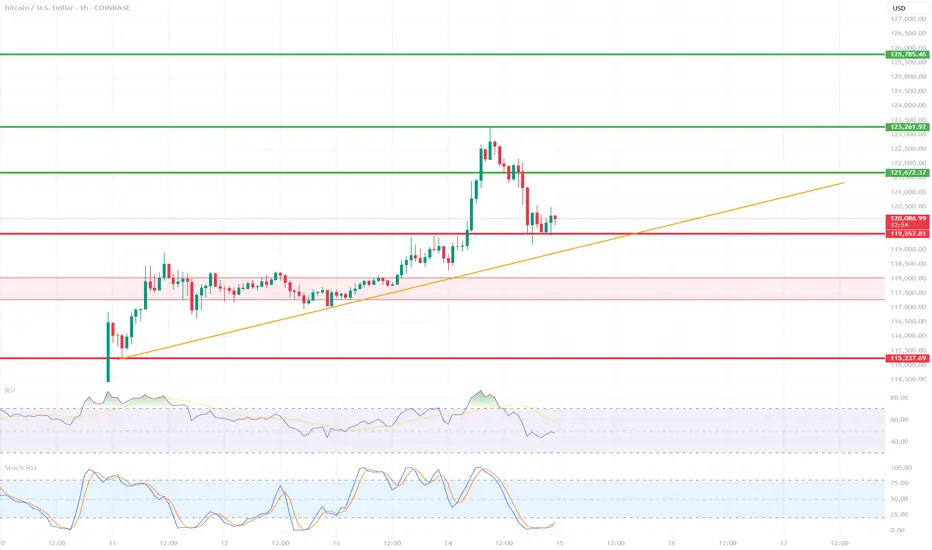
BTC/USD 1H ShortTerm🔍 Trend:
The short-term uptrend remains in effect, supported by the orange trendline.
The price has tested dynamic support but has not yet broken it.
🟥 Supports (Important Levels):
🔻 1. 119.550
Key support.
The price is currently testing it. Holding = potential upside rebound.
Breaking = greater downside risk.
🔻 2. 117.260–118.040 USD
Clear demand zone (reinforced by prior consolidation).
If the price breaks below current support, this is the next logical stopping point.
🔻 3. 115.237–115.500 USD
Strong weekly support – very important in the event of a stronger correction.
Historically, it has responded many times.
🟩 Resistance:
🔼 1. USD 121.673
The nearest local resistance – this could pose a problem for further growth.
🔼 2. USD 123.961
The last local high. Breaking it confirms the continuation of the uptrend.
🔼 3. USD 125.785
The next resistance – a potential target after a breakout to the upside.
📈 Technical Indicators:
RSI (classic):
Still below 50, but starting to reverse slightly upward – neutral with a slight potential for a rebound.
Stochastic RSI:
Gives a long signal – the lines have crossed in the oversold zone and are pointing upward.
📊 Scenarios:
🟢 Bullish:
Maintaining the current support zone (119.5–120k).
Breakout above 121.673 → target: 123.961.
Breakout of 123.961 = trend confirmation and target: 125.8k+
🔴 Bearish:
Break of the trend line and support at 119.550 → possible quick decline to 117.2k–118k.
If this doesn't hold, target: 115.2k
✅ Summary:
Decisive moment – tested trend line + support = rebound or breakout point.
The Stochastic RSI indicates a potential upside breakout, but the RSI needs confirmation.
Careful monitoring of volume and reaction to 120k in the coming hours.
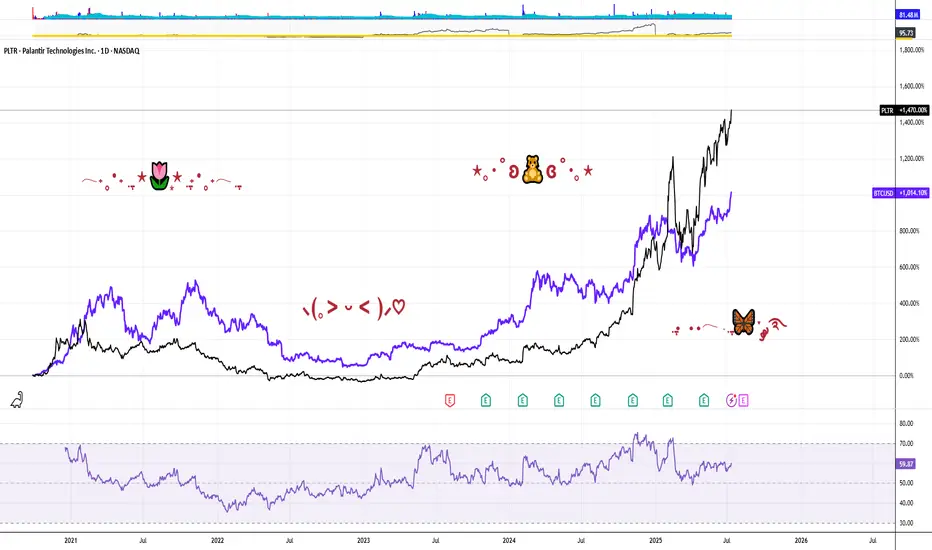
PALANTIR REMAINS YOUR TRADING GOAL, DOUBLING IN PRICE IN 2025In the Faraway Kingdom... In the Thirtieth Realm....
Somewhere in another Galaxy.. in late December, 2024 (yet before The Second Coming of Trump), @TradingView asked at it awesome Giveaway: Happy Holidays & Merry Christmas .
1️⃣ What was your best trade this year?
2️⃣ What is your trading goal for 2025?
Here's what we answered:
1️⃣ What was your best trade this year?
- Surely Palantir NASDAQ:PLTR 💖
I followed Palantir all the year since January, 2024, from $16 per share, watch here .
Current result is 5X, to $80 per share.
Also I added more Palantir after SP500 Index inclusion in September 2024 watch here .
Current result is 2.6X, from $30 to $80 per share.
2️⃣ What is your trading goal for 2025?
- Once again, surely Palantir NASDAQ:PLTR 💖
It's gone 7 months or so... (Wow... 7 months really? 😸😸😸)
Let see what's happened next at the main graph of Palantir stock, to LEARN WHY PALANTIR REMAINS THE TRADING GOAL, DOUBLING IN PRICE IN 2025...
Palantir stock remains an attractive trading goal for several compelling reasons rooted in its strong market performance, innovative technology, and robust growth prospects, particularly in the artificial intelligence (AI) sector.
1. Exceptional Stock Performance and Momentum.
Palantir Technologies has been one of the best-performing stocks in 2025, surging over 80% in the first half of the year alone, vastly outperforming the S&P 500’s modest 5.5% gain. The stock recently hit all-time highs around $149, reflecting a nearly 400% increase year-over-year, underscoring its strong momentum and investor enthusiasm. This surge positions Palantir as a top AI stock to watch, attracting both retail and institutional investors, including conservative entities like the Czech National Bank.
2. Leadership in AI and Data Analytics.
Palantir is not just a data analytics company; it has transformed into a major AI software provider with its Artificial Intelligence Platform (AIP). This platform extends beyond government contracts into commercial sectors such as healthcare, energy, and automotive, fueling significant revenue growth. The company reported a 39% revenue increase to $883.9 million in Q1 2025, driven largely by AI adoption. Its AI platform is gaining traction globally, with many companies rapidly adopting Palantir’s software through short training bootcamps, demonstrating scalable and fast integration.
3. Strong Government and Commercial Contracts.
Palantir’s roots in government intelligence and defense continue to be a significant revenue driver. The U.S. government division alone generated $373 million in Q1 2025, with overall government revenue up 45% year-over-year. Strategic partnerships, such as with Accenture to streamline federal operations and projects like the U.S. Navy’s ‘Warp Speed for Warships,’ highlight Palantir’s expanding footprint in critical government sectors. Simultaneously, the commercial segment is booming, with revenue soaring 71% to $255 million in Q1 and projected to reach $1.178 billion in 2025.
4. Financial Health and Growth Outlook.
Palantir’s financials are strengthening, with no debt and adjusted free cash flow more than doubling to $370.4 million in the recent quarter. Analysts forecast the company’s revenue to exceed $3.5 billion in 2025, up from $2.23 billion the previous year, and project potential revenue of $7 billion by 2028. Operating margins are improving, with a recent quarter reporting a 26% margin, the highest in company history. This solid financial foundation supports further investment in AI innovation and market expansion.
5. Market Position and Competitive Edge.
While Palantir competes with tech giants like Microsoft, Amazon, and Google in the AI and data analytics space, it has carved out a unique niche with its specialized government contracts and AI-driven software solutions. Its ability to integrate complex datasets for real-world operational use distinguishes it from competitors, fostering a loyal investor base and a "cult-like" following among retail investors.
6. High Valuation Reflects Growth Expectations.
Despite a high price-to-earnings ratio (PE around 621), reflecting elevated expectations, many analysts remain optimistic about Palantir’s long-term potential due to its rapid growth and expanding AI capabilities. The company’s market capitalization has soared above $330 billion, surpassing many established corporations, signaling strong market confidence.
7. Palantir stock is a compelling trading goal because it combines robust growth, cutting-edge AI technology, strong government and commercial contracts, and solid financial health.
8. In conclusion, Palantir remarkable stock performance and strategic positioning in the booming AI sector make it a promising investment for traders seeking exposure to transformative technology with significant upside potential.
9. ...and yet, Palantir performance since inception (It ultimately went public on the New York Stock Exchange through a direct public offering on September 30, 2020) is better, rather then Bitcoin.
--
Best wishes,
@PandorraResearch Team 😎
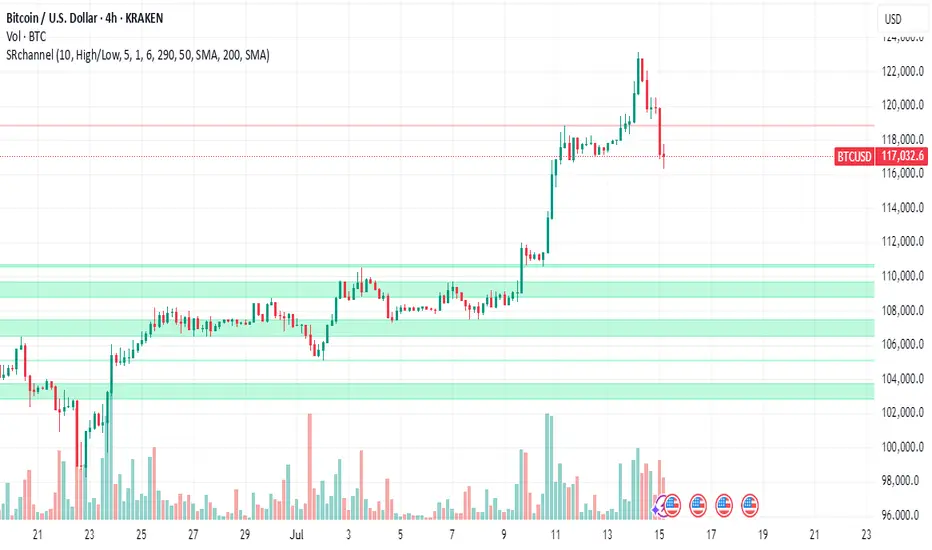
Bitcoin Towards $118KDaily chart,
The Bitcoin BITSTAMP:BTCUSD has just formed a falling wedge pattern, down from the highest High 109356.
Some consolidation may happen in the range 86000 to 82000.
Closing above 86000 for 2 days will give a strong buy signal for a bullish movement, and the target will be 118150 passing through the shown resistance levels.
Consider the Stop Loss below 82000
Note: Always place a near profit protection level, as the BTC is volatile.

₿itcoin: Pushing Higher—But Watch for a Reversal AheadAfter taking a brief pause over the weekend, Bitcoin resumed its upward momentum early this morning, trading within the blue Target Zone between $117,553 and $130,891. This marks the first time the cryptocurrency giant has traded above the key $120,000 level. Within this zone, and in line with our primary scenario, we continue to anticipate the peak of the corrective wave B rally, followed by a trend reversal to the downside. We expect a significant wave C decline, targeting the lower blue zone between $62,395 and $51,323. As such, prices in the upper blue Target Zone may present an opportunity to take (partial) profits on existing long positions and, where appropriate, to initiate potential short positions as a hedge. These shorts could be protected with a stop 1% above the upper boundary of the zone, given there remains a 35% probability that Bitcoin could break directly above the $130,891 resistance and set a new high as blue wave alt.(i).
📈 Over 190 precise analyses, clear entry points, and defined Target Zones - that's what we do.

BTC-----Buy around 121100, target 121800 areaTechnical analysis of BTC contract on July 14:
Today, the large-cycle daily level closed with a small positive line yesterday, the K-line pattern continued to rise, the price was above the moving average, and the attached indicator was running in a golden cross. The overall trend is still very obvious, and it can be seen from the overall trend that the retracement is very small. After the shock correction in the two trading days over the weekend, it rose strongly again during the day and broke through the previous high position, so we keep the main idea of buying on retracement in trading; the short-cycle hourly chart intraday price broke upward, the starting point was 118880 area, the current price is consolidating at a high level, the K-line pattern continued to rise, and the attached indicator was running in a golden cross. If we look at the continuation of the high closing today, two conditions must be met: the European market price broke through the intraday high; the retracement cannot break the starting point, otherwise it will be difficult to fall.
Today's BTC short-term contract trading strategy:
Trade in the 121100 area when retracement, stop loss in the 120500 area, and the target is the 121800 area;

[UPDATE] - The Art of Chillin’: Smart Money’s Favorite SeasonHey lads,
Congrats on that juicy 120K !
We’ve breached the first trendline and tagged the second trendline (green). We’re now sitting just below it.
As mentioned in my previous post, these trendlines are robust and marked a local top back in November 2024.
We’ve had a great run so far. BTC finally broke through the first trendline after a few rejections — now let’s see how this plays out.
Overall, the market has started to pick up again. But to get what we all want, BTC needs to just chill for a bit — no dumping, no pumping — just chill, so alts can start trending higher.
If not, it’s still BTC season. Check my previous post about Altseason for more context.
That's it, that's the idea" - Good night !

BTC/USDT HIDDEN PATTERN! SM, FIB AND MORE COMFIRMED!Price Resilience Amid Geopolitical Stress
Bitcoin demonstrated remarkable strength during the Israel-Iran conflict, briefly dipping to ~$98K but swiftly rebounding above $105K. This aligns with historical patterns where BTC initially sells off on geopolitical shocks but recovers aggressively within weeks, outperforming gold and equities by 15-60% post-crisis. There is a $96K-$94K "footprint" that coincided with institutional accumulation, evidenced by $1.37B in spot ETF inflows during the conflict week, led by BlackRock's IBIT ($240M single-day inflow) according to official information. This institutional backstop and many others might single-handedly prevented a deeper correction for now, remember that smart money psychology is to create cause out of thin air and buy during selling and indecisive times.
Critical Levels to Watch
Immediate Support: $108k area is vital. A sustained hold here maintains short-term bullish momentum. The 50-day SMA near $102.8K (tested during June 13 conflict sell-off) remains a macro support floor.
Resistance & Targets: The $112K ATH is the near-term ceiling. Breaking this requires stronger spot demand—currently, net exchange inflows are negative, indicating weak retail participation or traders that are backing off for now.There's a $120K target (0.618 Fib) aligned with Standard Chartered’s $150K year-end model if ETF inflows persist.
Risk Zones: A close below $108.3K risks a slide to $105K. Failure here opens path to $96K and a further break of this 92k to 96k zone could lead directly to 70k area or even lower if economical and social activities are not favorable in the near to medium future.Dominance above 55% (currently 65%) delays alt season, but a break below 60% could ignite alts in a positive way.
Macro Catalysts & Market Sentiment
Policy Tailwinds: Trump’s "One Big Beautiful Bill" (proposing $5T debt ceiling hike and U.S. strategic BTC reserves) could weaken the USD, boosting BTC’s "digital gold" narrative. DXY’s -9% YTD drop already correlates with BTC’s 54% post-election rally.
Fed Influence: Pressure to cut rates (amid cooling employment data) may accelerate institutional rotation into BTC. ETF inflows hit $2.75B in late June, signaling renewed institutional FOMO.
Geopolitical Cooling: Iran-Israel ceasefire talks reduced immediate panic, but residual volatility risk remains. Traders note BTC often rallies 20-40% within 60 days of conflict events.
Structural Challenges
Liquidity Fragility: Whale moves (for example: 10K BTC sell orders) now impact prices more due to ETF-driven liquidity concentration. Recent $98K flash crash exemplified this.
Regulatory Overhang: MiCA compliance costs in the EU and U.S. security-reclassification proposals could pressure smaller tokens, though BTC’s status appears secure 28.
Seasonal Slump: July historically sees 6.1% of annual crypto volume—low volatility may delay breakouts until August 4.
Strategic Outlook
A July breakout above $112K could ignite the next leg to $120K, but a retest of $107K-$105K is likely first. Altcoins remain subdued until BTC dominance breaks <55%—select projects with institutional backing (for example, ETF candidates) or real-world utility for asymmetric opportunities.
Conclusion: BTC’s resilience amid chaos confirms its institutional maturity. Trade the $108.3K-$112K range aggressively, with a break above ATH targeting $120K by September. Always hedge tail risks (escalations, regulatory shocks) in this volatility-rich asset class. While this great surge in institutional inflow is good for BTC it also indicates a reduction or slower pace of other crypto currencies.
This is my analysis for BTC, let me know what you think and I hope you like it!

How many bag holders will BTC leave behind?We've had our fun and some fake pumping from the short squeeze. No comes the real stuff! What are the fundamentals and what problem is BTC trying to solve? Ok, crickets. It's a speculative asset, that's it. If history repeats itself, which it typically does, we will see a major pull back and anyone who's bought at the top will have a negative performing portfolio. It's too expensive and you still can't buy a banana with BTC and there are plenty of middlemen involved, which goes 100% against it's original purpose (after the financial crisis).
If you're up, this would be a good time to sell IMHO and buy at the next support level, which is way below 100k.

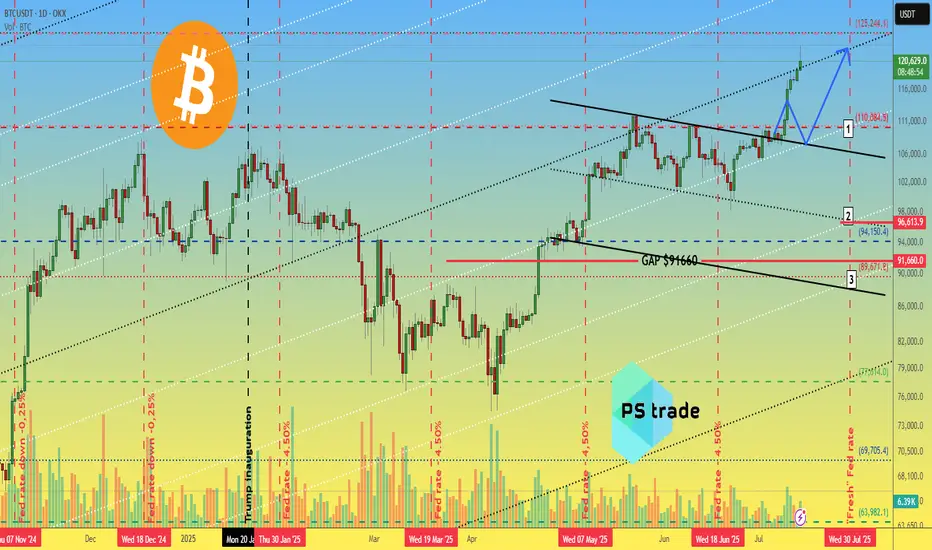
Bitcoin BTC price analysis📈 Two weeks have passed since the previous analysis of the OKX:BTCUSDT chart, and the market has decided to go with the 1️⃣ scenario.
Less than 3% remains to reach $125,000, and the price could easily get there by inertia, but that's a minor detail.
CRYPTOCAP:BTC is updating its ATH, and total liquidations on the crypto market over the past 24 hours are “only” $750 million, of which almost $450 million is accounted for by #Bitcoin.
Weak, very weak... Previously, longs were liquidated for $2+ billion, and it was reported that the actual amount of liquidations was significantly higher due to the fact that the exchanges' data was not fully disclosed. (For the sake of objectivity, at that time, the lion's share of liquidations was accounted for by altcoins, but now this is not the case).
◆ During this time, Trump introduced new tariffs — the market was “on a roll” — it swallowed it and didn't even notice the news.
◆ Tomorrow, July 15, the US CPI will be announced — the forecast is for inflation to rise from 2.4% to 2.6% (although there are rumors that the situation in the US economy is much worse and this may "come to light" tomorrow).
◆ July 16 - PII announcement - these indicators may act as a “cold shower” to bring the market out of its euphoria.
◆ From July 14 to July 18, the US Congress is considering three key crypto laws, including the GENIUS Act. Major players consider this a powerful driver. Perhaps the current growth has already “played out” and priced in expectations for news.
🪐 And this trading week will end on 18.07 with the start of Mercury retrograde, even the US Congress is postponing all important matters, and you still don't believe in it ))
🖐 Long positions are certainly beneficial, appropriate, and in line with the trend at present, but it is advisable to hedge them with stops, because as mentioned above: the price is rising, and there are few liquidations. During the previous decline in the cryptocurrency market, there were significantly more liquidations of long positions, and they may wish to repeat this.
And with the #BTCUSD price correction, there will be a fixation: some will have profits, and some will have losses in stablecoins, which would then be logical to reinvest as capital in altcoins. First in something more voluminous and less risky, and in the last stage, they will pump everything in a row)
But until then, we still need to survive and preserve our deposits.
So, in your opinion: correction to one of the levels:
1️⃣-$110k 2️⃣-$97k 3️⃣-$90k
or
is everything written above complete nonsense, and the market growth has only just begun to “take off”?
"Ethereum Is The New Bitcoin" - Tom Lee ETH / Stablecoins Are the ChatGPT of Crypto
Stablecoins are exploding in adoption — just like ChatGPT took over AI and Ethereum is the engine driving that revolution. In this post, we break down 10 reasons why Tom Lee is extremely bullish on Ethereum and why it could be the single most important digital asset in the future of finance . If you're sleeping on ETH, this might be your wake-up call.
Top 10 Bullish Points from Tom Lee on Ethereum:
• Ethereum is the backbone of stablecoins , which Tom Lee compares to the “ChatGPT of crypto” due to their viral adoption and massive utility.
• Over 51% of all stablecoins operate on Ethereum , contributing to around 30% of the network’s total fees.
• Ethereum network fees could 10x as stablecoin usage grows from $250 billion to $2 trillion.
• Ethereum is positioned to lead the tokenization of real-world assets , including stocks and real estate.
• ETH could reach $10,000 if asset tokenization becomes a mainstream financial practice.
• Ethereum has a regulatory edge in the U.S. , making it the preferred platform for compliant financial innovation.
• A $250 million ETH treasury strategy is underway , aiming to use Ethereum as a long-term reserve asset.
• Institutions will buy and stake ETH to secure stablecoin networks, making ETH the “next Bitcoin.”
• Ethereum dominates the crypto ecosystem , with nearly 60% of activity including DeFi, NFTs, and dApps built on its chain.
• HODL ETH for long-term growth , as its utility, demand, and institutional support continue to rise.
Conclusion:
Ethereum isn’t just a Layer 1 blockchain — it’s becoming the core financial infrastructure for the digital age . As stablecoins expand and institutions enter, ETH could be the most asymmetric opportunity in crypto right now.
📢 Drop a like, leave your thoughts in the comments, and don’t forget to follow for more powerful macro + crypto insights. 👍👍

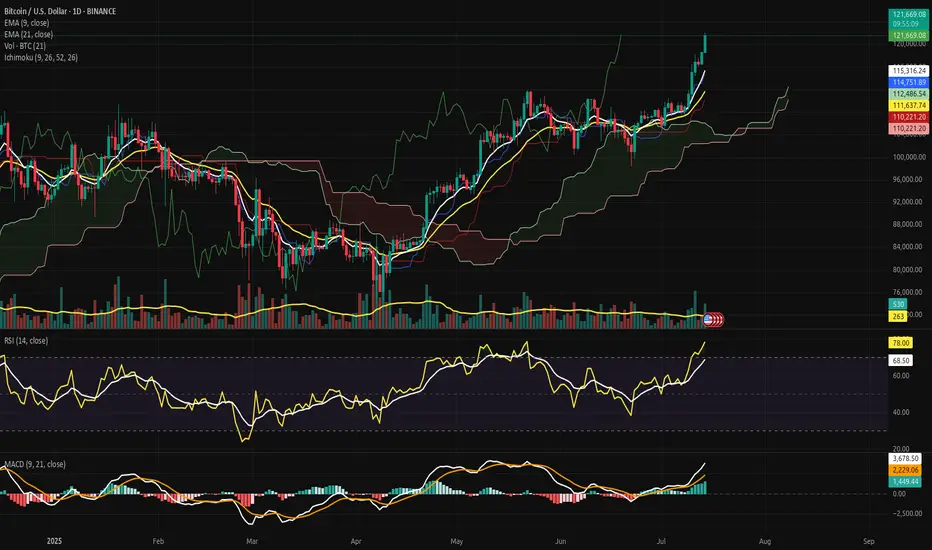
Bitcoin Ascends into the Clear Sky: Structural Break Confirmed.⊣
⟁ BTC/USD - BINANCE - (CHART: 1D) - (Jul 14, 2025).
◇ Analysis Price: $121,662.29.
⊣
⨀ I. Temporal Axis - Strategic Interval - (1D):
▦ EMA9 - ($115,313.08):
∴ The EMA9 is aggressively sloped upward, serving as dynamic support during the latest expansion phase.
✴️ Conclusion: Bullish control confirmed; momentum is guided tightly by the EMA9 anchor.
⊣
▦ EMA21 - ($111,636.30):
∴ EMA21 remains positively inclined, acting as a structural trend base beneath price and volume clusters.
✴️ Conclusion: Market remains structurally sound as long as price stays above the 21-day mean.
⊣
▦ Volume + EMA21 - (Volume: 497.79 BTC - EMA21: 262 BTC):
∴ Volume surge surpasses the rolling average, confirming institutional participation and breakout legitimacy.
✴️ Conclusion: Volume expansion validates price movement - no signs of divergence or exhaustion detected.
⊣
▦ RSI + EMA9 - (RSI: 77.99 - EMA9: 68.49):
∴ RSI has entered overbought territory, yet its trajectory remains upward and wide above its smoothing band.
✴️ Conclusion: Bullish momentum sustained; overbought conditions not yet reversing.
⊣
▦ MACD - (9, 21, 9) + EMA's smoothing:
∴ MACD: 3,271.60 | Signal: 2,013.81 | Divergence: +1,257.79;
∴ The MACD line is expanding positively over its signal, confirming momentum acceleration.
✴️ Conclusion: Technical conviction favors bullish continuation; signal remains clean and unsaturated.
⊣
▦ Ichimoku Cloud - (9, 26, 52, 26):
∴ Price is decisively above the Kumo cloud - “Clear Sky” territory;
∴ Senkou Span A = 121,653.30 | Senkou Span B = 112,486.54;
∴ Tenkan and Kijun lines are sharply elevated, confirming trend authority.
✴️ Conclusion: Zero resistance above; cloud projection supports further upward development.
⊣
🜎 Strategic Insight - Technical Oracle:
∴ All indicators are aligned in a rare harmonic convergence, signaling trend expansion with no current topping structure;
∴ Market shows the behavior of an advanced impulse wave entering Phase II expansion;
∴ Strategic play remains bullish - pullbacks, if any, should be shallow and fast.
⊣
𓂀 Stoic-Structural Interpretation:
∴ Structurally Bullish – Tactically Advancing
⊢
⧉
Cryptorvm Dominvs · ⚜️ MAGISTER ARCANVM ⚜️ · Vox Primordialis
⌬ - Wisdom begins in silence. Precision unfolds in strategy - ⌬
⧉
⊢
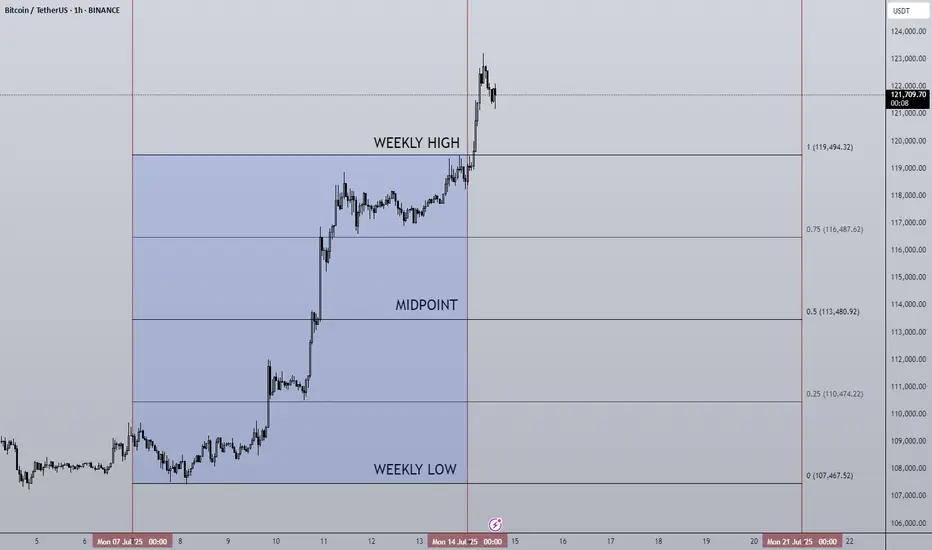
14/07/25 Weekly OutlookLast weeks high: $119,494.32
Last weeks low: $107,467.52
Midpoint: $113,480.92
NEW BTC ATH!
This is what we've all been waiting for, BTC breaks through resistance at $110,000-112,000 to set a the highest weekly close ever ($119,086). Thanks to a further $2.27B net inflows via BTC ETFs, the passing of the "big beautiful bill" flipping from a more deficit reduction stance by the US to an environment perfectly suited to risk on assets. Things are looking good for Bitcoin.
This week already in the Asia session BTC has broken above the weekly high to hit $123,100. Despite this incredible rally BTC.D has been falling since Thursday of last week. To me this signals altcoins have started to play catch up and we've seen that with ETH breaking $3000 (+14% relative to BTC).
I would like to see BTC consolidating here above the weekly high while altcoin majors break their choppy rangebound environments and shift to a trending environment just as BTC had last week.
There are also major data releases this week:
Tuesday CPI
Wednesday PPI
Thursday Euro CPI
Thursday US Initial Jobless Claims
I do not expect these data releases to have a major effect on the markets in their current state due to the risk appetite we've seen in both crypto and equities, such shallow pullbacks prove the demand is there to absorb and sell-side pressure for now.
Now is an excellent time to back strong projects with great fundamentals that are breaking out from downtrends/ranges in both their USD & BTC pairs, as BTC.D drops alts can print some great returns. Beta plays of ETH & SOL can offer higher returns than the majors themselves in these market conditions too.
Good luck this week everybody!
BTC BUY / LONG SCALP TRADEWait for the entry to be filled, must use SL and don't use high margin on any trade. If TPs achieved first then ignore the trade.

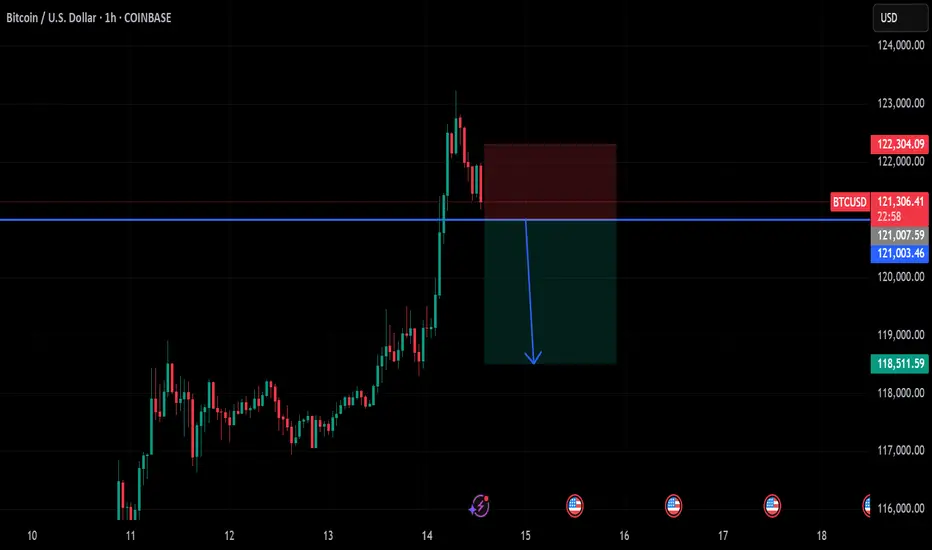
btc on sell below 121k#BTCUSD price now on reverse, expected entry below 121k on H1 closure.
Target 118500, Stop loss 122300. First short TP at 120500 for possible reverse on buy.
Bullish can take place if the H1 doesn't close below the sell entry, any breakout above 123k again will reach 125k.
Bitcoin may make correction movement to support levelHello traders, I want share with you my opinion about Bitcoin. Price recently printed a new ATH at 118800 points and then began to show signs of correction. Before this breakout, the price was stuck in a long downward channel, where it bounced inside the buyer zone (103000–103800) several times and reversed upward. After the final breakout, BTC entered a range phase between the support level (103800) and the support area (110300–111300), building energy before the massive move. Once the price escaped this range, a strong impulse up followed, pushing BTC above all major levels and reaching a new high. However, after hitting the ATH, the price started to stall and consolidate. Currently, we can see signs of weakness at the top — the structure is forming lower highs and looks unstable, which may indicate a potential retracement. Now the price is trading above the support area, but I expect a corrective move back toward the current support level at 110300. This level aligns with the top of the previous range and now acts as strong demand. That’s why I’ve set my TP at 110300 level — right at the beginning of potential buyer interest. Please share this idea with your friends and click Boost 🚀
Disclaimer: As part of ThinkMarkets’ Influencer Program, I am sponsored to share and publish their charts in my analysis.

Balla is still Bullish on BITCOIN. Cup & Handle pattern. The trend is still our friend.
I still see bullish developments in the price action.
We must have patience.
Dips still must be bought.
The plan hasn't changed.
We still aiming for that time period of 9 -15 months post #BTC Halving.
We are only one month down :)
