Bitcoin (BTC) - August 1Hello?
Welcome, traders.
By "following", you can always get new information quickly.
Please also click "Like".
Have a good day.
-------------------------------------
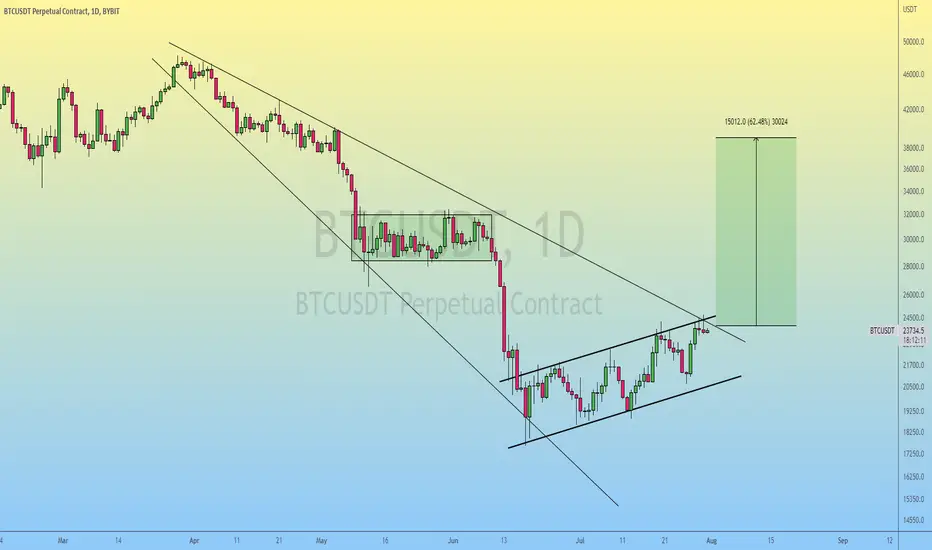
(BTCUSDTPERP 1D Chart)
After breaking above the 60 SMA level, support has not yet been confirmed.
So, you need to make sure it keeps the price above 22751.0.
In the Long/Short-S indicator, the oversold and overbought sections of the RSI are expressed as a background color.
In the CCI-C indicator, when the short-term CCI line is below -100 and above +100, oversold and overbought sections are expressed as background colors.
There are differences in the trading method depending on the investment period.
Therefore, it is recommended to select an investment period first and start trading before starting trading.
It can be very unfavorable to look at a 1D chart and trade for same day trading.
Therefore, in order to trade on the same day, it is recommended to trade by looking at the minute chart or hour chart.
Determining the investment period first, starting a trade, and then changing the investment period according to the fluctuation of the price can be one of the factors that makes the trade unsuccessful.
For example, trying to sail farther than your destination with a tank of oil to sail to your destination is the same as having to settle at your destination because you can drift in the open sea.
In order to change the investment period during profit or loss, it is necessary to respond accordingly.
In order to hold a position for a longer period of time, a split liquidation should relieve the psychological pressure of price volatility.
( 1h chart)
** On the 1h chart, a sharp move is likely to occur, so a short-term response is recommended.
You need to make sure it is supported in the section 23437.6-23772.9.
If unsupported, I would expect a move towards the 22751.0 area.
- If the HA-High indicator creates a long horizontal line, it is more likely to decline,
- When the HA-Low indicator creates a long horizontal line, it is more likely to rise.
------------------------------------------------------------ -------------------------------------------
** All indicators are lagging indicators.
Therefore, it is important to be aware that the indicator moves accordingly with the movement of price and volume.
However, for the sake of convenience, we are talking in reverse for the interpretation of the indicator.
** The MRHAB-T indicator used in the chart is an indicator of our channel that has not been released yet.
** The OBV indicator was re-created by applying a formula to the DepthHouse Trading indicator, an indicator disclosed by oh92. (Thanks for this.)
** Support or resistance is based on the closing price of the 1D chart.
** All descriptions are for reference only and do not guarantee a profit or loss in investment.
(Short-term Stop Loss can be said to be a point where profit and loss can be preserved or additional entry can be made through split trading. It is a short-term investment perspective.)
---------------------------------
1-XBTUSD

sp(x)good afternoon,
there are many ways to interpret this count (both bull and bear),
but i just can't look at this ugly move and be bullish with the herds.
gotta go with this being a bear rally for now.
----
take note of this major hidden bearish divergence on the daily

"the rekkoning"good afternoon ~
----
the last month or so has been a chop filled mess.
the bulls are saying the bottom is in,
the bears keep getting liquidated,
while i watch patiently from a distance.
----
take note of this daily rsi:
once the daily rsi surpasses the level of which it was at back in march, we will confirm a significant hidden bearish divergence.
if you don't know what a hidden bearish divergence is, let me tell you.
h.d is a bearish continuation pattern -
which means the lows will get taken out.
----
the move up has been extremely suspect to me, and i've entertained it from a hundred different angles, but nothing comes close to feeling more right than this current projection right here.
✌

Bitcoin | Make it or Break it..!!
#BTC (Update)
In Daily timeframe Chart, Bitcoin Bulls are Struggling to Clear the Trendline Resistance (24.4k)
Bulls Need to Reclaim the Resistance to Confirm the Wedge Breakout & In Case of Rejection, #Bitcoin Might Retest the 20.8k Support.
A Breakout and close above the 24.4k will open the Doors for a Rally to 40k 🚀
Please like the idea for Support & Subscribe for More ideas like this and share your ideas and charts in Comments Section..!!
Thanks for Your Love & Support..!!
Bitcoin (BTC) - July 31Hello?
Welcome, traders.
If you "follow", you can always get new information quickly.
Please also click "Like".
Have a good day.
-------------------------------------
(BTCUSDT 1D Chart)
If the price holds above 22753.10, it is expected to maintain an uptrend.
Primary resistance: around 25K
Secondary resistance: 27K-29K
Section A and the current location are different.
Therefore, it is expected to show a shorter decline than the decline after section A.
Therefore, it is likely to find support above 22753.10 and above 60 SMA.
The interval 27033.35-29812.52 is the interval that determines the trend.
Therefore, if it falls without being supported in the section 27033.35-29812.52, Stop Loss is required to preserve profit and loss.
This is because it will not turn into an uptrend and will likely form a continuous downtrend.
For a full-fledged uptrend to continue, it needs to rise above 29812.52.
------------------------------------------------------------ -------------------------------------------
** All descriptions are for reference only and do not guarantee a profit or loss in investment.
** The MRHAB-T indicator, which is inactive on the chart, contains indicators that indicate support and resistance points.
** The OBV indicator was re-created by applying a formula to the DepthHouse Trading indicator, an indicator disclosed by oh92. (Thanks for this.)
(Short-term Stop Loss can be said to be a point where profit and loss can be preserved or additional entry through split trading. It is a short-term investment perspective.)
---------------------------------

Short Bitcoin here at 24477The structure higher has completed and bitcoin should retrace. A short here should find support at 23,000

Bitcoin (BTC) - July 30Hello?
Welcome, traders.
By "following", you can always get new information quickly.
Please also click "Like".
Have a good day.
-------------------------------------
(BTCUSDTPERP 1D Chart)
After breaking above the 60 SMA line, there has been no confirmation of support yet.
So, you need to make sure you keep the price above 22751.0.
To determine a position, you must first check whether the 1D chart is up or down.
Otherwise, there is a possibility that the entry will be in the opposite direction.
- In order to enter the 'Long' position, it is advantageous to enter when it is oversold,
- To enter the 'Short' position, it is advantageous to enter the overbought period.
In the Long/Short-S indicator, the oversold and overbought sections of the RSI are expressed as a background color.
In the CCI-C indicator, when the short-term CCI line is below -100 and above +100, oversold and overbought sections are expressed as background colors.
( 1h chart)
** On the 1h chart, a sharp move is likely to occur, so a short-term response is recommended.
You need to make sure it is supported in the section 23437.6-23772.9.
- If the HA-High indicator creates a long horizontal line, it is more likely to decline,
- If the HA-Low indicator creates a long horizontal line, it is more likely to rise.
Therefore, the current state is more likely to rise.
However, it is expected that it will lead to further upside only when support is confirmed above 23955.5.
Otherwise, we expect volatility to occur when the 60 SMA line rises and crosses.
------------------------------------------------------------ -------------------------------------------
** All indicators are lagging indicators.
Therefore, it is important to be aware that the indicator moves accordingly as price and volume move.
However, for the sake of convenience, we are talking in reverse for the interpretation of the indicator.
** The MRHAB-T indicator used in the chart is an indicator of our channel that has not been released yet.
** The OBV indicator was re-created by applying a formula to the DepthHouse Trading indicator, an indicator disclosed by oh92. (Thanks for this.)
** Support or resistance is based on the closing price of the 1D chart.
** All descriptions are for reference only and do not guarantee a profit or loss in investment.
(Short-term Stop Loss can be said to be a point where profit and loss can be preserved or additional entry can be made through split trading. It is a short-term investment perspective.)
---------------------------------

total crypto market cap.Bitcoin longs are at all time highs,
but the market continues to plunge.
This could only mean one thing,
they're continuing to average down.
----
There's an old saying that goes a little like:
"The market can stay irrational, longer than you can stay solvent".
>Once the longs run out of $,
>Liquidations will kick in;
>Once liquidations start spiraling,
>The price will accelerate very quickly to the downside.
----
Be very cautious in the land of crypto,
and understand what it is that you're getting yourself into.
💰

BITCOIN (BTCUSD): Very Bullish Setup ₿
After Bitcoin set a new local higher high higher close 20th of July,
the price started a correctional move within a bullish flag pattern.
Trading in a minor bearish trend, the market finally bounced nicely.
The price managed to break and close above a resistance line of a bullish flag.
It may trigger a further bullish continuation.
Targets:
24,150
25,000
❤️If you have any questions, please, ask me in the comment section.
Please, support my work with like, thank you!❤️

Bitcoin (BTC) - July 29Hello?
Welcome, traders.
By "following", you can always get new information quickly.
Please also click "Like".
Have a good day.
-------------------------------------
(BTCUSDT 1D Chart)
If the price holds above 22753.10, it is expected to maintain an uptrend.
Primary resistance: around 25K
Secondary resistance: 27K-29K
The interval 27033.35-29812.52 is the interval that determines the trend.
Therefore, if it falls without being supported in the section 27033.35-29812.52, Stop Loss is required to preserve profit and loss.
This is because it will not turn into an uptrend and will likely form a continuous downtrend.
For a full-fledged uptrend to continue, it needs to rise above 29812.52.
------------------------------------------------------------ -------------------------------------------
** All descriptions are for reference only and do not guarantee a profit or loss in investment.
** The MRHAB-T indicator, which is inactive on the chart, contains indicators that indicate support and resistance points.
** The OBV indicator was re-created by applying a formula to the DepthHouse Trading indicator, an indicator disclosed by oh92. (Thanks for this.)
(Short-term Stop Loss can be said to be a point where profit and loss can be preserved or additional entry through split trading. It is a short-term investment perspective.)
---------------------------------

Bitcoin $37,000 Target (80% on 10X = 800% Potential)Pretty simple and straight forward...
How are you feeling today?
Who are the winners?
The winners are those who never quit;
The winners are those who persist;
The winners are those who can learn from mistakes;
The winners are those who keep trying even after really bad days!
We see Bitcoin growing by around 80% on the next bullish wave.
We base this prediction on data coming from hundreds of Altcoins charts, multiple indexes both in crypto and tradfi, market cycles, fundamentals & more.
We don't do leverage...
I mean, we do not recommend leverage trading for beginners but we know it is a tool that can be used for profits if one has the right mindset and lifestyle.
You need to be in a stable position in your life to be able to use this tool successfully.
Only after you have been trading profitably for 2-3 years, spot, you can try lev.
We go with 10X because the best time to go big on a LONG, is when we reach bottom not at the top.
You can see the MA200 analysis with the $37,000 BTCUSD target on the chart.
Thank you again for reading.
I am always grateful.
Namaste.

btc 7-28 update ~ 💥good afternoon o/
some nice moves this week.
---
btc looks to be approaching my og target which i've talked about over the last few weeks.
if you've seen any of my videos, you'll know what i'm referring to.
---
final move up will be a short squeeze, followed by fireworks 💥.
---
🔨🔨🔨🔨

Bitcoin Analyze (Where is the end of correction❗️❓)🧐Hi, everyone; today, I want to check out the end-of-correction of Bitcoin at Weekly Timeframe.
Bitcoin is reacting to lines of the Fibonacci Channel very well, so we can use it for finding the end of waves.
Bitcoin is looking to find the end of the main wave A; I expect that the end of Bitcoin's correction can occur in the PRZ zone; also, according to the analysis of the lower timeframes, a drop from the current price ranges is still expected.
🔆The structure of Main wave A is Double Zigzag Correction (WXY).
🔆When Bitcoin can break(Valid) the EMA 200 (Exponential Moving Average) and SMA 200 (Simple Moving Average), then we can verify the end of Main wave A.
🔆In addition, each time that Bitcoin was able to penetrate the space of EMA 200 ( Exponential Moving Average ) and SMA 200 ( Simple Moving Average ), some weeks later, Bitcoin started to rise.
Bitcoin Analyze ( BTCUSDT ) Timeframe Weekly⏰ (Log Scale)
Where is the end of wave A ❗️❓
🎯Target🎯: 17500$ until 14200$
Do not forget to put Stop loss for your positions (For every position you want to open).
Please follow your strategy, this is just my idea, and I will be glad to see your ideas in this post.
Please do not forget the ✅' like '✅ button 🙏😊 & Share it with your friends; thanks, and Trade safe.

If breakout fails -- more sidewaysThe charts are the result of a brute-force search for similar PA patterns over different timeframes in all of Bitcoin's price history.
Use your human intuition to judge which of these scenarios looks the most harmonious.
Some traders are able to stare at a blank chart for hours until they get a hunch, but I am not one of them.
To synthesize something completely new out of thin air is very difficult, but it is easier to judge if you are given some options.

Bitcoin (BTC) - July 28Hello?
Welcome, traders.
By "following", you can always get new information quickly.
Please also click "Like".
Have a good day.
-------------------------------------
(BTCUSDTPERP 1D Chart)
Primary Resistance: Rising Channel (23722.8-25373.3)
Secondary resistance: 27054.1-29840.6
1st support: 21481.1-22471.5
Second support: 19930.6-20564.2
The key is whether it can be supported in the 21481.1-22471.5 section and rise to the first resistance section.
The next volatility period is around July 31st.
(1h chart)
** On the 1h chart, a sharp move is likely to occur, so a short-term response is recommended.
The key is whether it can find support near 22471.5 and move higher than 23722.8.
If it goes down, you should see support near the 21481.1-21826.1 zone.
If it falls below 21481.1 this time, there is a possibility that it will fall below 20564.2.
-------------------------------
** Waves seen as HA-Low, HA-High, MS-Signal indicators **
Wave theory is only known after it has passed, so how you react is the key.
Therefore, it is recommended that wave theory be used only to confirm the continuity of a trend.
Regardless of any indicator or any theory, the most important thing is what kind of trading strategy you use to respond to price changes.
A trading strategy can only be executed if you create it yourself.
This is because trading strategies created by others may not be executed properly due to price volatility and may even hinder trading.
------------------------------------------------------------ -----------------------------------------------------
** All indicators are lagging indicators.
Therefore, it is important to be aware that the indicator moves accordingly with the movement of price and volume.
However, for the sake of convenience, we are talking in reverse for the interpretation of the indicator.
** The MRHAB-T indicator used in the chart is an indicator of our channel that has not been released yet.
** The OBV index was re-created by applying a formula to the DepthHouse Trading index, an index disclosed by oh92. (Thanks for this.)
** Support or resistance is based on the closing price of the 1D chart.
** All descriptions are for reference only and do not guarantee a profit or loss in investment.
(Short-term Stop Loss can be said to be a point where profit and loss can be preserved or additional entry through split trading. It is a short-term investment perspective.)
---------------------------------

Bitcoin (BTC) - July 27hello?
Welcome, traders.
By "following", you can always get new information quickly.
Please also click "Like".
Have a good day.
-------------------------------------
(BTCUSDT 1D Chart)
Primary Resistance: 23733.48-25389.99
Secondary resistance: 27033.35-29812.52
The July 24-26 volatility led to a move outside the 21475.02-23733.48 zone.
Therefore, the key is whether it can find support near 20573.89 and move above 21475.02.
If it goes down from 20573.89, you should check to see if it finds support in the 18719.11-199695.87 zone.
- When the Stoch RSI indicator is out of the oversold zone, you need to check where support and resistance are found.
For that to happen, it's important to be able to get support at 20573.89.
To sustain the uptrend, the price needs to rise above 21838.98 to hold the price.
The next volatility period is around August 10th.
------------------------------------------
(US 100 CFD (Nasdaq) 1D Futures Chart)
You need to make sure you can get support in the 12212.6-12932.3 section, which is an important support and resistance section.
If resistance is found at 12212.6, it is likely to move below 11728.0.
It needs to move above 12374.1 to sustain the uptrend.
------------------------------------------------------------
(BTC Dominance (BTC.D) 1D Chart)
A decline in BTC dominance is likely to lead to an uptrend in altcoins.
However, this is when the BTC price rises or goes sideways.
It can be seen that BTC is not leading the market because the price of BTC is currently falling or showing a sideways trend.
Under these market conditions, the decline in BTC dominance is likely to cause large volatility.
Considering the current position of the CCI-C indicator, I think that volatility is highly likely to occur when it falls to the 41.51-42.01 section.
------------------------------------------------------------ -------------------------------------------
** All indicators are lagging indicators.
Therefore, it is important to be aware that the indicator moves accordingly with the movement of price and volume.
However, for the sake of convenience, we are talking in reverse for the interpretation of the indicator.
** The MRHAB-T indicator used in the chart is an indicator of our channel that has not been released yet.
** The OBV indicator was re-created by applying a formula to the DepthHouse Trading indicator, an indicator disclosed by oh92. (Thanks for this.)
** Support or resistance is based on the closing price of the 1D chart.
** All descriptions are for reference only and do not guarantee a profit or loss in investment.
(Short-term Stop Loss can be said to be a point where profit and loss can be preserved or additional entry can be made through split trading. It is a short-term investment perspective.)
---------------------------------

btc 7-26 update ~ good morning,
---
this is the two ideas which stand in the way of btc going down to 13k.
>if btc flips 20,670 into resistance, it will invalidate the wxy,
>if the wxy is invalidated, there's a 66% chance btc will go down to 13k.
>33% chance it will play out the expanded flat.
( before confirming 13k, it will have to first invalidate this expanded flat).
---
13k theory 👇
---
ps. just a reminder - it is okay to be in cash.

ETHREUM - 5 WAVES AND BULL TRAPI will have in mind scenario where we make lower low, bounce nice but it's huge bull trap and then we bottom corectly.
That channel and 5 wave move can be helpful to not get into a trap.

BTC scam rally>multi zigzag as wave 3 of expanding diagonal to the downside
>rally up 9% to scam pump
>this projection would also form an inverse head and shoulders for a potential bulltrap after the scam rally.
>lead into new moon
>tank

Bitcoin (BTC) - July 26Hello?
Welcome, traders.
If you "follow", you can always get new information quickly.
Please also click "Like".
Have a good day.
-------------------------------------
(BTCUSDTPERP 1W Chart)
RSI Indicator: Oversold Zone
Stoch RSI Indicator: Overbought Zone
Therefore, it is expected to show mixed results.
It is necessary to determine where support and resistance are received.
(1D chart)
Primary Resistance: Rising Channel (23722.8-25373.3)
Secondary resistance: 27054.1-29840.6
1st support: 21481.1-22471.5
Second support: 19930.6-20564.2
The key is whether it can be supported in the 21481.1-22471.5 section and rise to the first resistance section.
The next volatility period is around July 31st.
(1h chart)
** On the 1h chart, a sharp move is likely to occur, so a short-term response is recommended.
You need to see support at the 21481.1-22471.5 section and see if it is moving along the uptrend line.
It can temporarily touch the 20564.2-21481.1 section and rise, so be prepared for this.
At this time, if it fails to move above 22471.5, it is likely to lead to further declines.
------------------------------------------------------------ -------------------------------------------
** All indicators are lagging indicators.
Therefore, it is important to be aware that the indicator moves accordingly as price and volume move.
However, for the sake of convenience, we are talking in reverse for the interpretation of the indicator.
** The MRHAB-T indicator used in the chart is an indicator of our channel that has not been released yet.
** The OBV indicator was re-created by applying a formula to the DepthHouse Trading indicator, an indicator disclosed by oh92. (Thanks for this.)
** Support or resistance is based on the closing price of the 1D chart.
** All descriptions are for reference only and do not guarantee a profit or loss in investment.
(Short-term Stop Loss can be said to be a point where profit and loss can be preserved or additional entry through split trading. It is a short-term investment perspective.)
---------------------------------

13k?bitcorn is accelerating rather quickly into the new moon which shall appear within 3 days.
each new moon, bitcorn dives deeper into the abyss.
each time, the bulls will say it's different,
and each and every time it leads to the same exact result.
---
in my last post, i entertained the bullish path which bitty could potentially take,
but it's moving faster than i'd like it to.
it's a lot more probable we take out the lows into the middle of august, potentially wick 13\14k before moving up for real.
that might seem like a pretty significant drop for some, but it's just another day in crypto land.
---
neither the bull nor the bear case is confirmed for now; it's currently a waiting game.
i'm 99% cash since before we even topped out, taking little trades along the way, but nothing too significant until the middle of august comes around.
---
trade safe o/

Bitcoin Analyze (Short Term, Timeframe 2H)!!!🧐Bitcoin is moving in the Leading Diagonal Pattern & PRZ (Price Reversal Zone); I expect that it will attack to Heave Resistance Zone again and then go down (it will not make a new high).
🔴Heavy Resistance Zone🔴: 24100$ to 23020$
❗️ Note ❗️: If Bitcoin can break the Heavy Resistance zone, the Scenario will change (Low possible).
Do not forget to put Stop loss for your positions (For every position you want to open).
Please follow your strategy, this is just my idea, and I will be glad to see your ideas in this post.
Please do not forget the ✅' like '✅ button 🙏😊 & Share it with your friends; thanks, and Trade safe.

3Ok?i got to thinking this evening,
a lot of people are really bearish, myself included.
so why would the market randomly go down to feed all of these bears?
much more probable for it to go higher, to give people the idea that we have found a bottom,
then crash down to crush everyone's dreams lol.
---
this is not my primary projection, but this is gaining a lot of probability as the days go by.
---
if this does play out, i'll be looking for a back-test of 20k into august 12th,
followed by a rally into September to roughly 30k.
i do believe we'll make a new low afterwards, but it can take a few months before we see it happen.
