Bitcoin Analyze (Short Term, Timeframe 15min)!!!Bitcoin is playing in Ascending Channel; at the same time, it was able to make Inverse Head and Shoulder. We saw the pullback to the necking line these hours + Hidden Divergence (HD+).
Bitcoin can go up near Inverse Head and Shoulder's Target.
Bitcoin Analyze ( BTCUSDT ) Timeframe15min⏰
Do not forget to put Stop loss for your positions (For every position you want to open).
Please follow your strategy, this is just my idea, and I will be glad to see your ideas in this post.
Please do not forget the ✅' like'✅ button 🙏😊 & Share it with your friends; thanks, and Trade safe.
1-XBTUSD

Bitcoin (BTC) - May 13hello?
Traders, welcome.
By "following", you can always get new information quickly.
Please also click "Like".
Have a nice day.
-------------------------------------
(BTCUSDTPERP 1D Chart)
Primary resistance: around 35280.2
Secondary resistance: around 38200.0
Support: 27054.1-29840.6
- around 27054.1
- 28951.7-29840.6
If the 27054.1-29840.6 section is supported with a trading volume of 766.5K or more, it is expected to rebound.
However, you should watch the flow carefully as there is a possibility that it may move near the uptrend line before moving up and then move up.
It must rise above 35280.2 to turn into an uptrend.
(1h chart)
** A short-term response is recommended as sharp movements are likely to occur on the 1h chart.
It is falling while failing to rise above 29840.6.
It is necessary to check whether there is support in the section 27054.1-28951.7.
If it finds support (if it finds support again near the 27054.1 area), it is expected to lead to a move towards moving higher above 29840.6 again.
If this attempt fails, it is likely to drop below 27054.1, so trade cautiously.
------------------------------------------------------------ -----------------------------------------------------
** All indicators are lagging indicators.
Therefore, it is important to be aware that the indicator will move accordingly as price and volume move.
However, for the sake of convenience, we are talking in reverse for the interpretation of the indicator.
** The MRHAB-T indicator used in the chart is an indicator of our channel that has not been released yet.
** The OBV indicator was re-created by applying a formula to the DepthHouse Trading indicator, an indicator disclosed by oh92. (Thanks for this.)
** Support or resistance is based on the closing price of the 1D chart.
** All descriptions are for reference only and do not guarantee a profit or loss in investment.
(Short-term Stop Loss can be said to be a point where profit and loss can be preserved or additional entry can be made through split trading. It is a short-term investment perspective.)
---------------------------------

"the bottom"good afternoon ladies and gentlemen,
btc is about to mark a significant bottom.
this bottom will be talked about in the books for many years to come.
a lot of people have pretty much panic sold, and quit;
but we the wolves awaited the full moon which comes into the sky on the 15th.
once the moon appears, you will hear the howls across the lands.
and we the wolves,
shall prosper.
---
long 22~23k
💰
Buy in Panic Sell?Just a wave for complete pattern.
In this scenario, this drop could be a c-wave of drop.

Bitcoin (BTC) - May 12hello?
Traders, welcome.
If you "follow", you can always get new information quickly.
Please also click "Like".
Have a nice day.
-------------------------------------
(BTCUSDT 1W Chart)
Resistance: around 38150.02
Strong support: 27033.35-29812.52
It is important to have support in the section 27033.35-29812.52.
If it falls below 27033.35, it is expected to turn into a downtrend from a mid- to long-term perspective.
However, looking at the diagonal Fibonacci, I think there is a high possibility that it will temporarily fall below 27033.35 and then rise.
(1D chart)
Primary resistance: around 32259.90
Secondary resistance: around 35045.0
Strong support: 27033.35-29812.52
- 28923.63-29812.52
- Around 27033.35
There is a lot of trading volume above 88.696K.
Also, with volume above 177.392K, I think the chances of a reversal are increasing.
However, looking at the 1W chart above, it can be seen that the trading volume is not large enough to change the trend in the mid- to long-term as no trading volume above 612K has occurred.
Therefore, it is necessary to see if there is enough trading volume to touch 1.224M on the 1W chart with trading volume above the current level this week and next week.
A temporary rebound is likely due to an increase in volume above 177.392K on the 1D chart.
We need to see if this rebound can find support above 29812.52.
Since a volume profile section is formed near 28923.63, it is necessary to check whether a sideways trend with trading volume can be obtained from the current location.
The next volatility period is around June 5th.
------------------------------------------------------------ -----------------------------------------------------
** All indicators are lagging indicators.
Therefore, it is important to be aware that the indicator will move accordingly as price and volume move.
However, for convenience, we are talking in reverse for the interpretation of the indicator.
** The MRHAB-T indicator used in the chart is an indicator of our channel that has not been released yet.
** The OBV indicator was re-created by applying a formula to the DepthHouse Trading indicator, an indicator disclosed by oh92. (Thanks for this.)
** Support or resistance is based on the closing price of the 1D chart.
** All descriptions are for reference only and do not guarantee a profit or loss in investment.
(Short-term Stop Loss can be said to be a point where profit and loss can be preserved or additional entry can be made through split trading. It is a short-term investment perspective.)
---------------------------------

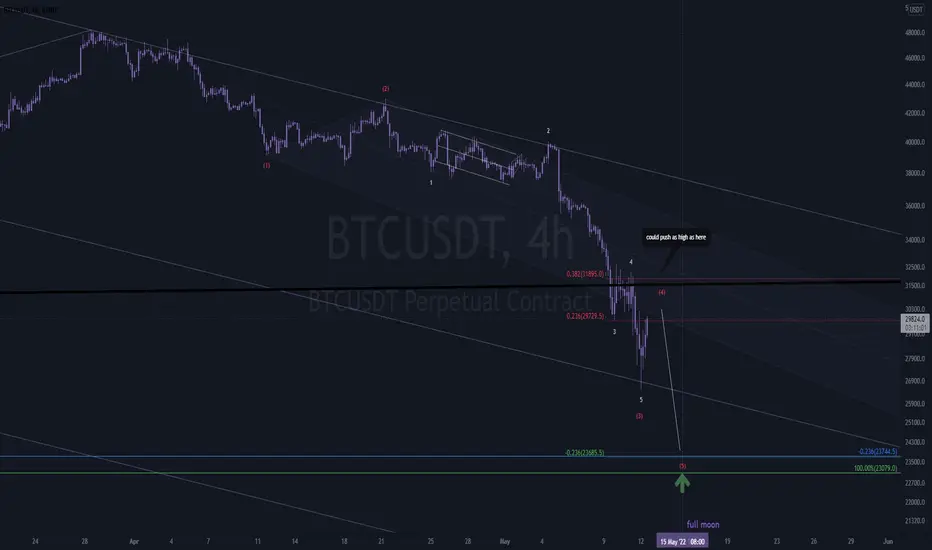
"The flippening"The end for one,
is just a new beginning for another.
----
I'm looking for a pivot up on May 15th.
Highest probability target I can come up with sits between 23,984.4 ~ 22,983.80.
There is a big level underneath it at 19,982.70 which can be wicked.
----
bullish going into the summer.

bitcorn 😎good evening,
looks like the attempt at the short squeeze has failed, and it was almost expected.
---
>btc broke down below a key algorithmic weekly channel.
>playing out a sequence of bearish impulses to the downside.
few key levels to keep an eye on:
24~25k (monthly 55ema)
24k = -0.236 of wave 5 of the impulse going down.
23k = 100% extension of the larger move down from 68k
21k = michael saylor gets a margin call
19k = 123.60% extension of the larger move
14.6k = 1.618% extension, aka expansion target.
where it stops is beyond me, but i can theorize \ try at ever level with a very tight stop.
ps. there is a full moon on 5\15, a historical indication of a local bottom \ bullish reversal.
ps.2. despite the 60% decline since november, people still seem to be bullish (myself included lol), which makes me think there's more pain to come. when despair sets in, the bottom will be near.
✌

BTCUSD Long BetI am buying here
And have a bet, 'BTC wont go below may 9-10 low'
Hopefully we dont want BTC to breach 5D 200 white SMA. When it breaches there's usually -40% move.
But I am long from here.
3 2 1... and we wait.
Thank you for giving your time on my post.
If it helps please do follow me.
You all APES, Have a Good Day :)

Bitcoin (BTC) - May 11hello?
Traders, welcome.
If you "follow", you can always get new information quickly.
Please also click "Like".
Have a nice day.
-------------------------------------
(BTCUSDTPERP 1D Chart)
Resistance: 35280.2-38200.0
Support: 27054.1-29840.6
It is showing support, accompanied by higher-than-average trading volume.
However, it seems insufficient to change the trend.
To change the trend, I think the volume needs to increase above 1.533M.
However, if the 27054.1-29840.6 section shows support while maintaining the current volume level, it is expected to reverse the trend.
The 27054.1-29840.6 zone is an important support and resistance zone.
Therefore, if it falls below 27054.1, there is a possibility of a sharp movement and a touch near 21481.1.
These moves are likely to be temporary and are expected to rise above 27054.1 again.
(1h chart)
** A short-term response is recommended as sharp movements are likely to occur on the 1h chart.
It fell after failing to break above 32275.6.
A finding of support at 30776.6 is expected to lead to an attempt to move higher above 32275.6.
------------------------------------------------------------ -------------------------------------------
** All indicators are lagging indicators.
Therefore, it is important to be aware that the indicator moves accordingly with the movement of price and volume.
However, for convenience, we are talking in reverse for the interpretation of the indicator.
** The MRHAB-T indicator used in the chart is an indicator of our channel that has not been released yet.
** The OBV indicator was re-created by applying a formula to the DepthHouse Trading indicator, an indicator disclosed by oh92. (Thanks for this.)
** Support or resistance is based on the closing price of the 1D chart.
** All descriptions are for reference only and do not guarantee a profit or loss in investment.
(Short-term Stop Loss can be said to be a point where profit and loss can be preserved or additional entry can be made through split trading. It is a short-term investment perspective.)
---------------------------------

Bitcoin Analyze (Expanding Flat)!!!Bitcoin was able to make one of the most common patterns ( Expanding Flat ) of correction these days, I expect that end of main wave C of this pattern will be around Resistance Zone (42360$_42220$), and my TRZ (Time Reversal Zone).
Bitcoin Analyze ( BTCUSDT ) Timeframe 4h ⏰
🔴 Resistance Zone : 42360$_42220$
Do not forget to put Stop loss for your positions (For every position you want to open).
Please follow your strategy , this is just my idea, and I will be glad to see your ideas in this post.
Please do not forget the ✅' like' ✅ button 🙏😊 & Share it with your friends; thanks, and Trade safe.

btc 5-11 update ~good morning o/
(or late night)
if the cpi data comes back positive today,
i think there's a very high likelihood of us seeing a massive short squeeze.
55k would be the upside target, on a full on expanded flat.
shared this scenario a few days ago view, check out the original thread 👇
ps. it can absolutely go the other way as well, so don't throw in more than you are willing to risk.
~not financial advice, just a drawing 😎

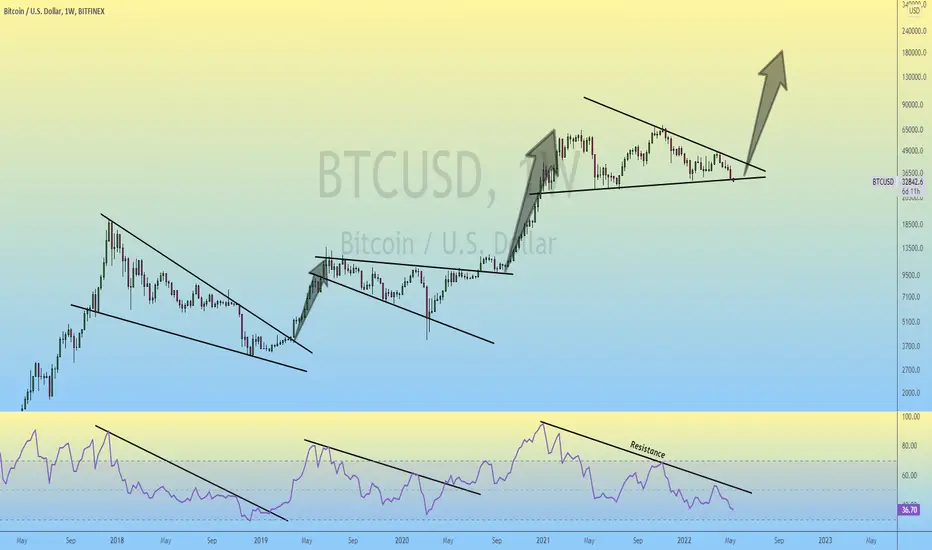
Bitcoin (Macro) Elliott Wave Theory Analysis.Good afternoon peoples;
Thought I'd share my macro outlook on Bitcoin with you all.
This particular count has been one of the biggest challenges I've ever faced in these markets, but after a few years of experience - I feel I've finally tackled it.
-----
To keep things real simple, the chart says it all.
I think we're going to see 22k by around July,
after which btc will run to 126k.
126k will mark a significant cycle top, and a very large correction will take place after (which could last a few years).
I'm not going to talk too much about that right now since that's way in the future, but I will absolutely bring it up when the time comes.
-----
The market is by no means linear, so my view is subject to change as more data presents itself in the months ahead.
If any significant changes take place, you know I'll be the first to give you an update about it.
I've no bias in this market, I don't read\watch the news; all of my projections are strictly based on the methods that were taught to me by a very talented technical trader.
I have no idea what will cause these large moves either, nor does it matter to me right now.
The chart paints a very beautiful picture, and it is based off this picture which I base all of my trades on,
nothing else.
-----
Grand Cycle Wave 3 = $126k
Grand Cycle Wave 4 = $10k
Grand Cycle Wave 5 = $1.6M
💰

Bitcoin (BTC) - May 10hello?
Traders, welcome.
If you "follow", you can always get new information quickly.
Please also click "Like".
Have a nice day.
-------------------------------------
(BTCUSDT 1M Chart)
Strong support: 27033.35-29812.52
You can see that the trading volume is on a downward trend.
This shows that the market atmosphere is waiting.
(BTCUSDT 1W Chart)
Resistance: around 38150.02
Strong support: 27033.35-29812.52
The section 27033.35-29812.52 is a support section formed by opening the 20K era.
Therefore, I think it is a meaningful support section.
Therefore, support in the section 27033.35-29812.52 is an important observation point.
(1D chart)
Primary resistance: around 35045.0
Secondary resistance: around 38150.02
Strong support: 27033.35-29812.52
- 28923.63-29812.52
- Around 27033.35
As it fell below 35045.0, I think the bottom is broken.
We need to see if there is support and resistance to form a new floor section.
A volume profile section is formed at the 28923.63 point.
Therefore, it is necessary to check whether a sharp movement or an increase in trading volume occurs as it approaches 28923.63.
If the downtrend is slowed by such a move, I think it is highly likely to lead to a strong rebound.
The next volatility period is around June 5th.
------------------------------------------------------------ -----------------------------------------------------
** All indicators are lagging indicators.
Therefore, it is important to be aware that the indicator will move accordingly as price and volume move.
However, for convenience, we are talking in reverse for the interpretation of the indicator.
** The MRHAB-T indicator used in the chart is an indicator of our channel that has not been released yet.
** The OBV indicator was re-created by applying a formula to the DepthHouse Trading indicator, an indicator disclosed by oh92. (Thanks for this.)
** Support or resistance is based on the closing price of the 1D chart.
** All descriptions are for reference only and do not guarantee a profit or loss in investment.
(Short-term Stop Loss can be said to be a point where profit and loss can be preserved or additional entry can be made through split trading. It is a short-term investment perspective.)
---------------------------------

btc 5-10 update ~good morning o/
nice little relief rally for da bulls
but i'm afraid that's all this really is,
a wave 4 bounce.
could go as high as 34k before seeing another leg down to around 27.2k (where i will become a buyer).
----
what i have projected on my chart,
is the highest probability path i could see for bitcoin from here,
to complete the larger corrective phase.
PS. if it could push above 34k, then there could potentially be something else going on (view my post from yesterday for more context)

btc 5-9 update ~greetings folks o/
here's a little idea that would really shake things up the overall markets.
a raid of the summer lows, followed by a massive short squeeze that would accelerate very quickly.
----
This doesn't have to happen, but it can.
for now i'm playing it from this perspective, but my bias is subject to change.
tight stop below 28k.
~ Looking for 53k on this squeeze (if it was to happen).

Bitcoin | Just Hodl it..!!
#BTC Analysis :-
Bitcoin Price has Dropped 50% From All time High in Last 6 Months, Bears in Complete Control but Bulls will be Back Stronger..!
Keep in Mind that If You Still Surviving the 6-Months Bear Phase then You Definitely Deserve the Bull Run, Just Hodl it.
In Weekly Chart, Bitcoin has been Consolidating in Triangle since January 2021.
RSI has also been Moving Below the Trendline since January 2021.
So Bitcoin Bulls need to Defend the 30k Crucial Support & Reclaim the 42k Resistance to Confirm the Triangle Upside Breakout.
If Triangle Broken Upside, Expecting Another Bull Run like September 2020..
Please like the idea for Support & Subscribe for More ideas like this and share your ideas and charts in Comments Section..!!
Thanks for Your Love & Support..!!
Bitcoin (BTC) - May 9hello?
Welcome, traders.
By "following", you can always get new information quickly.
Please also click "Like".
Have a nice day.
-------------------------------------
(BTCUSDTPERP 1W Chart)
Resistance: 37243.4-38200.0
Support: 32275.6-35280.2
Strong support: 27054.1-29840.6
As with the previous flow of sections A and B, it is necessary to check whether support can be obtained near 32275.6 this time.
A break below 32275.6 is expected to touch the uptrend line (1).
However, there is a possibility that it may rise within the square drawn in the 35280.2-38200.0 section, so careful trading is required.
(BTCUSDTPERP 1D Chart)
Primary resistance: around 38200.0
Secondary resistance: 39915.9-40500.3
1st support: around 32275.6
2nd support: 27054.1-29840.6
It is expected to break below the bottom section formed by falling below 35280.2.
This means it will continue to decline further until it forms a new bottom.
However, we need to check if it leads to a sharp rise like this trend when it declines to around 32275.6.
If there is no sharp rise and a steady decline below -10% means that expectations for an uptrend are relatively low, the trade can proceed.
As the price rose above 20K, it formed a new support zone in the 27054.1-29840.6 zone.
Therefore, a decline to the 27054.1-29840.6 section is expected to receive strong support.
(1h chart)
(eng)
** A short-term response is recommended as sharp movements are likely to occur on the 1h chart.
(The OBV indicator displayed in the price chart is an indicator that will be displayed in the price chart by changing the formula from the existing secondary indicator OBV indicator.)
It is necessary to check at which point the newly formed OBV indicator point is formed.
The OBV indicator rose from 7230.4 on May 6 to around 35980.3.
Since then, the price has decreased and is currently forming around 34813.3.
It is important to be able to sustain the price above the OBV indicator point.
The OBV indicator is the indicator you want to display when passing the '0' point.
A point of '0' on the OBV indicator means that the buying and selling pressures are equal.
Therefore, it can be interpreted that buying is dominant when it rises above the OBV indicator point indicated on the price chart.
------------------------------------------------------------ -----------------------------------------------------
** All indicators are lagging indicators.
Therefore, it is important to be aware that the indicator moves accordingly with the movement of price and volume.
However, for the sake of convenience, we are talking in reverse for the interpretation of the indicator.
** The MRHAB-T indicator used in the chart is an indicator of our channel that has not been released yet.
** The OBV indicator was re-created by applying a formula to the DepthHouse Trading indicator, an indicator disclosed by oh92. (Thanks for this.)
** Support or resistance is based on the closing price of the 1D chart.
** All descriptions are for reference only and do not guarantee a profit or loss in investment.
(Short-term Stop Loss can be said to be a point where profit and loss can be preserved or additional entry can be made through split trading. It is a short-term investment perspective.)
---------------------------------

btc 5-8 update~good evening folks,
btc seems to be taking the chill route.
this route pushes down to 22k over the next few months.
-----
>watch for a few raids in the days ahead,
>followed by a little short squeeze once enough liquidity has been captured.
cash is king during these times.
all of the moves up will be sold into (most likely).
scalps are the way for the time being.
ps. the (triangle) case still remains in tact but is very improbable as of today.
once the low of 32.9k is breached, the triangle becomes nothing more than history.

btc 5-6 update greetings,
what i have portrayed here is a potential path btc could take to get to the 22k algo target.
(not saying this is what's going to happen; this is just an idea).
-----
it's not going to be straight down like some people are expecting;
we'll see a short squeeze somewhere along the way
to push the bears out of the market before the final leg down comes.
-----
as mentioned a few days back, i still remain to be in cash.
there's no real sign of life for now, thus - no reason for me to be a buyer yet.
if a sign of life appears, i'll let you know.
have a nice weekend peoples
🥂

few more scenariosgreetings o/
as btc approaches my buy zone ($33,250),
things are starting to get heated in the market.
---
let's entertain the idea where btc invalidates the triangle idea; because let's be honest - it's very likely that it will.
there's plenty weakness in the market, and if it was to drop below the low from jan 24th (32918.7) i could see two potential paths which it could take.
#1 - the green path (my worst nightmare lol)
green projects what we call an expanded flat in elliott wave theory - where the low is breached in a 3 wave move - all the long stops are raided, but a big player buys right into it causing a squeeze to the upside (most likely to that 50k zone).
#2 - the red path (the chill scenario)
btc would basically just continue playing out the impulse to the downside + bounce once more time along the way to form a simple zig-zag.
that zig-zag would complete the larger wxy which had begun back in november.
downside target on both of these sits at 22.8k (the larger wave 4 algo target).
---
while i do prefer the triangle, i can't be attached to it.
so if it was to get invalidated, i would be ready for whatever shenanigans this market was to throw my way.
stop losses are your friend,
cash is king;
stay safe my peoples.
✌

Bitcoin (BTC) - May 8hello?
Traders, welcome.
If you "follow", you can always get new information quickly.
Please also click "Like".
Have a nice day.
-------------------------------------
(BTCUSDT 1W Chart)
Resistance: 46487.52-49266.69
1st support: 37253.81-38150.02
2nd support: 32259.90-35045.0
It is important to see if you can move up along an uptrend line.
(1D chart)
Primary resistance: around 39942.38
Secondary resistance: around 45135.66
Support: 35045.0-38150.02
- 37253.81-38150.02
- 35045.0-36244.55
To break the formed floor section, it must fall below 35045.0.
It must rise above 38150.02 to turn into an uptrend.
The next volatility period is around June 5th.
------------------------------------------------------------ -----------------------------------------------------
** All indicators are lagging indicators.
Therefore, it is important to be aware that the indicator will move accordingly as price and volume move.
However, for convenience, we are talking in reverse for the interpretation of the indicator.
** The MRHAB-T indicator used in the chart is an indicator of our channel that has not been released yet.
** The OBV indicator was re-created by applying a formula to the DepthHouse Trading indicator, an indicator disclosed by oh92. (Thanks for this.)
** Support or resistance is based on the closing price of the 1D chart.
** All descriptions are for reference only and do not guarantee a profit or loss in investment.
(Short-term Stop Loss can be said to be a point where profit and loss can be preserved or additional entry can be made through split trading. It is a short-term investment perspective.)
---------------------------------

bitcorn (primary case)good evening o/
firstly, i'd like to just say; i've shared all the bear cases i could think of,
and while they might look appealing to some - they don't look that appealing to me.
i share tons of scenarios, even the ones i am not that big a fan of.
why?
because the market isn't linear, and i like to be prepared for every possible outcome.
most people just buy and hold things<
<i'm in cash 95% of the time.
all of my trades are short term scalps (in either direction).
ask any single person how much they made since btc topped out back in november;
then ask me 🥂.
----
i saw this correction coming before it even topped out.
people called me absolutely ridiculous for even considering the idea of btc dropping back down to 30k,
but i stuck to it, and we've come a really long way.
no hard feelings to all the bag holders,
but i'm not about that kind of lifestyle.
----
----
----
last night i shared a chart on the dxy,
check it out if you haven't yet:
that dxy chart is the reason why i believe that a bottom could be looming right around the corner,
(in the next 1-2 weeks in the overall markets).
it rhymes beautifully with the spx500 as well:
add the current level of fear into this equation,
and we got a perfect storm for a massive bull run on the horizon.
----
the majority of the market is absolutely bearish right now.
the majority of the market is also wrong 95% of the time.
people get emotionally attached to ideas,
which in turn makes them lose moneys.
i have 0 attachment in this market, 0 bias.
all my trades are based off the chart patterns that are presented to me on a daily.
i might not be right every single time, but it's not about being right - it's about risk management.
----
----
----
if my theory for the dxy holds true,
there's a good chance bitcoin runs to $100k+ in the year ahead,
there's also a really good chance the spx500 runs to $5750 during the same time.
----
the trade here is simple;
if btc manages to stay above $32918.7 (stop loss below)
the triangle idea will become a reality,
and all the brave souls buying into this fear,
will be rewarded big time.
🥂
ps. i always go with the unpopular opinion.
ps2. it's fine if btc goes below the bottom trendline(don't panic), so long as it stays above 32.9k, we are good 💰.

Bitcoin (BTC) - May 7hello?
Traders, welcome.
If you "follow", you can always get new information quickly.
Please also click "Like".
Have a nice day.
-------------------------------------
(BTCUSDTPERP 1D Chart)
Primary resistance: 39915.9-40500.3
Secondary resistance: around 45163.4
Support: 35280.2-38200.0
- 37243.4-38200.0
- 35280.2-36230.0
During the volatility period of 2-4 May, it failed to rise to the 39915.9-40500.3 section, the primary resistance section, and showed a larger decline.
It is necessary to check whether there is support in the section 35280.2-38200.0, which we think is forming the bottom.
If it falls below 35280.2, it is highly likely that it will fall below 32275.6, so you need to trade cautiously.
At this time, what is important to look at is whether the trading volume explodes.
In the coin market, the transaction itself is atrophied due to many external factors.
Therefore, even if the price rises, it cannot survive and has no choice but to fall.
If the volume explodes as in the previous case when it falls below 35280.2, it is expected to rise above 38200.0 and turn into an uptrend.
(Reference)
When I say transition to an uptrend as mentioned above, I'm referring to a trend in the short term.
Before the decline on May 5, it was possible to rise above the 39915.9-40500.3 section in order to turn to an uptrend in the short term.
However, due to the decline on the 5th of May, there is a lower section to turn upside down, so you can maintain the price by rising above 38200.0.
From a mid- to long-term point of view, it needs to rise near 42K to turn into an uptrend.
(1h chart)
** A short-term response is recommended as sharp movements are likely to occur on the 1h chart.
It shows that the reverse arrangement of the indicator passing through section A is converted to the normal arrangement due to the decline on the 5th of May.
-100 indicator: 40640.1 -> 36382.4
Accordingly, if it rises above the 36230.0-36534.7 section, it is expected to rise above 37243.4.
Although the entire support section is the 35280.2-38200.0 section, it is considered that this support section is divided into the 35280.2-36230.0 section and the 37243.4-38200.0 section.
So, we need to see if we can find support and move up in the 35280.2-36230.0 section.
Although the High and Low indicators are showing an inverse arrangement, they are expected to switch to a normal arrangement in the not-too-distant future as they are short-term indicators.
------------------------------------------------------------ -----------------------------------------------------
** All indicators are lagging indicators.
Therefore, it is important to be aware that the indicator will move accordingly as price and volume move.
However, for convenience, we are talking in reverse for the interpretation of the indicator.
** The MRHAB-T indicator used in the chart is an indicator of our channel that has not been released yet.
** The OBV indicator was re-created by applying a formula to the DepthHouse Trading indicator, an indicator disclosed by oh92. (Thanks for this.)
** Support or resistance is based on the closing price of the 1D chart.
** All descriptions are for reference only and do not guarantee a profit or loss in investment.
(Short-term Stop Loss can be said to be a point where profit and loss can be preserved or additional entry can be made through split trading. It is a short-term investment perspective.)
---------------------------------
