The 10Y is Setting Up for a RunStocks, beware.
When this bad boy starts moving up, stocks look less attractive.
10yearnote

Did the bond market fail?Over the last few months the 10yr bond market has been developing a long term inverted head and shoulder pattern. This was suggesting a test of the 200dma may be coming up soon and yields would continue to come down. However, today we saw a massive bearish engulfing and a move that almost wiped out last week’s entire move higher. This aggressive move lower in the notes, also dropped back below the inverted head and shoulder pattern neckline after a rejection of the 50% retracement. This false upside breakout could leave bulls holding the bag. The risk (now) is that bonds continue to slide back to the 50dma and yields continue to rally. This could affect the USDJPY as that pair has been very sensitive to the move in 10yr yields.

10yr - keep an eye!10yr keep an eye
Got a H&S formation, keep an eye if we break down further there are key support areas IF this continues further. However, we are at key support and don't forget month end.
Have a great weekend 🎉
TJ

10 Year Note Yield / 10 Year NoteIt's been 234 Years since the 10-Year Bond Note deteriorated to this extent.
The United States Treasury's formation was a Year away - 1789.
9 States had ratified the US Constitution.
In order to pay for expenditures during the Revolution, Congress had only
two options: print more money or obtain loans to fund the budget deficit.
Congress became far more dependent on the printing of money, which led
to hyperinflation.
Congress lacked the authority to levy taxes - doing so would have risked
alienating an American public that had gone to war with the British over
the issue of taxation without representation for the Crown.
________________________________________________________________
The first 6 Months of 2022 have been a disaster for Bonds.
Unfortunately, it is simply just beginning.
At present, the "Disinflation Wave" is in the trade as the Media / Wall Street
ups the narrative and continues to bang the Commodity Rollover as evidence.
Typically (although we do not use History as a Guide as this is the largest
Bear Market in History, it is unprecedented as we have noted for months)
we see an 8 to 13 Month mismatch cycle for "Dis-Inflation".
Although Demand Destruction is being accelerated in Capital Stock losses,
people eat, drink, drive... consume material things required for their very
existence.
_________________________________________________________________
The most recent 4-week, 8-week, 13-week, 2year, 5-year, and 7-year auctions
were a significant failure at a time when the FED reportedly reduced their
balance sheet by $21B after a retracement for several weeks off the May 25th
outsized and front-run dump of $51B.
Meanwhile, Reverse Repurchase pools continue to swell to new all-time highs,
most recently $2.34T - earning 1.55% and safely out of perceived harm's way.
Depression concerns are clearly intensifying.
2 Year Bond Futures continue to Invert intra-day.
M1 / M2 / M3 continue to flee to the Big Lots Pool.
_________________________________________________________________
Negative GDP reinforces the Demand Destruction - Consumers will out how
Inflation peaks... Central Banks claim to want Positive Real Rates.
Consumers are rolling over, demand destruction is seeing far broader participation
as Savings / Investment / Incomes decline at the highest ROC's in decades.
This would require an outside Fed Fund Futures move, one that appears
improbable for the near term.
I'd like Ashley Trevort Twins - Seems improbable as well.
The difference is, that the odds favor my wish. The Bond Market will retrace in
select points on the Yield Curve, but ultimately the Negative real rate to
Inflation will find its Afterburner.
_________________________________________________________________
Entities are not going to step up, this is clear.
The ticking insolvency bomb fuse was lit in early 2021...
How long is that fuse?
Not long.
Equities remain the Capital stock to destroy, Housing / Alt Coins / Metals ... etal
are not long for this environment.
In order for Global Central Banks to meet their stated objectives... they'll need to
become far more aggressive.
Will they...

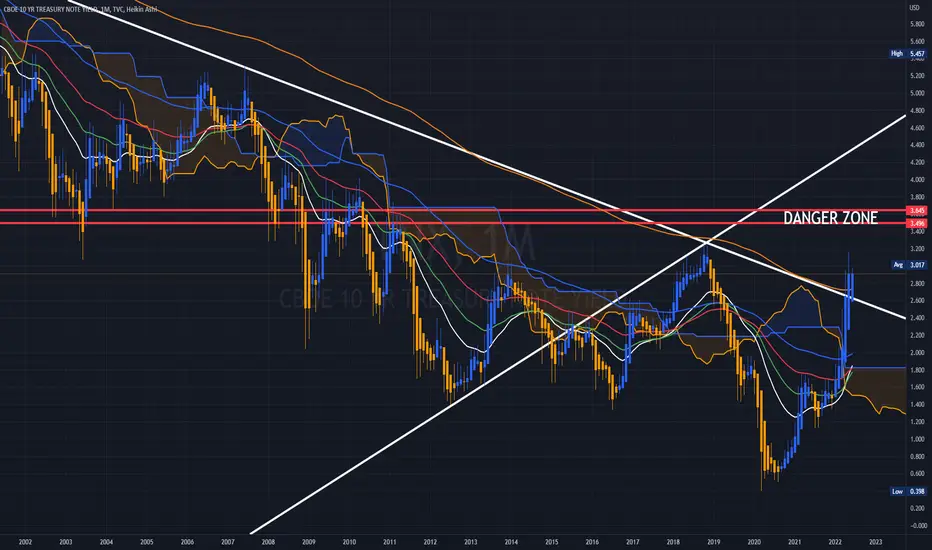
Mid Year Update: Part 1: 10 Year Rates:Mid-Year Update: Part 1: Bonds/Rates:
I begin each year looking at monthly perspective charts of Equity, Rates, Commodities and DXY. Those posts can be found in their entirety, with extensive fundamental support, in the links below. I will update views on the four markets over the next few weeks.
The early 2022 the conclusions were:
- Bonds: A bull market defined by a broad declining channel, but rising inflation could easily change the trend. The most likely catalyst to end keep rates below 3.25% would be a financial accident created by higher rates.
-Equities: SPX remains in a technical bull market and there are no overtly bearish behaviors evident in the longest perspectives. However short term weakness could easily morph into a bear market.
-Commodities: Goldman Sachs Commodities index is in the center of a broad 14 year range, bounded essentially by the low set during the financial crisis and the resultant 2011 high. The most notable/useful current chart feature is the clear uptrend from the 2020 pandemic low. Until that uptrend is broken, the most immediate trend is to higher price.
-US Dollar: The wide macro range, 70.70 - 121.02 has contained price action over most of my trading career but volatility is more cyclical than price. These periods of low vol. set up conditions that often lead to explosive moves.
Reminder: Bond bull and bear markets are defined by the PRICE trend. In other words, a bull market in bonds = rising bond prices and falling yields.
10 Year:
Monthly:
- In January bonds broke above the 40 year downtrend that had defined the bull market. The break of the downtrend moves the structural long term trend from bullish to neutral.
-A monthly close above the 3.25% pivot would begin to define a long term structural bear.
- Initial targets above the pivot are found at 5.29% (the 2007 pivot high) and 6.27%, (.382 retracement of the entire bull market).
-The monthly MACD oscillator generated a long term sell signal (in December of 2020 at roughly 90 bps). Until this sell signal resolves, place less weight on buy signals generated in lower perspective (daily and weekly) time frames.
Weekly: The combination of very strong resistance, overbought MACD and bad seasonals suggest that a counter trend weekly perspective rally or consolidation is becoming likely.
-Testing very strong resistance while overbought both in terms of price and momentum. It wouldn't be surprising to see a testing probe of 3.50% but its clear that buyers (expecting lower yields) are becoming more active.
-The Mid-June spike above 3.25% left a thrust rejection that suggested strong handed sellers entering.
-Weekly MACD is threatening to roll over.
-Bond prices have very strong seasonal tendencies, weak into the May - June time frame, stronger into the middle of September, and weak into the end of the year. We are into the period where bonds transition from weakness to strength.
-While it’s clear that the trend lower in inflation has inflected higher, potential weekly perspective inflection points in commodities and energy should relieve some of the short term inflation angst and by extrapolation the pressure on bond prices.
-Major yield highs are almost always the result of a financial accident with systemic ramifications. I don't think crypto is a big enough market to qualify and other than the widening high yield spreads I don't sense much going on in this regard.
-Ten Year TIPS breakeven rates are on the verge of generating a MACD month perspective sell signal (suggesting lower expectations for future inflation). This is a direct reflection of the recent declines in energy and commodities. A TIPS sell signal would be very supportive of lower nominal 10 year rates.
Bottom Line: The long term structural bull market is dead, but the market has yet to establish a new structural bear. Unless there is a systemic catalyst, Weekly perspective rallies, particularly into the fourth quarter, should be viewed as selling opportunities.

ZN - 10 Year Note FuturesNot good, not remotely good...
When we see the 10 - 30 break down...
It's bad.
3.65 ends this mess by simply taking all Assets far lower.
We can consolidate for a period of time, however small the duration.

Yields / Fed Funds / Rates / Inflation / 007s / TLT / ZN / ZBYou can't fix silly.
You can't fix stupid.
The Bond Market isn't going to fix anything, it assures ruin.
____________________________________________________
Buy the Dip hasn't quite worked out.
TLT will head to Sub 52.
You were warned long ago exactly what is happening would.
And explained in no uncertain terms exactly why.
DX back to 125?
Yeah... it's how you end up in ruin. Europe first.
TNX Yield times 2.81 - follow along or lose.

TNX - Monhtly Cross FIngers "Hope" for Pullback on FED balance sheet dumping of Junk MBS and USTs.
All we can "Hope" for...
Should their grand plan backfire...
We head right to 3.50 - 3.60 and it's game over for
the Indies for a long, long time.
4% to 6% would create the worst possible outcome.
It's coming, simply "hope" there's more time on the Clock...
TNX - Walking the Scarlet HarlotPoof, up - down - all around...
2.76 dipped in @ 2.702, good to see.
With the FEDs distro of USTs and MBS well
underway ahead of June 15... gobbling up
Yields aren't working out so well.
No.
Supply Limited thanks to the Fellen over @
the Treasury... is now a catalyst for increased chasing.
Jerry can offload the Junk to Banks desperate for Yields
as they are seeing Loan Activity dry up like the Mohave.
Going to be an interesting Liquidity Crisis unfolding again.

TNX - Running with the Early Rolloffs.With the Fed turning loose the QT poof-fest ahead of schedule, it's been a bad look to date.
Wednesday was to be the Fierst day according to the Fed, unfortunately, the runoff began
ahead of schedule.
Strike another match for the firestarters.
_______________________________________________________________________________
In 90 days the Rolloff will double, at minimum.

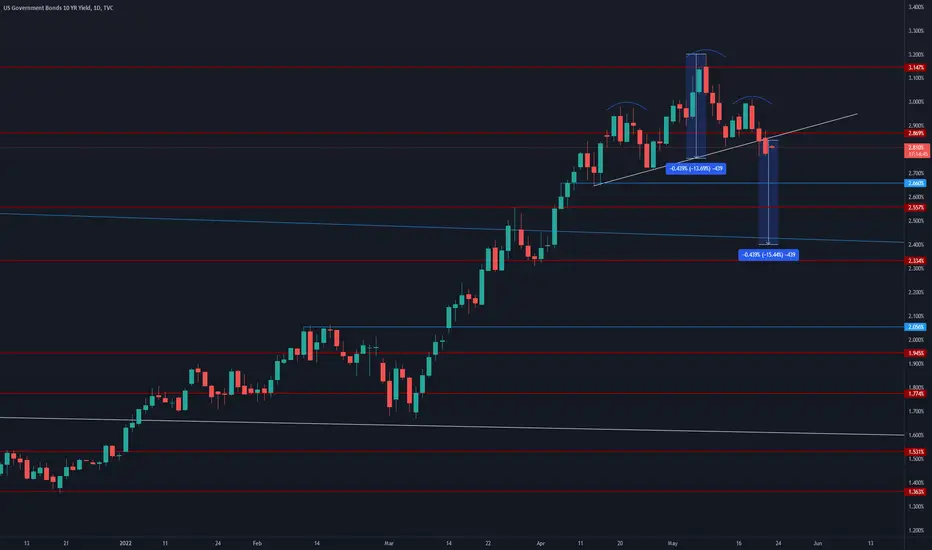
10 year yield broke below the H&S?It seems like the 10 year treasury yield formed a head and shoulders pattern.
It broke below the neck line on Friday May 20th 2022 which confirms the pattern.
Now we'll have to wait and see if it retests the confluence of resistance around the 2.869% area.
A dip in the 10 year yield may cause a rally in the tech sector and also in the general market.
The measured objective of this pattern would be around the 2.4% area over the coming weeks.
However, there are two levels of support in the way.
1) 2.66% which is a short term support level
2) 2.55% which is a historical level of support.
If we close below 2.55% we may be able to expect a further drop in the yields.
Bond Yields thru my 4 decades of tradingI know everyone is screaming about Interest Rates, but thought this would bring some renewed perspective.
Here is a chart of the 10 year Bond Yield dating back to the 1980s

TNX arrived! 10 years bond yield arrive at the top! Every moment that touch this trendline stocks decline and arrive at a bottom!

2 Things to Focus on TodayEquity traders will be focusing on 2 big things today. The action of Bitcoin, and the yield on the 10 year note. The 10 year is already spooking some, as the yield approaches 3 percent again. Bitcoin has to hold right here, or it could test the lows.

ZN - 10 Year Note 2 HourNews this coming week will impact Markets in a broad fashion.
ZN can see a larger RT to overhead POs as can ZB (30Yr) should
The FED engage in larger YCC interventions, and I believe they will
intervene heavily.
Macro Data Ahead:
MONDAY, MAY 16
8:30 am Empire state manufacturing index May
TUESDAY, MAY 17
8:30 am Retail sales April -- 0.8%
8:30 am Retail sales excluding vehicles April
9:15 am Industrial production index April
9:15 am Capacity utilization April
10 am NAHB home builders' index May
10 am Business inventories (revision) March
WEDNESDAY, MAY 18
8:30 am Building permits (SAAR) April
8:30 am Housing starts (SAAR) April
8:30 am Philadelphia Fed manufacturing index May
THURSDAY, MAY 19
8:30 am Initial jobless claims May 14
8:30 am Continuing jobless claims May 7
10 am Existing home sales (SAAR) April
FRIDAY, MAY 20
8:30 am Advance services report Q1

The #1 Chart to WatchLadies and Gentlemen, please take your seats.
(...the music stops)
Okay, thanks for playing. Good luck to all of you!
The investment strategies that have worked for the last 40 years will no longer work. The true bear market is here. This will absolutely 100% NOT be a recession that will be forgotten easily.
It most likely will be a depression via stagflation which we have never really experienced long-term.
Our leaders won't admit it but *News Flash* the Supply Chains are NOT getting fixed like they were before. China has no incentive or interest to fix them and we are the world's biggest debtor. We got 20% of all our imports from them in 2021. That doesn't sound like a lot but that 20% is involved in the supply chains of 70-80% of our goods. The Chinese gov has already warned its people of the incoming food shortage and have been far more honest with their people than our Western leaders have been.
Good luck in the New World Order!
Courtesy of the World Gov. Summit 2022, the IMF, World Bank, etc.
(Not Financial Advice, Just what I see.)

USDJPY Could Retest The Highs, While US Bonds Are DownHello traders!
Today we want to share an intraday update for USDJPY pair in which we see nice and clean bullish impulse in progress, ideally back to highs for wave 5 that can retest the highs and 125 - 126 area.
The main reason why USDJPY may stay up is still an unfinished five-wave decline on 10Y US Treasury Notes.
As you can see, there's a negative correlation, so if bonds are still pointing lower for wave (5), then USDJPY could easily stay up, while the price is above 123.05 invalidation level.
Trade well!
If you like what we do, then please like and share our idea.
Disclosure: Please be informed that information we provide is NOT a trading recommendation or investment advice. All of our work is for educational purposes only.

Are Bonds Being Dumped to Buy Bitcoin?BTCUSD / US Bonds are Inversely Correlated
Since March 7, 2022 the bond market has been in a freefall, spiking rates, as you can see with the 10 Year Treasury
Bitcoin has been on a rally that started on March 7 with a major spike then pullback the following day, only to take off like a freight train.
This a clear inverse correlation that has set in and does not look like it's abating at all.
Is this really happening? Bonds being sold to buy Bitcoin?
Thoughts? Please comment.
Stay tuned as this is very interesting!


A good time to buy 10 year t-noes in 30 min frameGOOD MORNING,
after the last short trading range, that seems like a semi diamond finally we are over the VWAP and we have a big strength of buyers right now although the candle is red they are here so the chance of an uptrend in the next 30 min nearly 75% due to big volume and the safety we have from the VWAP.
contact me if you want me for any analysis
check my profile to see my "correct" predictions in the last few days
GOOD LUCK
twitter:0uchaib

10 Year Rate: Price keeps moving up!Quick Analysis on 10 Year Treasury Yield on a 1D Linear Chart.
1) The US 10 Year Treasury Yield has been respecting a falling channel for multiple decades going back to the 1980s.
2) It has broken out of the top trendline of the falling channel with a recent re-test of the S/R line.
3) The measured move of the falling channel would bring it back to Pre-2008 ranges (LONG-TERM). The measured move is noted.
4) There was a Bull Flag Pattern forming on the charts within the falling channel pattern, which helped the price move higher. The measured move for the SHORT-TERM is noted.
5) I discussed this breakout in the first week of December 2021 when the price was still at around 1.40ish. PAY ATTENTION!
What are your opinions on this?
If you enjoy my ideas, feel free to like it and drop in a comment. I love reading your comments below.
Disclosure: This is just my opinion and not any type of financial advice. I enjoy charting and discussing technical analysis. Don't trade based on my advice. Do your own research! #cryptopickk

10 Year Note - Testing Weekly Upper Bound of Broadening WedgeAll eyes turn back to inflation and rates as the economy is creating jobs. Scouting the reopening trade for Q2.

10 Year Note - Broadening Wedge Bull BreakAn echo of the Monthly Broadening Wedge, the 4-hour broke bull on the surprise Jobs Report.
