VIRTUAL – Major Confluence ZoneEntry into 3D S/R and Demand Zone (Blue Box)
The current price action is testing a key 3D support/resistance level, which aligns with a historical demand zone.
Multiple diagonal supports converge here, making it a high-probability zone for a reaction.
Accumulation & Reversal Play
The setup suggests that this zone is ideal for building a position.
Expect potential wicks/spikes into the lower blue zone, hunting liquidity before a reversal.
If price holds above ~$1.40 (blue line), look for signs of strength (bullish candles, reclaim of lost support).
Upside Targets
If the zone holds, the first target is the prior local highs ($2.00–2.05).
Further targets are the overhead supply zones (highlighted in red), especially if the momentum persists.
Invalidation
A daily close below $1.40 or sustained trading below the lower blue box invalidates the setup and signals a risk-off environment.
12h

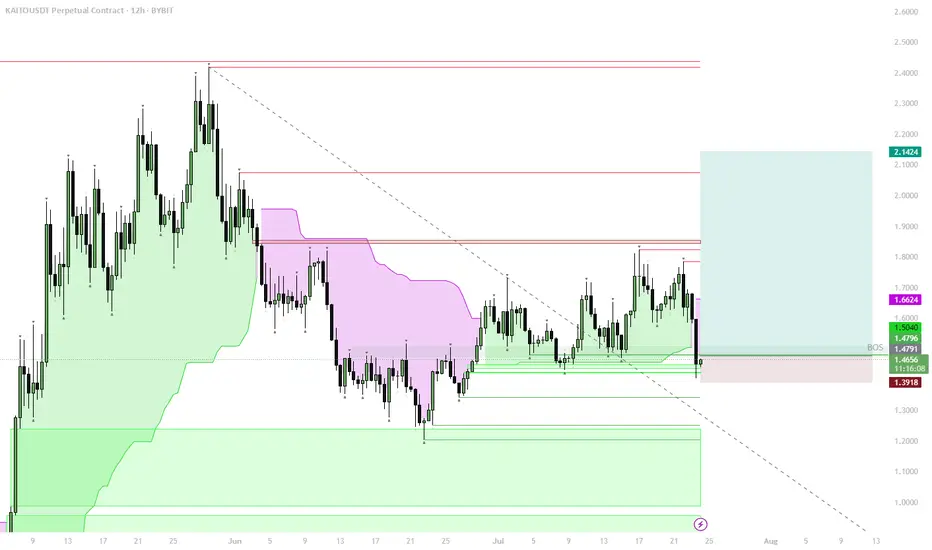
KAITO – Structural Flip, Bullish Accumulation ZoneStructural Shift:
Price reclaimed the key 1D S/R + BOS (Break of Structure) level, signaling a major trend change from bearish to bullish.
Trend Confirmation:
The move above $1.48–$1.50 zone confirms a bullish market structure. This level is now strong support.
Accumulation Opportunity:
The area between $1.65–$1.50 is ideal for spot accumulation, as it aligns with the reclaimed BOS and the lower edge of the bullish structure.
Upside Targets:
If the bullish structure holds, price could target $1.66 (local resistance), with the next targets at $1.85, $2.14, and potentially higher if momentum continues.
Invalidation:
A break and close below $1.48 would invalidate this bullish scenario and signal a return to the previous range.
The reclaim of the BOS level, with a shift above 1D S/R, marks a clear bullish structural flip on the chart. Historically, such shifts create strong accumulation zones just above the reclaimed level, where risk/reward is best for spot buys. Buying into the $1.65–$1.50 range aligns with both trend-following and classic Smart Money concepts: enter after the structural confirmation, not before. Invalidation is clear below $1.48, where structure would flip bearish again.
SOL Breakout — Eyeing $180 NextCRYPTOCAP:SOL | Breakout above channel — main target $180 next.
Watch $140–145 for retest/bounce. If failed, $112 is major support.
Trend: Bullish | Next stop: $180

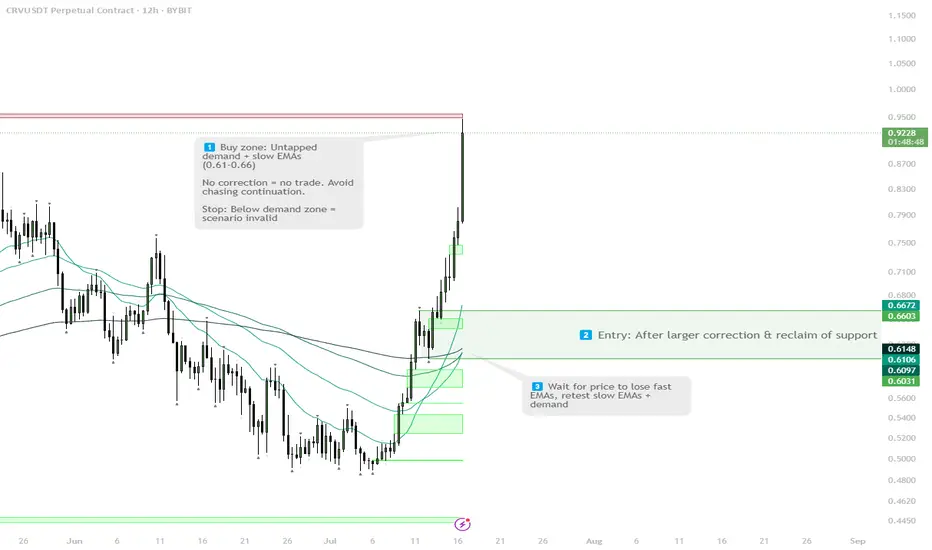
CRV — Wait for Correction to Demand + Slow EMAs1. Wait for correction: lose fast EMAs, test slow EMAs + demand (0.61–0.66)
2. Enter after reclaim/confirmation
Stop below demand zone
No correction = no trade
VIRTUAL — Clean MSS+BOS Flip Long | #1D | BULLISH1. Limit order on retest S/R flip (1.65–1.68)
2. Entry after confirmed hold above support
3. Main target: 2.18
4. Stop: Below 1.49

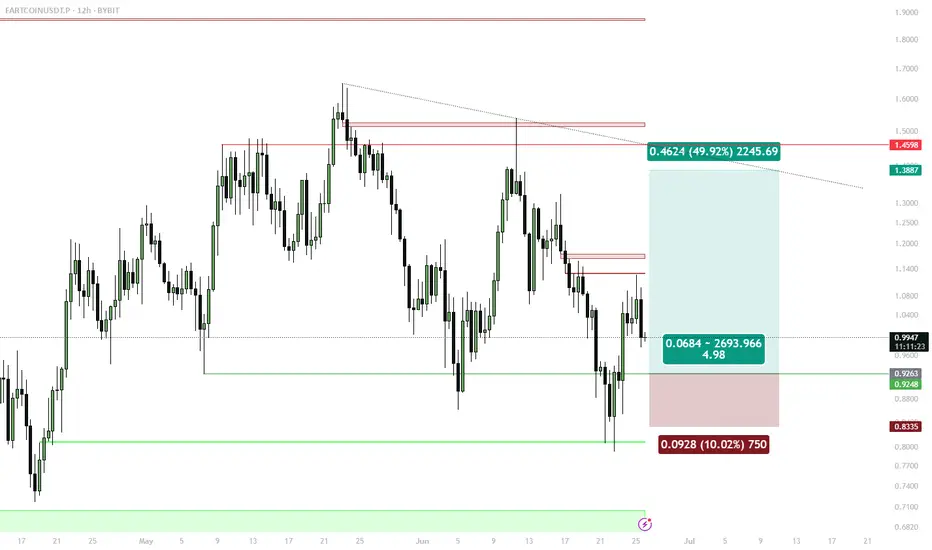
FARTCOIN Swing Long — Reclaimed Support, Bids at Bullish OBSwing Long Setup:
Entries: Limit orders in $0.91–$0.93 (12h OB zone, 1D support)
Stops: 4h close below $0.86–$0.87 (support invalidation)
Targets: $1.16 (first TP), $1.43 (secondary target)
🔔 Triggers & Confirmations:
Only stay in trade if 1D/12h support holds on 4h closes
Re-enter on reclaim if stopped out and structure recovers
🚨 Risk Warning:
Breakdown of reclaimed S/R flips setup invalid — exit on signal
ZK — Trendline Break & FVG RetestHTF sweep + FVG retest + trendline break — clean R/R setup. Enter after confirmation, main target $0.0806, stop below $0.043.
1. Buy zone: $0.043–0.049 (FVG + trendline retest)
2. Enter after clean reclaim above trendline
3. Main target: $0.0806
4. Stop: below $0.043
If fails to reclaim — stay flat

ETH | H12 Supply Rejection & Demand Bounce PlanSELL ZONE $2,520–2,560
→ Short from supply, rejection expected
Triple tap + SFP = short trigger
↓
EQ LOWS $2,380–2,400
→ TP1 / watch for bounce
↓
BUY ZONE $2,280–2,320
→ Main long zone, enter on confirmation (bullish candle/SFP)
STOP below $2,250 = cancel idea
↑
TP1 $2,500
TP2 $2,900–3,000 (if strong bounce)
Main scenario — short from supply zone, target demand at $2,280–2,320. Long only if bounce is strong. Stop below $2,250. No confirmation — no trade.

CHILLGUY Breaking Out — Rotating Gains Into Next Meme Runner🎯 Trading Plan:
Watch for a sweep into the red box and LTF reclaim for spot entry
Targets: $0.117 (yearly high), then $0.129–$0.158 if strong momentum
Manual invalidation: 1D close below red box
🚨 Risk Warning:
No spot entry unless sweep/reclaim at supply zone
Exit if 1D candle closes below supply zone

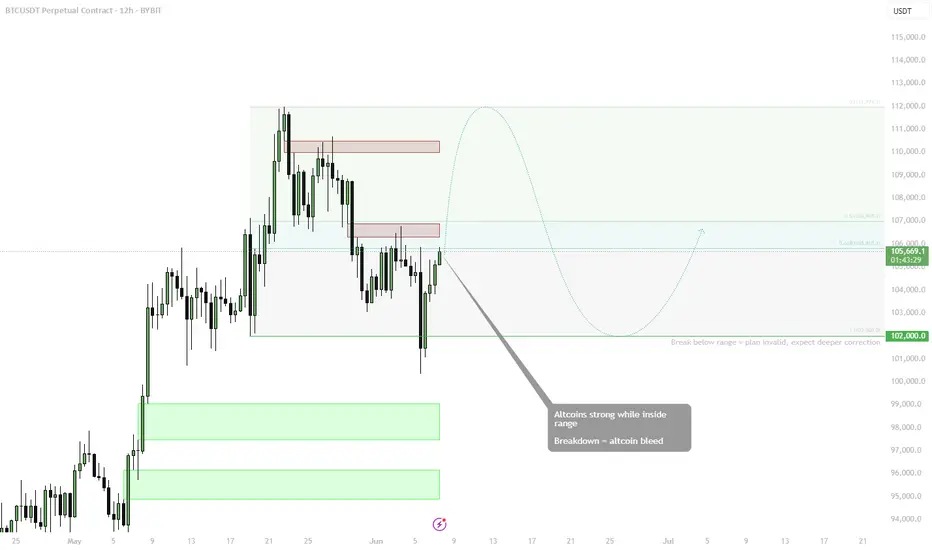
BTC — Altcoin Sentiment Hinges on BTC Holding BINANCE:BTCUSDT is consolidating within a well-defined range between ~$102K and ~$112K, with a bounce off the lower boundary now challenging midrange resistance. As long as BTC trades within the range, altcoins are expected to remain strong.
🟩 Midrange: $106K
• 0.618 fib and prior supply zone
• Key inflection for either a move higher or return to range low
🔻 Range Low Support: $102K
• Break below this = plan invalid
• Expect deeper BTC correction and altcoin bleed in that scenario
📈 Bias:
• Altcoins strong = only valid if BTC holds this structure
• Rotations likely while BTC moves sideways or grinds higher
• Upside target (range high): ~$111.9K
📌 BTC stability = altcoin opportunity. Breakdown from range? Get defensive fast.
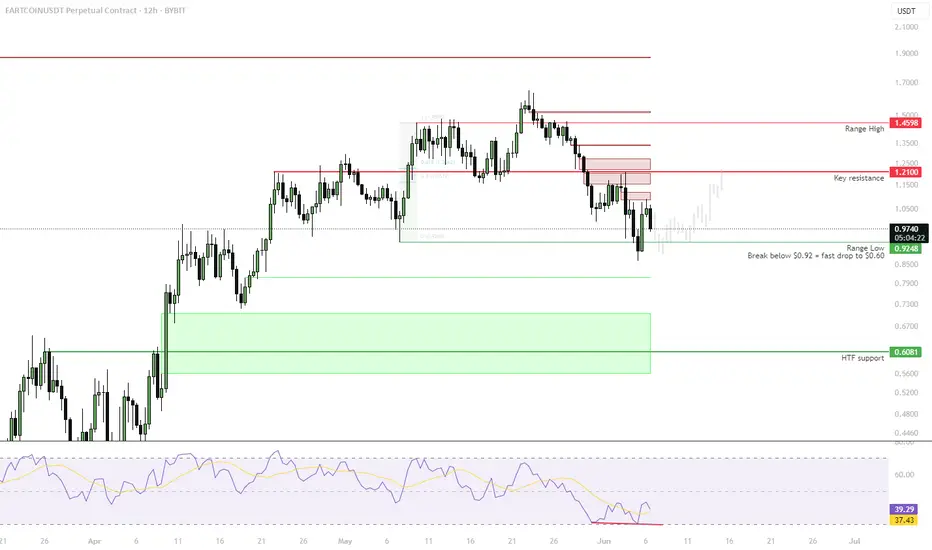
FARTCOIN | Bounce from Range Low, But Risks RemainPrice has bounced from the range low near $0.92, with early RSI divergence suggesting potential short-term relief. However, the structure remains fragile unless price reclaims key resistance.
🟩 Support:
• $0.92 = Range Low
• Break below = fast drop to $0.60
🔴 Resistance to Watch:
• $1.21 = Key rejection zone
• Above $1.21 opens up space toward the range high at $1.45–1.50
📉 Risk Scenario:
• Bearish continuation if $0.92 fails
• Targets: $0.73–0.60 (HTF demand)
📈 Bullish Case:
• Strong reclaim of $1.21
• RSI recovery confirms bottoming — reopens path to range top
📌 Range low bounce is intact — but strength only confirmed above resistance. Mid-range = caution zone.
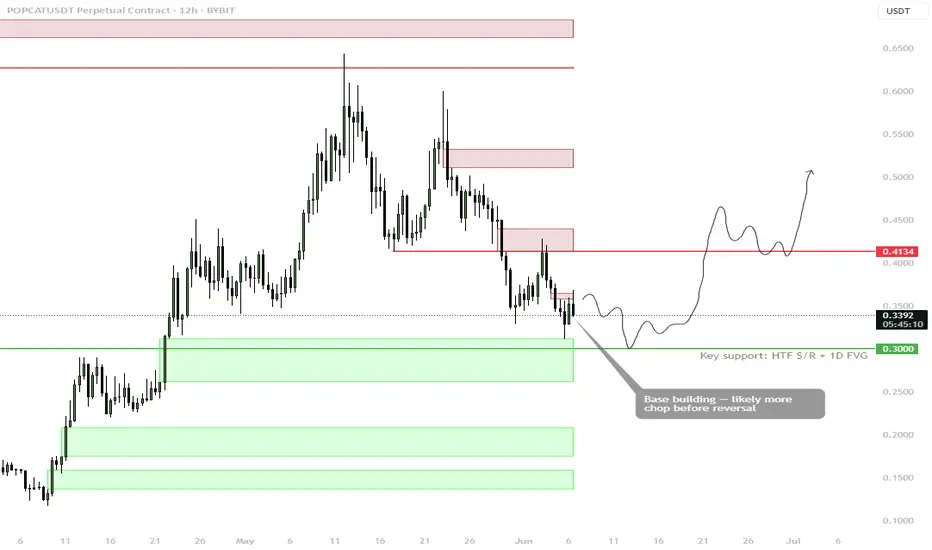
POPCAT — Base Building Near HTF SupportBYBIT:POPCATUSDT is showing early signs of a bottoming process near a key HTF S/R level + 1D FVG zone around $0.30. Price is consolidating just above support, suggesting a base is forming, but more chop is expected before a clean reversal.
🟩 Key Support: $0.30
• Confluence of 1D Fair Value Gap + prior S/R
• Ideal zone to monitor for a long trigger
• No aggressive entries yet — wait for structure
🔁 Likely Scenario:
• Sweep / wick into $0.30
• Higher low forms → reclaim of $0.41 confirms reversal
• First resistance: $0.45–$0.55
• Larger expansion possible on breakout above $0.60
🟥 Invalidation:
• Full breakdown below $0.30 = reevaluate, next support lower at $0.23–0.20
📌 Let the bottom form. The cleaner the base, the stronger the breakout.
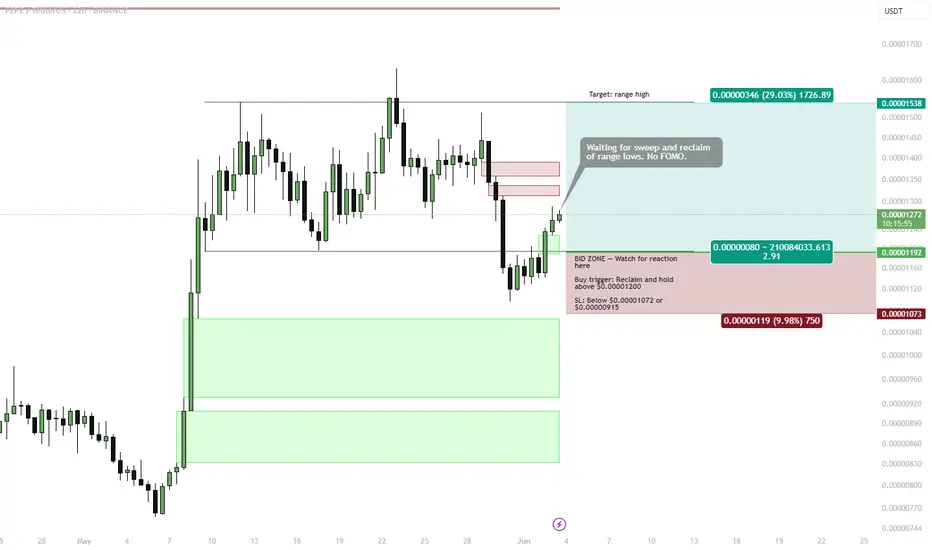
PEPE | range play — Reclaim Setup Targeting Range HighPrice has swept the range lows and is now attempting a reclaim of the lower boundary around 0.00001200. This creates a potential long setup targeting the range high if structure holds.
Setup:
🟩 Buy Trigger: Reclaim and hold above 0.00001200
• Entry confirmed after bullish reclaim
• SL: Below 0.00001072 or conservative below 0.00000915
📌 BID ZONE: 0.00001120–0.00001190
• Watch for reaction here — ideal place to enter during a retest
🎯 Target:
• Range High: 0.00001538 (~+29%)
Risk-Reward:
• R:R ≈ 2.9
• Setup remains invalid if price drops below bid zone or fails to hold the reclaim
Note:
⛔ No FOMO. Wait for confirmation — reclaim first, entry second.
ENS bullish flag setup — Flag Consolidation AboveBINANCE:ENSUSDT is consolidating within a bullish flag pattern, holding above key structural support. Price is respecting multiple confluences including the OB cluster, 4H 200MA, and 1D S/R flip, keeping the long bias intact.
Buy Zone:
🟩 $19.75–20.80
• Best area to bid inside flag structure
• OB cluster + MA confluence = high probability support
• Structure remains bullish above $20.35
📌 Breakout Target: $30.13
• Break of flag resistance = momentum trigger
• Expect chop and fakeouts before breakout — patience required
🚫 Invalidation:
• Clean break below $19.75 = exit or reassess
Summary:
Strong trending structure with healthy consolidation. Best strategy: buy the dip into support and wait for a flag breakout toward $30.

SasanSeifi 💁♂️LTC 👉12H🔻 77$ / 70$ Hey there! As you can see from the 12-hour timeframe, there's a corrective trend going on right now, with the current trading price around $81. I'm kinda expecting the price to adjust down to the $77 liquidity zones. To get a clearer picture, it'll be interesting to see if that support range holds up, right? If it gets a good confirmation around that price, we might see some positive fluctuations. On the flip side, if it doesn't hold up, we could be looking at further corrections possibly down to the $70 range. Let's keep an eye on it!
Just keep these scenarios in mind as you analyze the market. Remember, things can always change unexpectedly, so stay flexible in your trading approach.❗
Wishing you loads of success in your trading adventures, my friend!✌
❎ (DYOR)...⚠️⚜️
Sure, if you have any more questions or need further clarification, feel free to ask. I'm here to help!
And if you found my analysis helpful, I would appreciate it if you could show your support by liking and commenting. Thank you!🙌

SasanSeifi 💁♂️🔵AMZN 👉12H 118 / 121 / 123▪️ Hello everyone ✌ By examining the chart in the time frame of 12 hours, as you can see, the price has grown by about 12% after breaking the dynamic resistance and due to the completion of pullback from the range of 101, and after a slight fluctuation, it again faced a positive fluctuation. Currently, it is trading in the range of 114 midline of the ascending channel.📊
📈The scenario we can consider is that if the support range of $110 and $108 is maintained, the price will continue to grow up to the range of $118 and the gap area of 121/123.
❗️
🔸We have to see how the price will react to the resistance ranges. If it stabilizes above the range of 123, the possibility of more growth can be considered.‼️⚠️
⚠️Keep in mind that it is important to maintain the 110/108 support range for the continuation of the positive trend.
▫️The current price : 114.07💲
▫️TF : 12-H
❎ (DYOR)...⚠⚜
What do you think about this analysis? I will be glad to know your idea 🙂✌
IF you like my analysis please LIKE and comment 🙏✌

SasanSeifi 💁♂️AMD👉12H 118 / 126 ? LETS SEE!▪️ Hello everyone ✌ By examining the chart in the time frame of 12 hours,as you can see, due to the break of the dynamic resistance, the price faced buying pressure after a slight fluctuation from the $95 range and managed to grow to the $102 range. It is currently trading in the 102 range.📊
📈The scenario that we can consider, in case of breaking the important resistance range and stabilizing above the $108 range, after the fluctuation, the price will grow again to the desired targets of the 118/126 range.
❗️
🔸We have to see how how the price will react to the important resistance range of $108.⚠️ Otherwise, it may be rejected from the range of $108.‼️
⚠️Keep in mind that maintaining the range of $95 is important to continue the positive trend.
▫️The current price : 102.38💲
▫️TF : 12-H
❎ (DYOR)...⚠⚜
What do you think about this analysis? I will be glad to know your idea 🙂✌
IF you like my analysis please LIKE and comment 🙏✌

AXS/PERP 12H TA decending channelAXS/PERP has been in this decending channelfor a while. we just arrived at a important accumulation zone.
a good moment to buy some AXS here imo.

BTC - 4H BuyIf we close above the last 4H candles high I will enter buys towards $67K- $68K.
The 12H is incredibly bullish though the last one closed with no wick, if this 4H & 12H closes as above then that's another confirmation for short term buys.
I will hedge a short at $67,500 to go with the HTF bias of a reversal.

SXPUSDTSXP / USDT 12H
Three possibilities for "SXP" include:
1- Climbing and breaking the price ceiling 3.8
2- Suffering between the price of 2.8 to 3.8
3- Falling and breaking the support zone and taking action to reach below 2.4
The first two possibilities have a better chance
For the following reasons:
1- Support zone consisting of Ichimoku cloud, moving average, Fibonacci
2. Forming a cup and handle pattern
3- Pressure not to break the uptrend line
That passing through these is a surprising event.
what is your opinion?

BNBUSDTBinance Coin/ USDT 12 H
Due to the upward trend in recent weeks, which was in the form of Sharp, we expected a break after the ascent. But does "BNB" satisfy this cross-sectional drop this week or does it intend to make further corrections?
If you look at the chart, you can see that it forms a trend in BNB a third and is now approaching the hot zone of the triangle.
The triangle always offers two possibilities for future trends.
1- Collapse, which of course works with supports in the range of 250 consisting of: the lower side of the triangle, Fibo 0.38 and the moving average of 50 and below that range of 230 Ichimoku clouds to some extent prevent the collapse.
2- It is a little easier for the uptrend and it seems more likely to happen.
Of course, all these trends have been examined if Bitcoin is stable, and it is possible to surprise everyone.

BTC 12H - 14 Dec 20In two minds about BTC as we have just bounced off a 61.8 retracement on the 11th Dec, which can be found by drawing a fibonacci from 26 Nov @ 12:00 - 1 Dec @ 00:00
We are now rejecting / holding the retracement zone, this can be found by drawing a bearish fibonacci from 1 Dec @ 00:00 - 11 Dec @ 00:00.
I would hope to see this sell off up until the EOY until January when things heat up with regulations and digital $.
I would not be surprised if $22,200 comes through wiping out everyone shorting from here (prev ATH) hence the idea to not risk this set up.
Lets see what happens on 21st Dec (week today) in the crypto market 🤞 📉

NZDUSD Short 12HEntry: 0.6876
SL: 0.6923 (47 pips)
TP: 0.6782 (94 pips)
RR = 2
Ealy Exit: 0.6829 (RR=1)
