LTCUSDT 15min TargetLtc is near a sharp price fall to around $230 ( mid term ) in short term target is around $250, overally ltc is bearish for couple days so be carefull
this is not a signal always take care in financial markets
if you have any question just ask it
15min

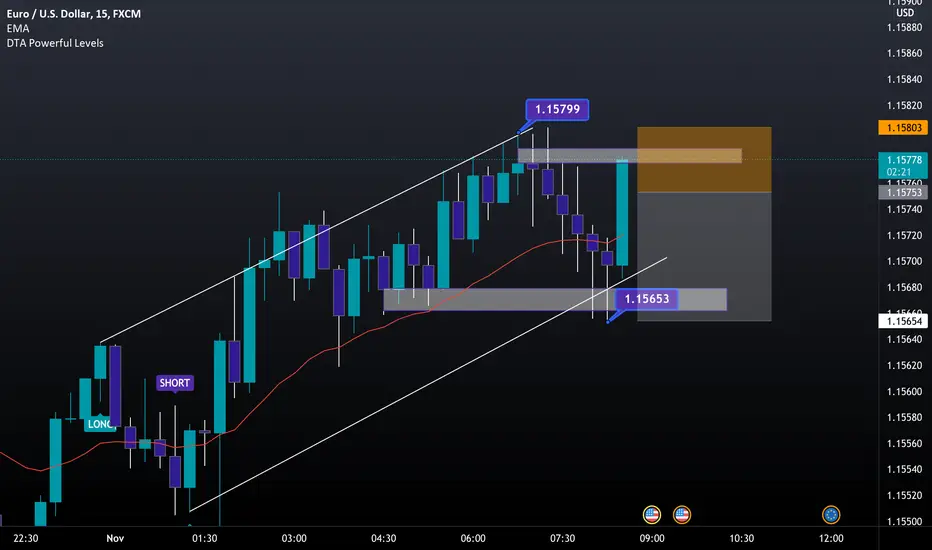
EURUSD 15M. Price heading to 1.6200...and beyond?the 15 minute timeframe is my favourite timeframe for EURUSD Clean with order blocks getting mitigated lovely.
The 4 hour has lost its clean order flow at the moment with a few key areas to be tested before I can confirm bias on there. But the 15 minute has broken bearish structure for me and I will be looking to for Long opportunities if they present them selves

Price Action BTCUSDT Perp 15-min TFThis is current BTCUSDT Perp chart on 15-min time frame. It shows that BTC is currently on strong support.

usoilhave three scenario
1. breackout trend line and go up to target
2.breakout and retest trandline with static support
3. It is very unlikely to break support because sales pressure is observed , After that, we will see the possibility of an upward trend

usoilcreate blulish flag pattern
it has two scenarios
first. direct breckout flag and as fat as the take profit goes
second . breackout rise and gone pullback and hits takeprofit

EURUSD 15 min chart EURUSD broke 4 hour structure to the down side to align with the daily expectational order flow. I believe the 4 hour bullish structure was part of a daily pull back but it seems now that is over.
I trade with structure and now structure is telling me that we are bearish on the daily, 4 hour, 1 hour and 15 min.
ideally I would like a pull back to around to price range of 1.6200 -1.6500 as that would bring us into the premium range of the new 4 hour leg. along with some nice 15 minute order blocks I would definitely be looking for sells if price gave me the reaction that meets my trading plan.

EURUSD 4hJust a snapshot of my HTF markup to follow on from my morning outlook posted earlier, i mainly keep my focus on 15m during session but always aware of the bigger picture.

Gbpusd one more move downGBPUSD Pound makes a 1hr flat which is a continual pattern so we may see a more move down before considering any upside until then plan your trades and trade your plan.
If your Like my Ideas Pls Give it a like. Thanks

15 min Strong Bullish Engulfing candleStrong engulfing Bullish candle, based on price action it could move to 1769.
SL at 1755
TP at 1768
Entered on 1760.13
R 1:1.6

BTC Low Time Frame Long SetupBTC low time frame buy setup, triple bottom reached correctively with descending channels, now we have bullish impulse and we are forming flag continuation correction , if broken upside the next bullish impulse is probable.
for more confirmations its better to wait the flag breakout.

░▒₿▒░ 💀-15MIN | iii ░▒₿▒░COINBASE:BTCUSD
Second attempt. I have identified (in addition to the current fib. channels), a downward channel and resistance.


NZDUSD 15MINnzdusd 15mins deep crab
nzdusd 15mins deep crab
nzdusd 15mins deep crab
nzdusd 15mins deep crab
nzdusd 15mins deep crab


Scalping BITCOIN on the 15minutesIn this video, I am going to backtest my indicators' signals by scalping Bitcoin.
My indicators work best on higher timeframes and they have quite high win rate more than 85%. However this time, I am going to do something different by applying my indicator on Bitcoin the 15 minutes chart. I will go back couple of back in time and start replay mode. So let's get to it!!

░▒₿▒░ 💀-15MIN | ii ░▒₿▒░COINBASE:BTCUSD
There is one thing that is certain. . . The price will go up....And the price will go down.

Hindustan petrol 31 august 2021hindustan petrol
1. inverted head and shoulder pattern (blue line )
2. at higher time frame its a retest to a higher time frame (white trend line )
3 retesting shoulder line of inverted head and shoulder pattern (green in colour)
thanks


WIPRO as on 24.08.2021A FALLING WEDGE PATTERN BEING FORMED IN 15 MIN CHART!!
A PARLLEL PATTERN BEING FORMED IN 1 DAY CHART!!
A good call for intraday if candle breaks up then will retest and move to its resistance level that is off 644!!
And if candle retest then can come up to its support level which was generated with gap up opening that is off 630!!
Their will be the risky trade zone in between the pattern because of support!!
Wait for breakout in any direction for good call and do check volume and retesting value!!
(THE ABOVE ANALYSIS IS ONLY FOR STUDY PURPOSE DO NOT TAKE IT AS ANY BUY OR SELL CALL!!)


