15min

EUR/USD - 15min Scalper & Week Ahead Price action finished last week in the tip of a nice minor wedge. Moving into this week I will be placing intermediate support zones formed around 1.17288 and intermediate resistance levels around 1.1839. Monday should either break up out of current wedge to upside to retest last weeks highs or break down to test intermediate support and follow thru with the break to 1.1675 at lower levels previously formed. With the major news this week on both sides I will be tracking and scalping the minor waves with a close eye on the calendar and active intermediate momentum. Expecting choppy indecisive price action throughout the week as we consolidate into the major patterns on the larger timeframes. I will be waiting for minor patterns and price action waves to signal and confirm entries and exits of my scalps. I use this platform to create a record which I can review to continue evolving and adapting my charting systems. This is not trade advice or signals . So trade with care, peace and pips. Hope it helps and crush the markets this week traders!
- Grateful Chart Artist


USD/JPY - 15min Scalper & Week Ahead The 15min scalper looking like the embedded short term wedge is coming to a point. Monday should give a nice couple scalps and I will be tracking the minor waves looking for entries throughout the day. I am not expecting any wild movement until the major news later in the week which should give a some major volatility for scalpers. Currently price action is wedging, ranging and consolidating on multiple timeframes so scalps this week should be fun and consistent in both directions. I am a manual active session scalper so I will be sharing the entries as I take them but looking forward I have a bearish bias. As a scalper I try and not focus too much energy on the larger waves momentum but keeping an eye on the major trend is important. I use this platform to create a record which I can review to continue evolving and adapting my charting systems. This is not trade advice or signals .So trade with care, peace and pips. Hope it helps and crush the markets this week traders!
- Grateful Chart Artist

GBPCHF-Entry Long for retracement on the dailyPrice just got above the 200 ema on the 15min chart which is my go when looking for a reversal into a retracement. This may set up Sunday night.
Keeping an eye out. See my previous daily chart.

9) NZDUSD bullish bat on 15min chartFollow me and check the related ideas below to learn more details.

BTCUSD - Forecast For 30th MayHi guys, everyday I will post a forecast analysis on BTCUSD. It could be useful for daytraders in order to identify potential movements expected during the day according to technical analysis UT15min.
My analysis is mainly based on trendlines , supports, resistances and most common chartist patterns.
No need too much explanations, the chart speaks by itself. If you have any questions feel free to ask by leaving a comment.
Economic news of the day:
ADP Nonfarm Employment Change (May) (USA)
GDP (QoQ) (Q1) (USA)
If you find it useful do not hesitate to hit the Like/Follow button and eventually leave a comment.
Happy trading!
2) GBPUSD bearish bat on 15min chartI will be updating GBPUSD ideas. Follow me and check the related ideas below to learn more details.

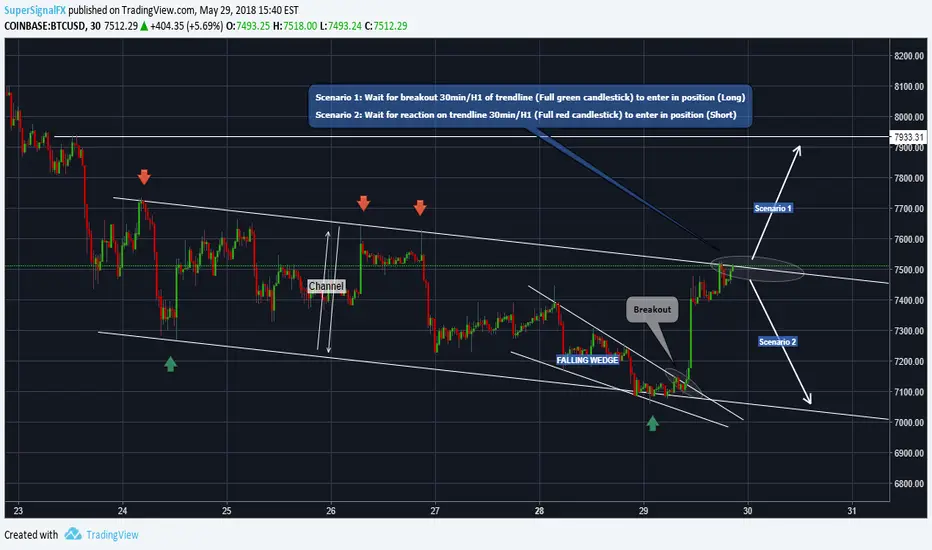
BTCUSD - Forecast For May 29thHi guys, everyday I will post a forecast analysis on BTCUSD. It could be useful for daytraders in order to identify potential movements expected during the day according to technical analysis .
My analysis is mainly based on trendlines , supports, resistances and most common chartist patterns.
No need too much explanations, the chart speaks by itself. If you have any questions feel free to ask by leaving a comment.
Economic news of the day: Consumer confidence (USA)
If you find it useful do not hesitate to hit the Like/Follow button and eventually leave a comment.
Happy trading!


3) NZDUSD bearish bat on 15m chartI will be updating new ideas on NZDUSD. Follow me and check the related ideas below.


4) EURUSD bearish gartley on 15min chartI will be updating new ideas on EURUSD. Follow me and check the related ideas below to learn more details.

Little Cypher on AUD/CHF 15min Chart. AUD/CHF
Little Cypher on AUD/CHF 15min Chart. Possible more than 20 pips. Not bad for a small trade.

ZIL: 15 minute Chart- Scalp from earlier today.Check out my scalp trade from earlier. Locked a profit at 3% and unfortunately auto sold off a quick wick. It ended up climbing nicely to the predicted target. Had it played out exactly as planned, this could have been almost 9%! Still happy with the profit though.
Check out the nice divergence, noted FIBS, etc and see why I entered this scalp.
ROOKIE trader; Follow at your own risk!
-Solid horizontal orange line: I bought at that price
-Dotted horizontal orange line: mock buy, not in the trade yet
-Solid horizontal pink line: Stop loss/sell implemented
-Dotted horizontal pink lines: Targets

Scalp to the bottom of the channelThe bias is long but short term pullbacks can happen so this idea is risky cause obviously the main trend is bullish but regardless there still might be a quick stab to the downside.
This is just an idea, not advice!! Good luck to everyone who are trading the tough markets.

LTC/USD Bearish H&S formation on 15 Minute BITSTAMPSeveral indicators still yield bearish signals on shorter time frame 15 minute chart(s).
(1) Possible H&S formation - my analysis (though this could soon be ruled out if price continues downtrend) is another pop to the 170 level, before retracing back down to the right shoulder neckline to a complete a bearish H&S formation.
(2) Money flow remains in bearish territory, below -12.5 suggesting money remains on the selling half of market depth.
(3) GMMA (on OBV) consolidates suggesting price agreement in the direction price action leads, with recent short as well long term traders without a clear sentiment of market direction

LOOM: Quick scalp trade from earlier today- 15 minute chartHello hello! I've been playing around with my own version of scalping for the last couple days and pulled some decent profits. This is highly NOT recommended unless you have your risk management and emotion in check. As yo ucan see, I go crazy with the FIBS. I pull the main ones off the daily and 4 hour charts, and also do them for the 15 minute and even 5 minute chart movements. Yo ucan find patterns like consistent retracements to the .618 FIB or constent rebounds of up to the .382 FIB if you reverse it (examples only.)
I always look for RSI in the dumps and small divergence as a main indicator. Also, as noted on this chart, I also look for strong support for RSI in the mid range of the chart, so you don't have to rely on RSI dropping way below 30 all the time. In this case I bought when the bears tried to push below the FIB and it was rejected into a hammer-ish reversal candle. I sold at the resistance I had already mapped out from all the FIB pulls from earlier. This was a bigger order, about 5% gain in a short time with a 1% stop loss.
Let me know your thoughts. Luck or logic? ;)
ROOKIE trader; Follow at your own risk!
-Solid horizontal orange line: I bought at that price
-Dotted horizontal orange line: mock buy, not in the trade yet
-Solid horizontal pink line: Stop loss/sell implemented
-Dotted horizontal pink lines: Targets


More In-Depth SPY Analysis SPY 15 Min Prediction. Creating the picture and we will see if SPY can fill in the blanks


Run up before more heavy crashes following cup and handlesorry for the lame post just thought id throw some insight before bed , this is my first post. ETHUSD just had a pretty perfect cup and handle pattern , a buy signal ,a good time to exit any shorts and capture max profit if you have not already , and wait for the next good move( good entry) now note that eth is HEAVILY bearish right now and you shouldnt really be risking going long, instead find and wait for confirmation of peaks before breaking down more and SHORT , only buy to cover dont ride both ways eth is going to scarily and rapidly continue its downfall. (in my opinion ..... besides xD the chart looks like a massive pump and dump) .... Hope my comments helped atleast someone. Goodnight Traders!

BTC trading ranges on a 15 min timescaleIn previous charts I've shown 4 hour timescale support/resistance and Fibonnaci retracement levels. These provide me the "big picture" trends and levels.
In uncertain times, I'm less likely to hold a position even overnight. I trade at significantly shorter timescales, scalps if you will.
So, with the 4 hour trends and fib retracements still in place, let's apply more granular indicators.
Focusing in on the lower 4 hour fib range of 0.236 to 0 ($9182 to $5873), which we are currently in, provides our focus. Within that range, I took a recent significant low and high and drew another set of Fibonnaci retracements. I choose not to draw sub-fibs based on the entire 4 hour fib range, but use a swing within the range. I did this due to the presence of the 4 hour support line adding influence to keep within the top end of the range and outer fib retracements are not the best for this technique, but anyway.
OK, so now we have some 15 min retracement levels. I use these as more of a guide and less absolute than my 4 hr retracements. Smaller time scales tend to have more noise and overshoots. You'll see retracements levels hit and also quite a few mid-level hits as well. But, still, knowing that, quite useful information.
You may also be surprised to see when zooming down to 5 min it's still somewhat relevant.
Note: When I publish these charts, I hide/remove some other indicators I have normally displayed so you can see more detail on the levels. I normally have at least Volume, MACD and RSI also display to help confirm any trends.
