BTC — Harmonic Parabolic Scenario 1. Rise to 110–111k by July 4–5
2. Drop into July 9–10
3. Parabolic move after July 10
4. TP: ATH+
5. Stop: scenario invalid if no breakout
1d

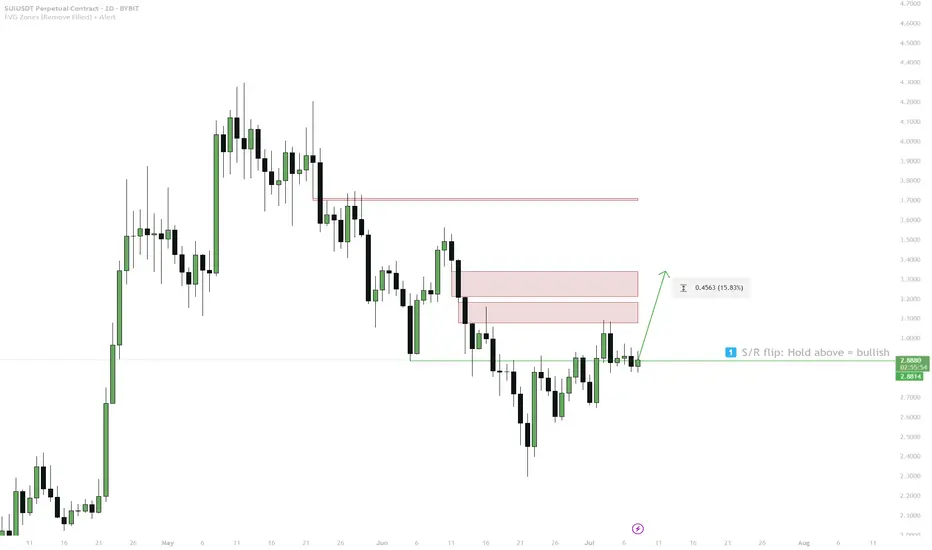
SUI — 1D S/R Flip & FVG Target1. Hold above 1D S/R + BOS (blue box) = bullish bias
2. Entry: Only long above blue box
3. Target: 3.32 (FVG)
4. Stop: Below blue box = invalid
FARTCOIN — Choppy Zone, Support Buy Setup1. Choppy price action likely until sale is done
2. Buy on retest and bounce from 1D support ($0.90)
3. Only long above support, stop below $0.90

HYPE — Targeting Liquidity Below Monday Low1. While below Monday low — bearish, target liquidity
2. TP1: 35.34
3. TP2: 30.60
4. Above Monday low = scenario invalid

SOL — Liquidity Sweep & Demand Play1. Wait for price to sweep into demand
2. Enter long on SFP or strong bounce
3. Target: 240+
4. Stop: below demand zone
If no sweep, stay flat or wait for clear reclaim

SPX6900 — Dream Scenario1. Wait for price to sweep EQ lows (buy zone)
2. Enter long only after SFP / bullish confirmation
3. Target: 2.13+
4. Stop: below buy zone
If no sweep — no trade!

SUI | — Key Buy Trigger AheadPrice is drifting lower and approaching a high-confluence retracement zone. A key bullish setup may form if price sweeps the 0.618–0.666 Fibonacci region and reclaims the level with strength.
📌 Buy Trigger:
• Sweep into the $2.38–2.5 zone
• Look for reclaim and bullish reversal for long entry
• Structure remains constructive while above monthly support ($1.91)
📈 Reclaim Level for Strength:
• $2.83 — clearing this confirms bullish intent
• Flip = strength toward $3.80 and beyond
🎯 Targets:
• $2.83 → Range reclaim level
• $3.50–3.60 → local resistance
• $5.36–5.37 → full upside liquidity target
🟥 Invalidation:
• Clean break below $1.90 (monthly support) = full invalidation
📌 Best setups form when liquidity is swept and price reclaims structure. Wait for the flush and follow strength.

EIGEN Eyes Key Demand — Watching $1 for a Potential BounceScenario 1 (Reversal from Demand):
Wait for lower timeframe (M15/H1) reversal signal in $0.98–$1.16 zone
If confirmed, consider long entries with tight risk below $0.98
First target: $1.40–$1.55 (local supply); next: $2.15
Scenario 2 (Breakdown):
If price loses $0.98 with no reaction, step aside — next strong support much lower
No interest in longs if green zone fails

AAVE: Bearish Range Play — Watching for Move Back to Monday Low✅ Break above Monday high rejected, confirming resistance
✅ Structure is bearish — main scenario is return to Monday low ($221.56)
✅ Watch for reaction at target for partial profit taking
Active Scenario:
Hold/enter shorts while below Monday high
Target: $221.56 (Monday low)
Partial profit: On first touch of Monday low
Watch: Price reaction for potential reversal/setup at Monday low
🔔 Triggers & Confirmations:
Only consider reversal/long on strong bounce or reclaim at Monday low
Remain bearish while price is under Monday high
🚨 Risk Warning:
Local trend is bearish — don’t fight structure until reversal is confirmed

BTC | At the Line Between ATH Expansion or Macro FlushBINANCE:BTCUSDT Bulls need to hold the $102k–$100.8k support and 1D 50MA for a shot at new highs.
– Wick into 1D FVG ($98k) is fine, but no daily close below 50MA allowed.
– Lose $100k? Then it’s sideline season — next real support only at $93k/$87k, macro flush risk toward $75k–$58k if momentum fails.
– As long as above 1D support/MA, there’s a chance for a clean ATH breakout from the OB under the highs.
This is the zone to bet on continuation. If not, don’t fight the trend lower.

HYPE: Distribution Zone — Best RR for Shorts?🎯 KUCOIN:HYPEUSDT Trading Plan:
Active Short Scenario:
Entry: $37–$45 zone
Invalidation: Daily closes above $45.8 (cut/derisk)
Partial TP: $27.5 (0.5 retrace), $22 (weekly gap), $13 (monthly demand)
No Longs:
Avoid opening fresh longs in this structure/zone
Wait for reclaim and closes above $45.8 for any long bias
🔔 Triggers & Confirmations:
Add on weakness/rejection at highs
Derisk or close if daily closes above range
🚨 Risk Warning:
Strong squeeze risk if range high breaks
Be disciplined with stops

SoFi Technologies (SOFI, 1D)On the daily chart, SoFi has broken out of its descending trendline, confirmed the breakout with a clean retest of the 0.618 Fibonacci retracement level at $12.33, and is now building upward momentum from this demand zone. This “buy zone” is acting as a launchpad for a potential mid-term move toward higher resistance levels.
Key Fibonacci-based upside targets:
– $13.48 (0.5 retracement)
– $14.64 (0.382 retracement)
– $16.07 (0.236 retracement) — within the defined target zone
– Extended target: $18.37 (1.0 Fibonacci projection)
Technical structure highlights:
– Breakout of multi-month downtrend + successful retest
– Price now trading above key EMAs (50/100/200)
– Volume expansion on bullish candles confirms demand
– Daily momentum favors further continuation toward the $14–$16 zone
– Premium supply zone above $16 may slow initial momentum but offers long-term potential toward $18+
Fundamental context:
SoFi is evolving as a vertically integrated fintech platform with strong brand recognition and growing user engagement across banking, investing, and lending services. As the company narrows losses and strengthens recurring revenue, investor interest in SOFI is growing — particularly as market appetite returns for high-quality fintech with path-to-profitability models.
The technical breakout is confirmed. As long as price remains above the $12.33–$12.50 buy zone, the bullish scenario remains valid with targets toward $14.64 and $16.07. A breakout above $16 would activate the full expansion toward $18.37 in the mid-term.

XRP — Triple Tap at Support or One More Low Before Lift-Off?🎯 BINANCE:XRPUSDT Trading Plan:
Scenario 1 (Support Holds):
Bullish above $1.90 — possible pre-breakout setup if structure improves
Look for volume/impulse above midrange to confirm move
Scenario 2 (Sweep Lower):
If $1.90 fails, set alerts at $1.39–$1.40 for reaction/reversal setup
Entry on strong reversal pattern at sweep zone
No Trade:
No action unless price at the range extremes or showing breakout structure
🔔 Triggers & Confirmations:
Only engage after confirmation: bullish SFP at $1.90 or $1.39–$1.40, or clear structure before breakout
📝 Order Placement & Management:
Buy: Only at $1.90 (on reclaim) or $1.39–$1.40 (on strong reversal)
Stop: Below range low ($1.90) or below sweep zone ($1.39)
Targets: $2.90 (range high), then $3.40 (liquidity sweep)
🚨 Risk Warning:
Wait for range extremes or breakout confirmation
Avoid chasing chop — patience until the setup is clean

BTC at the Crossroads — $91k Demand or Deeper Flush to $76k?🎯 BINANCE:BTCUSDT Trading Plan:
Scenario 1 — Bullish Reclaim:
If price reclaims 1D 50EMA and $104k, bias flips bullish; look for continuation toward ATHs
Scenario 2 — Base Case (Favored):
Remain patient for a move to $91k–$92k; swing-long setup on signs of strength or iH&S formation
If $91k–$92k holds, expect a summer rally and new ATHs later in 2025
Scenario 3 — Breakdown:
If $91k fails, prepare for deeper move to $73k–$76k; this is the “max long” zone if tested
Must hold here; below $73k–$76k, next support is $55k
🔔 Triggers & Confirmations:
Long only above $104k + 1D 50EMA, or after bullish structure at $91k–$92k
Major long only on strong support at $76k, with clear confirmation
📝 Order Placement & Management:
Buy: On reclaim of $104k (trend confirmation) or at $91k–$92k with iH&S/reversal pattern
Backup Buy: If $76k is tagged with confirmation
Stops: Under $91k or $73k (based on entry)
Targets: New ATHs for late 2025
🚨 Risk Warning:
Losing $91k opens path to $76k; losing $76k is a major structure break
Don’t knife-catch — wait for confirmation at each level

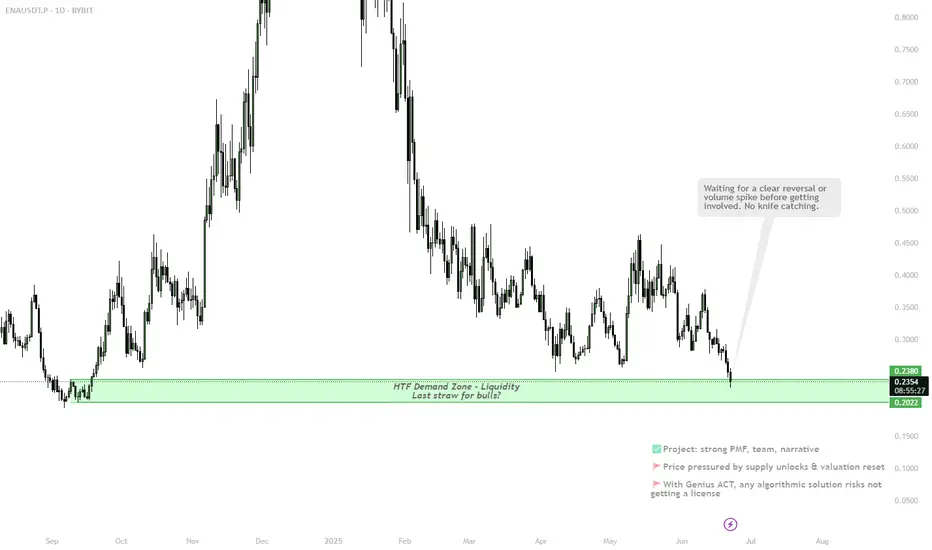
ENA At Make-or-Break Demand — Long-Term Thesis on the Line🎯 BINANCE:ENAUSDT Trading Plan:
Scenario 1 (Reversal from Demand):
Watch for strong reaction in demand zone ($0.24–$0.20)
Long-term entries on confirmation (H4/D1 SFP or reclaim above demand)
Scenario 2 (Breakdown):
No trade if $0.20 breaks with high volume/no bounce
Next demand much lower, patience required
🔔 Triggers & Confirmations:
Wait for clear reversal signal in HTF demand before entries
No knife catching if breakdown occurs
📝 Order Placement & Management:
🟩 Watch Zone: $0.24–$0.20 (set alert)
🛡️ Stop: Below $0.20 (on breakdown confirmation)
🚨 Risk Warning:
This is the last major demand before price discovery lower
Only enter if there’s clear strength or volume spike on reclaim
AAVE — Rising Wedge + Resistance Grind = Risk of PullbackStill one of the strongest DeFi leaders. Bullish market structure, but this persistent grind into diagonal resistance usually ends with a sharp pullback — and that's the zone I'm watching.
Eyes on $210–$237 for bids.
Targets: $400 and $600.
Set alarms and chill — opportunity comes to those who wait.

BTC is stuck in a tightening triangle — compression phaseVolatility building up into June 18–19.
Expect a big breakout.
Main scenario: breakout to the upside with a “God Candle” and new momentum for altcoins after prolonged BTC dominance.
Alts have been suppressed, but that’s part of the setup — don’t get tricked by the fake moves.
Stay patient, don’t lose focus, and be ready for a sharp move!

BTC Weekly Game Plan: Key Levels & Clear Setups!Short Scenario:
Enter on confirmed rejection (SFP or bearish MSB) from Equal Highs ($110,700) or BPR ($108,000)
Targets: $105,000 → $102,600 (Weekly Draw)
Invalidation (stop): Above $112,000 (Range High)
Long Scenario:
Enter on confirmed bounce (bullish MSB or SFP) at Weekly Draw ($102,600) or Range Low ($100,300)
Targets: $108,000 → $110,700
Invalidation (stop): Below $99,500 (under Range Low)
🔔 Triggers & Confirmations:
M15/H1 confirmation required: SFP or clear MSB before entry.
Avoid entries if price slices through levels without a reaction.
📝 Order Placement & Management:
🔻 Sell Limits: $110,700 & $108,000
🛡️ Short Stop: $112,100
🎯 Short Targets: $105,000 → $102,600
🔼 Buy Limits: $102,600 & $100,300
🛡️ Long Stop: $99,500
🎯 Long Targets: $108,000 → $110,700
🚨 Risk Warning:
Shorts are against HTF bullish momentum, increasing risk.
High volatility expected due to FOMC meetings (Tuesday/Wednesday).

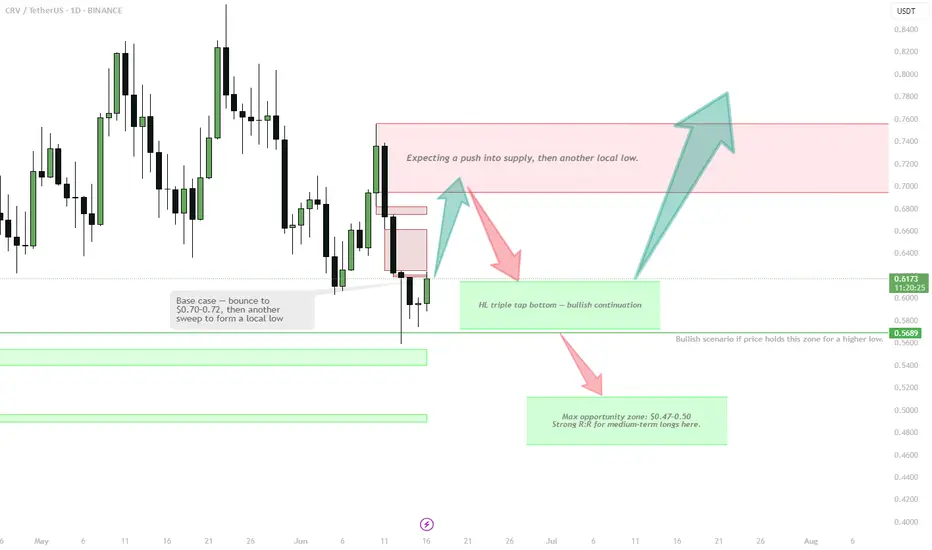
CRV | bounce then another sweep to form a local lowLiquidity taken, now eyeing push to $0.70–0.72 local supply.
Watching for another low after that move:
• HL triple tap = bullish base
• Or final drive into $0.47–0.50 = max opportunity for R:R swing longs
Breakout only confirmed above $0.75.
Patience — best setups come after the next local low.
ETH is holding the midrange supportETH tagged 50% of the down candle that took out local lows — textbook support zone for new longs.
Main risk: stops under $2,300 probably get swept before real reversal — watch for fakeout.
Holding above $2,400 keeps the bullish thesis alive, next target $2,780–2,800.
As always — manage risk, don’t get caught on the wrong side of a sweep.

SOL | Key Demand Zone Retest in PlayBINANCE:SOLUSDT has pulled back into a major demand zone, following rejection from a local supply block. This zone previously acted as the base of the last impulsive move and now presents a critical level for a bullish reversal.
🟩 Key Demand Zone: $135–$125
• Valid demand cluster from April expansion
• Looking for bullish reversal signs or SFP before confirming entry
• Invalidates below $122.75
📌 Trade Setup (if confirmed):
• Entry near $125–130
• Target: $220 (79% upside)
• SL: Below $122.75
• R:R ≈ 4.88
🟥 Invalidation:
• Clean break below $122.75 = structure break
• Bearish continuation toward $102–105 zone
📌 This is the zone to look for strength — weak bounce = stand aside. Strong reaction = high R:R opportunity.

FARTCOIN | Dream scenarioTextbook ABC correction into the $0.83–0.75 zone.
Will the fartcoin gods let us bid sub $1 again? Odds are low, but man can dream.
If filled, expecting a big wave up — ultimate R/R.
Main risk: market front-runs and never fills — be nimble, ladder bids if you're serious.
"If you get the dream fill, don't fumble the bag."

ARB — Waiting for Dip into FVG Buy ZonePrice is hovering just above a key Daily FVG zone, following a rejection from the $0.40 prior resistance. Current structure does not justify longs unless a dip into the FVG zone occurs.
🟩 Buy Zone: $0.3135–$0.33 (FVG)
• Confluence of demand and fair value gap
• High-probability entry if price dips into this area
• No setup above current price — wait for confirmation
🔴 Invalidation:
• Breakdown below $0.294 = structural failure
🎯 Targets:
• First: $0.40 (prior resistance)
• Then: $0.513–$0.514 (monthly resistance zone)
📌 Clear plan: no FOMO. Only act on dip into value zone, not from mid-range.
