AUDNZD 1D BULL FLAG BULLISH CHART PATTERN LONG BIASPrice has created a Bull Flag chart pattern which has a Bullish bias (LONG TRADE).
Each chart pattern will have defining trendlines of the support/resistance levels creating the pattern.
What ever time frame you are trading this chart pattern, wait for a candle close outside of the trendline in the direction of the breakout candle. (Our time frame preference is the Daily chart ).
Add volume indicator - Volume is the amount of $ that went into a particular candle or in Forex the # of trades that took place.
Add ATR indicator - Volatility is the amount of price movement that occurred. Use the ATR to measure the price movement.
When you see descending volume bars and descending atr line (which indicates volatility ) this shows
a dis-interest in traders to invest in this pair creating consolidation which creates the chart pattern.
Trade Management after there is a breakout candle close.
1 - Position size (compare volume bar to volume ma line).
a - Breakout candle must be 100% of average volume for a full position size.
b - If 75% of average volume then ½ position size.
2 - Enter two trades.
3 - SL for both trades will be 1.5 x ATR.
4 - 1st trade TP will be 1 x ATR.
5 - No TP on 2nd trade – letting profit run and adjusting SL to follow price.
6 - When 1st TP hit – move 2nd trade SL to breakeven.
7 - Adjust the 2nd trade SL to follow price.
*8 - When breakout candle is more than 1 ATR from breakout candle open.
a - Enter 1st trade at candle close with ½ position size.
b - Enter 2nd trade with a pending limit order that is 1 ATR of breakout candle open.
c – Price should pullback to that pending limit order for 2nd trade.
d – If Price returns back into chart pattern close trade before SL is hit.
1d

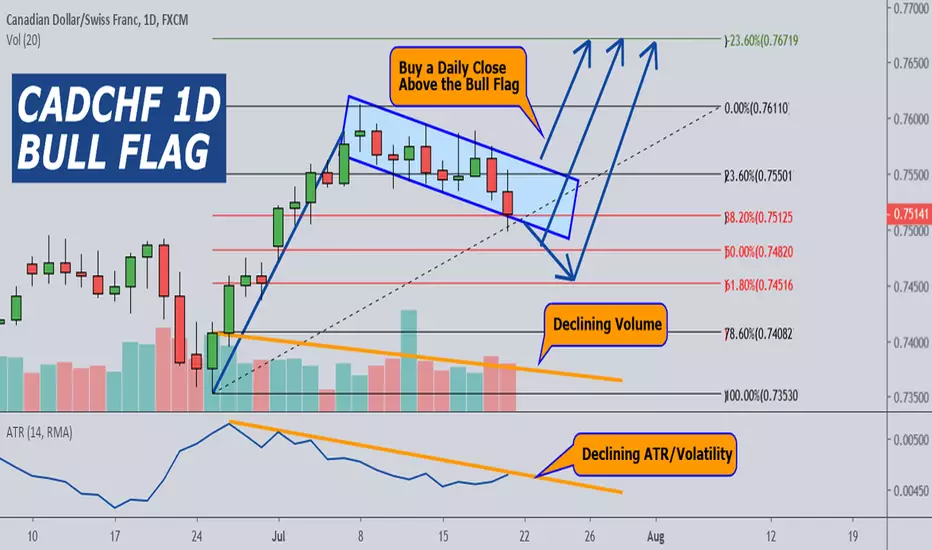
CADCHF 1D BULL FLAG CHART PATTERNPrice has created a Bull Flag chart pattern which has a Bullish bias (LONG TRADE).
Each chart pattern will have defining trendlines of the support/resistance levels creating the pattern.
What ever time frame you are trading this chart pattern, wait for a candle close outside of the trendline in the direction of the breakout candle. (Our time frame preference is the Daily chart).
Add volume indicator - Volume is the amount of $ that went into a particular candle or in Forex the # of trades that took place.
Add ATR indicator - Volatility is the amount of price movement that occurred. Use the ATR to measure the price movement.
When you see descending volume bars and descending atr line (which indicates volatility) this shows
a dis-interest in traders to invest in this pair creating consolidation which creates the chart pattern.
Trade Management after there is a breakout candle close.
1 - Position size (compare volume bar to volume ma line).
a - Breakout candle must be 100% of average volume for a full position size.
b - If 75% of average volume then ½ position size.
2 - Enter two trades.
3 - SL for both trades will be 1.5 x ATR.
4 - 1st trade TP will be 1 x ATR.
5 - No TP on 2nd trade – letting profit run and adjusting SL to follow price.
6 - When 1st TP hit – move 2nd trade SL to breakeven.
7 - Adjust the 2nd trade SL to follow price.
*8 - When breakout candle is more than 1 ATR from breakout candle open.
a - Enter 1st trade at candle close with ½ position size.
b - Enter 2nd trade with a pending limit order that is 1 ATR of breakout candle open.
c – Price should pullback to that pending limit order for 2nd trade.
d – If Price returns back into chart pattern close trade before SL is hit.
AUDUSD 1D BUY LIMIT TRIANGLE BREAKOUT STRATEGYTriangle Breakout Buy Limit Strategy
If breakout candle is greater than 1 ATR
1 Buy 1/2 position size at breakout candle close @ .7075
2 Place 1/2 position size buy limit pending order just above 1 ATR level @ .7055
1st trade TP .7075 (entry price) + .0045 (atr) = .7120
2nd trade TP let run have SL follow price
SL you find

CAVCO 1D ASCENDING TRIANGLE BULLISH PATTERNAscending Triangles, Triangle, Descending Triangles and Ranges are repeatable trading chart patterns.
Triangles and ranges are consolidation chart patterns that can breakout either direction.
Ascending and descending chart patterns will have a directional bias depending on the previous incoming trend.
Each chart pattern will have defining trendlines of the support/resistance levels creating the pattern.
What ever time frame you are trading this chart pattern, wait for a candle close outside of the trendline in the direction of the breakout candle. (Our time frame preference is the Daily chart).
Add volume indicator - Volume is the amount of $ that went into a particular candle or in Forex the # of trades that took place.
Add ATR indicator - Volatility is the amount of price movement that occurred. Use the ATR to measure the price movement.
When you see descending volume bars and descending atr line (which indicates volatility) this shows
a dis-interest in traders to invest in this pair creating consolidation which creates the chart pattern.
Trade Management after there is a breakout candle close.
1 - Position size (compare volume bar to volume ma line).
a - Breakout candle must be 100% of average volume for a full position size.
b - If 75% of average volume then ½ position size.
2 - Enter two trades.
3 - SL for both trades will be 1.5 x ATR.
4 - 1st trade TP will be 1 x ATR.
5 - No TP on 2nd trade – letting profit run and adjusting SL to follow price.
6 - When 1st TP hit – move 2nd trade SL to breakeven.
7 - Adjust the 2nd trade SL to follow price.
*8 - When breakout candle is more than 1 ATR from breakout candle open.
a - Enter 1st trade at candle close with ½ position size.
b - Enter 2nd trade with a pending limit order that is 1 ATR of breakout candle open.
c – Price should pullback to that pending limit order for 2nd trade.

KRAFT 1D RANGE TRADESRanges, Triangles, Ascending Triangle, and Descending Triangles are repeatable trading chart patterns.
Ranges & Triangles are consolidation chart patterns that can breakout either direction.
Ascending and descending chart patterns will have a directional bias depending on the previous incoming trend.
Each chart pattern will have defining trendlines of the support/resistance levels creating the pattern.
What ever time frame you are trading this chart pattern, wait for a candle close outside of the trendline in the direction of the breakout candle. (Our time frame preference is the Daily chart).
Add volume indicator - Volume is the amount of $ that went into a particular candle or in Forex the # of trades that took place.
Add ATR indicator - Volatility is the amount of price movement that occurred. Use the ATR to measure the price movement.
When you see descending volume bars and descending atr line (which indicates volatility) this shows
a dis-interest in traders to invest in this pair creating consolidation which creates the chart pattern.
Trade Management after there is a breakout candle close.
1 - Position size (compare volume bar to volume ma line).
a - Breakout candle must be 100% of average volume for a full position size.
b - If 75% of average volume then ½ position size.
2 - Enter two trades.
3 - SL for both trades will be 1.5 x ATR.
4 - 1st trade TP will be 1 x ATR.
5 - No TP on 2nd trade – letting profit run and adjusting SL to follow price.
6 - When 1st TP hit – move 2nd trade SL to breakeven.
7 - Adjust the 2nd trade SL to follow price.
*8 - When breakout candle is more than 1 ATR from breakout candle open.
a - Enter 1st trade at candle close with ½ position size.
b - Enter 2nd trade with a pending limit order that is 1 ATR of breakout candle open.
c – Price should pullback to that pending limit order for 2nd trade.

GBPNZD long setupdaily chart showed support which was respected many times. Going down a timeframe, price reacted off trendline and 15min shows a descending pattern emerging in which I hope breaks out the upside.

LTCUSD 1D TRIANGLE BREAKOUT TRADESTriangles, Ascending Triangle, Descending Triangles and Ranges are repeatable trading chart patterns.
Triangles and ranges are consolidation chart patterns that can breakout either direction.
Ascending and descending chart patterns will have a directional bias depending on the previous incoming trend.
Each chart pattern will have defining trendlines of the support/resistance levels creating the pattern.
What ever time frame you are trading this chart pattern, wait for a candle close outside of the trendline in the direction of the breakout candle. (Our time frame preference is the Daily chart).
Add volume indicator - Volume is the amount of $ that went into a particular candle or in Forex the # of trades that took place.
Add ATR indicator - Volatility is the amount of price movement that occurred. Use the ATR to measure the price movement.
When you see descending volume bars and descending atr line (which indicates volatility) this shows
a dis-interest in traders to invest in this pair creating consolidation which creates the chart pattern.
Trade Management after there is a breakout candle close.
1 - Position size (compare volume bar to volume ma line).
a - Breakout candle must be 100% of average volume for a full position size.
b - If 75% of average volume then ½ position size.
2 - Enter two trades.
3 - SL for both trades will be 1.5 x ATR.
4 - 1st trade TP will be 1 x ATR.
5 - No TP on 2nd trade – letting profit run and adjusting SL to follow price.
6 - When 1st TP hit – move 2nd trade SL to breakeven.
7 - Adjust the 2nd trade SL to follow price.
*8 - When breakout candle is more than 1 ATR from breakout candle open.
a - Enter 1st trade at candle close with ½ position size.
b - Enter 2nd trade with a pending limit order that is 1 ATR of breakout candle open.
c – Price should pullback to that pending limit order for 2nd trade.

TRIANGLE BREAKOUT TRADES ON DAILYTriangles, Ascending Triangle, Descending Triangles and Ranges are repeatable trading chart patterns.
Triangles and ranges are consolidation chart patterns that can breakout either direction.
Ascending and descending chart patterns will have a directional bias depending on the previous incoming trend.
Each chart pattern will have defining trendlines of the support/resistance levels creating the pattern.
What ever time frame you are trading this chart pattern, wait for a candle close outside of the trendline in the direction of the breakout candle. (Our time frame preference is the Daily chart).
Add volume indicator - Volume is the amount of $ that went into a particular candle or in Forex the # of trades that took place.
Add ATR indicator - Volatility is the amount of price movement that occurred. Use the ATR to measure the price movement.
When you see descending volume bars and descending atr line (which indicates volatility) this shows
a dis-interest in traders to invest in this pair creating consolidation which creates the chart pattern.
Trade Management after there is a breakout candle close.
1 - Position size (compare volume bar to volume ma line).
a - Breakout candle must be 100% of average volume for a full position size.
b - If 75% of average volume then ½ position size.
2 - Enter two trades.
3 - SL for both trades will be 1.5 x ATR.
4 - 1st trade TP will be 1 x ATR.
5 - No TP on 2nd trade – letting profit run and adjusting SL to follow price.
6 - When 1st TP hit – move 2nd trade SL to breakeven.
7 - Adjust the 2nd trade SL to follow price.
*8 - When breakout candle is more than 1 ATR from breakout candle open.
a - Enter 1st trade at candle close with ½ position size.
b - Enter 2nd trade with a pending limit order that is 1 ATR of breakout candle open.
c – Price should pullback to that pending limit order for 2nd trade.

LTCUSD 1D TRIANGLE PATTERN Triangles, Ascending Triangle, Descending Triangles and Ranges are repeatable trading chart patterns.
Triangles and ranges are consolidation chart patterns that can breakout either direction.
Ascending and descending chart patterns will have a directional bias depending on the previous incoming trend.
Each chart pattern will have defining trendlines of the support/resistance levels creating the pattern.
What ever time frame you are trading this chart pattern, wait for a candle close outside of the trendline in the direction of the breakout candle. (Our time frame preference is the Daily chart).
Add volume indicator - Volume is the amount of $ that went into a particular candle or in Forex the # of trades that took place.
Add ATR indicator - Volatility is the amount of price movement that occurred. Use the ATR to measure the price movement.
When you see descending volume bars and descending atr line (which indicates volatility) this shows
a dis-interest in traders to invest in this pair creating consolidation which creates the chart pattern.
Trade Mangement after there is a breakout candle close.
1 - Position size (compare volume bar to volume ma line).
a - Breakout candle must be 100% of average volume for a full position size.
b - If 75% of average volume then ½ position size.
2 - Enter two trades.
3 - SL for both trades will be 1.5 x ATR.
4 - 1st trade TP will be 1 x ATR.
5 - No TP on 2nd trade – letting profit run and adjusting SL to follow price.
6 - When 1st TP hit – move 2nd trade SL to breakeven.
7 - Adjust the 2nd trade SL to follow price.
*8 - When breakout candle is more than 1 ATR from breakout candle open.
a - Enter 1st trade at candle close with ½ position size.
b - Enter 2nd trade with a pending limit order that is 1 ATR of breakout candle open.
c – Price should pullback to that pending limit order for 2nd trade.


AUDNZD 1D STOCHATIC INTRADAY TRADEFind daily pair where
Daily Chart
1: Stochastic lines have crossed below 20 level
2: K line above D line
3: K line crosses above 20 level - then
4: Look at 15m chart for swing low pattern
15m Chart -
Swing Low Pattern
1st candle higher low
2nd candle lower low
3rd candle higher low
Look for
1: Stochastic lines have
crosses below 20 level
2: K line above D line
3: K line crosses above 20 level - then look for swing low pattern
4: Buy Stop at breakout of Swing Low Pattern Highest High
5: SL 5 pips below previous swing low
6: TP is a 1x2 risk reward

BOEING 1D ASCENDING TRIANGLE PATTERNPrice has created an ascending triangle pattern which has a bullish bias
The declining Volume and ATR/Volatility levels indicate traders have lost interest in investing in Boeing
This is creating consolidation pressure on the top triangle level @ 379.30
Trade Plan
Buy a daily close above 379.30
Breakout Candle must be 100% of the average volume for a full size position
If bar is only at 75% of the average volume then only trade 1/2 position size
Open two trades - 1% each
Stop Loss is 1.5 x ATR
1st Take Profit is 1 x ATR
2nd trade no TP let profit run
When 1st TP hit, move SL of 2nd trade to breakeven
Watch our YouTube video for further information on this trade

UBER TECH ASCENDING TRIANGLE LONG BREAKOUT TRADEUber is in an ascending triangle chart pattern - bullish bias trade
Buy on daily close above 45.00
Use full-size position only if volume
breakout candle is at least average.
Otherwise, use 1/2 size as long as volume
is at least 75% of average.
Find your own SL & TPText
We are doing a live triangle trading class on our TTT Strategy June 25th @ 2PM ET! If you are interested in learning more about it, please visit the link you see below in our signature. Thanks!

NIO Long Target This is my own speculative analysis on where NIO could potentially be headed based on the exponential moving averages starting to pinch. If successful, the highlighted range is my target. If unsuccessful, I wouldn't be surprised to see a retest of the 52w low. Trade carefully and manage your risk. This chart was created on the 1D timescale.

bitcoin short term setup 17.45% GAIN!!!!!!BTCUSD has reached resistance zone and delving into lower timeframes, I see that price is in a channel where it has reached the blue resistance line as well as the yellow resistance line which is 2 confirmations.
Price than came back down and formed a bearish flag pattern which is creeping back up the yellow resistance zone. Waiting for retest off that area which gives me confirmation that market is about to go low.

XAUUSD TRIANGLE BULLISH BREAKOUT ENTRYDay chart shows ascending triangle chart pattern - bullish bias
1H chart shows failed bullish breakout - price re-entered triangle pattern - bounces off bottom -breaks top
15m chart with fib shows an entry point - you choose
Tell us what SL & TP yu want to choose in the comment section below
We are doing a live triangle trading class on our TTT Strategy June 25th @ 2PM ET! If you are interested in learning more about it, please visit the link you see below in our signature. Thanks!

FESTIVAL'S OF TRIANGLE BREAKOUTS LTCUSD TRIANGLE BREAKOUT CHART PATTERN
GOLD SPOT ASCENDING TRIANGLE BREAKOUT
GBPJPY DESCENDING TRIANGLE BREAKOUT
We are doing a live triangle trading class on our TTT Strategy June 25th @ 2PM ET! If you are interested in learning more about it, please visit the link you see below in our signature. Thanks!

LTCUSD 1D TRIANGLE CHART PATTERNLITECOIN is in a Triangle chart pattern
Wait for a breakout candle close with volume for entry
We are doing a live triangle trading class on our TTT Strategy June 25th @ 2PM ET! If you are interested in learning more about it, please visit the link you see below in our signature. Thanks!

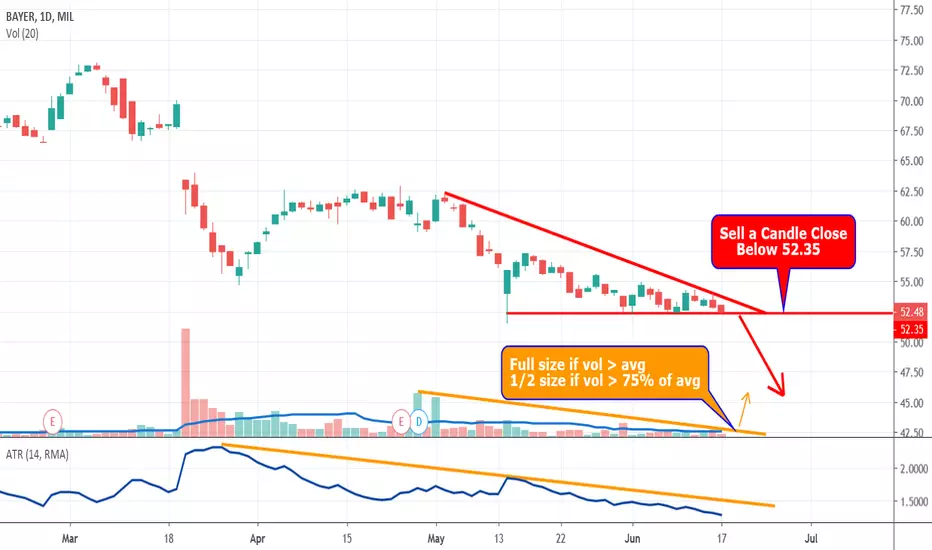
Is Bayer Going To Need Aspirin For Their Roundup Issues?Bayer is a descending Triangle Chart Pattern
Strong support level has been re-tested several times
Continually lower highs puts pressure on this support level
Best patterns have dropping volume and volatility/ATR
Fewer traders are interested in this consolidatation
At some point expect an explosive breakout
Trade Plan
Wait for a close below the support level
Full trade size if volume is at average atr line
1/2 trade size as long as bar has 75% of average volume
Enter two trade
Both trades SL is 1.5xATR
1st trade TP is 1xATR
2nd trade no TP let profit run
When price hits 1st TP move 2nd trade AL to breakeven
Let profit run
If breakout candle is more than 1 ATR wait for price to retrace back towards 1 ATR level to enter
EURUSD 1D BULLISH BOUNCE OFF BULLISH WEDGE BREAKOUT EURUSD 1D BROKE LONG OUT OF A BULLISH WEDGE
PRICE NOW RETRACING BACK TO TOP WEDGE TRENDLINE
PRICE WILL EITHER BOUNCE BULLISH
OR RE-ENTER BACK INTO WEDGE PATTERN
LONG TRADE ENTER TWO POSITIONS
1ST POSITION TP IS RE-TEST OF HIGH @ 1.1348
2ND POSITION TP IS SUPPORT LEVEL @ 1.1550
FIND YOUR OWN SL

BTCUSD 1D CONTINUATION TRIANGLE BREAKOUT TRADEPrice is in a consolidating continuation triangle pattern
There is a nice bullish trend before this pattern
You see dropping interest in trades by the dropping volume bars
And dropping volatility found in the dropping ATR values
Volume is the amount of $ that went into a particular candle or in Forex the # of trades that took place
Volatility is the amount of price movement that occurred. Use the ATR to measure the price movement
A continuation triangle pattern expects the bullish trend coming into it will continue on the breakout.
But be prepared if price movement decides to retrace with a bearish breakout.
Buy on a daily close above the triangle
Sell on a daily close below the triangle
Trade a full size position if the volume
of the breakout candle is at least equal
to the average volume.
Use 1/2 size position if the volume is at
least 75% of the average volume
If closed candle is more that 1 ATR outside of the pattern, stand aside and wait for price to retrace back to that 1 ATR level to get in.
If you are afraid you might miss it put a limit order at the 1 ATR level and price will trigger it as soon as $ pulls back to that level.
SL is 1.5xATR of breaking bar
TP is 1xATR of breaking bar
At 1st TP close 1/2 of position.
Move SL to break-even
Let remainder of trade run
Watch trade - cryptocurrency trades all weekend

ETHUSD 1D RANGE TRADESPrice has been in a range
Volume dropping causing consolidation
ATR and Volatility dropping because candle size is smaller
This is a pattern to look for because traders are getting bored with this consolidation pattern so breakout pending
Wait for breakout candle either long or short to close outside range
Wait for volume bar to be at average line to trade 100% full size
or at 75% of average then trade 50% of size
SL 1.5 x ATR

ETHUSD 1D BITCOIN SIGNAL INDICATOR STRATEGYBitcoin Indicator used on all markets and time frames
Bitcoin Indicator shows entry signal, take profit and has a trailing stop loss
