Review of the USDPLN chart on the 1D intervalHi everyone,
Let's take a look at the USDPLN chart in the 1-day range.
As you can see, we moved in an uptrend channel marked with yellow lines for a while, then entered a downtrend marked with blue lines, and then exited from the top.
It is worth setting the first support zone from PLN 4.63 to PLN 4.57, and then we have a strong support zone from PLN 4.47 to PLN 4.37. Looking further, we see another support at the level of PLN 4.24
Now let's move on to the resistance that the USD valuation has on the way and we can see that the first resistance is a strong zone from 4.72 to 4.78 PLN and another resistance at 4.86 PLN.
Let's take a look at the Chop indicator, which shows that we are getting energized after the last increase, and the MACD indicator shows a local downtrend.
1daychart

Long-term BTC analysisHi everyone.
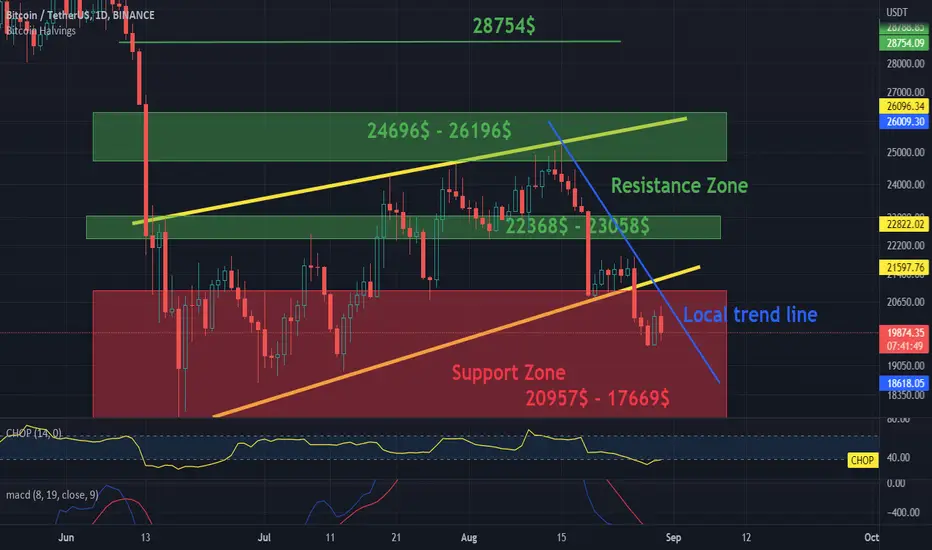
Today we marked the uptrend channel with yellow lines, which was broken at the bottom and now the price is below the local downtrend line.
As you can see, we have an important support zone:
-the support zone in which the BTC price is currently located from $ 20,957 to $ 17,669, if the price drops below the designated zone, we can expect further drops to around $ 12,000.
Then we have the first resistance zone from $ 22,368 to $ 23058 if we break it, then we have a resistance zone from $ 24,696 to $ 26,196. A break from this zone could result in further gains towards the resistance at $ 28,754.
Also noteworthy is the CHOP indicator, which indicates that we have a lot of energy, and the MACD indicator, which indicates that we are on the verge of entering a downtrend.
Remember, however, that this is not investment advice.
Btc’s big brown rising wedgeWouldn’t surprise me if price does a slow grind up this wedge for a bit. *not financial advice*

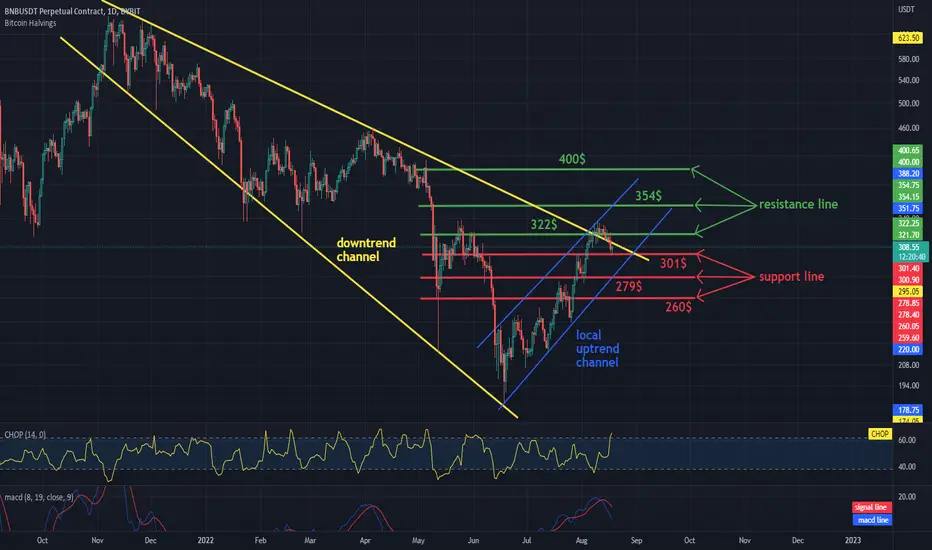
Will BNB reverse its long downtrend?Hello everyone, let's take a look at the BNB to USDT chart over the 1 day timeframe. As you can see, we have been moving in the downtrend channel for a long time, while locally we are in an uptrend and in a place where we can try to break out of a long-term downward trend.
Let's start with the designation of the support line and as you can see the first support in the near future is $ 301, if the support breaks down, the next support is $ 279 and $ 260.
Now let's move from the resistance line, as you can see the first resistance we are currently struggling with is $ 322 breaking the first resistance will give us a potential exit from the long downturn channel, if we can break it, the next resistance will be $ 354 and $ 400.
Looking at the CHOP indicator, we can see that in the 1-day range we have a lot of energy, and the MACD indicator shows that we are in a downward trend locally.
BTC relies on support at $ 23,021Hi everyone.
Today with yellow lines we have marked the channel in which the BTC price is currently moving.
As you can see, we have two important zones:
-first is the support line on which the price is currently based at $ 23,021, then we have a support zone ahead of the price which ranges from $ 20,957 to $ 17,669, if the price drops below the designated zone, we can expect further drops to around 12,000 dollars.
- the second is a resistance zone, we have from $ 24,696 to $ 26,196. A break from this zone may result in further increases towards the resistance at $ 28,754.
Currently, the price on our channel is shifting nicely to the side, which could potentially be used for short-term licks.
Also noteworthy is the CHOP indicator, which indicates that we have a lot of energy, and the MACD indicator, which indicates that we have entered a local downward trend.
Remember, however, that this is not investment advice.

Here is the falling wedge we currently have 1 daily candle aboveThis is the larger falling wedge that current price action is above on the 1 day chart. We haven’t confirmed a breakout of it yet but with the smaller bullflag and double bottom patterns looking like they will validate and take price to 26.3k, there is a good chance that after we correct from that zone that when price action comes back down to retest the top white trendline of the wedge it will be flipped to solidified support, at which time we have a real chance of validating the breakout from the falling wedge. Should the falling wedge confirm a breakout then the target is above 60k! Not confirmed yet but starting to increase in probability as each day passes. *not financial advice*

Sand has a very similar inv h&s to mana2 potential necklines here..this descending white one and the more conventional horizontal one in yellow..wouldn’t surprise me that if one of them validates they both do. *not financial advice*

Review of the USD / PLN chart on the 1D intervalHi everyone,
Let's take a look at the USDPLN chart on the 1-day interval.
As you can see, for some time we were moving in the uptrend channel marked by yellow lines, but now we are moving in the local downward trend.
It is worth setting the first support line at 4.54 PLN, and then we have a strong support zone from 4.47 PLN to 4.37 PLN. Looking further, we see another support at the level of PLN 4.24
Now let's move on to the resistance that the USD valuation has on its way and we see that the first resistance appears at 4.64PLN, the next one at 4.68PLN, then we have a strong resistance zone from 4.72PLN to 4.78PLN and the next resistance at 4.86PLN.
Let's look at the Chop indicator which shows that we still have a lot of energy and the MACD indicator shows a local downward trend, but the blue line bends strongly and is close to the intersection of the red line from the bottom, which would confirm the upward trend change.

ADAUSDT price chart reviewHi everyone
Let's take a look at the ADAUSDT chart on the one-day timeframe. As you can see in the long run, the ADA is moving in the downward channel marked with yellow lines, while in the short run we are moving in the local upward channel marked with blue lines.
It's worth setting a support zone with the price in front of you from $ 0.409 to $ 0.226
and
resistance zones, and in this case it is worthwhile to determine two:
- first resistance zone from $ 1.054 to $ 1.44
- second resistance zone from $ 2,081 to $ 2,544
Looking at the 1-day interval on the CHOP indicator, we can see that we still have a lot of energy for the next move, and the MACD indicator confirms the local upward trend.

Support and resistance zones for DOT / USDTWe managed to exit the downtrend channel marked with blue lines and change it to the current uptrend marked with yellow lines.
It is worth highlighting two areas of support that we have:
The first zone FROM $ 8.81 TO $ 8.24 and the second zone FROM $ 7.36 TO $ 6.78. THEN WE LOOK AT RESISTANCE ZONES AND CURRENTLY WE ARE TESTING A ZONE FROM $ 9.64 TO $ 10.61 IF YOU CAN CHOOSE IT, ANOTHER IMPORTANT RESISTANCE ZONE FROM $ 15.49 - $ 21.30.
IT IS WORTH NOTICE THAT ON A ONE-DAY INTEWRALE WE HAVE A LOT OF ENERGY FOR THE NEXT MOVEMENT AND THAT THE MACD INDICATOR CONFIRMS THE LOCAL IMPROVEMENT TREND.

Double bottom & bullflag both share the same breakout targetWe can see the double bottom pattern here in blue and the bullflag in lime neon green. Both breakout targets take us to the 26.3k range. This is great bullish confluence also great to see how when inside the flag the price action held perfect support when retesting the teal horizontal neckline of the double bottom. This all appears to be leading to something potentially much much bigger though as we can see on the coinbase chart price action is now above this descending white trendline. If we can flip this trendline to solidified support we might see a much bigger macro chart pattern breakout of a monthly chart falling wedge that has a much bigger target. I will post a separate Idea about that pattern and link both of these ideas together. Looking quite bullish overall I think the uptrend is going to be officially confirmed here. *not financial advice*

SHIB / USDT on 1Day IntervalHi everyone,
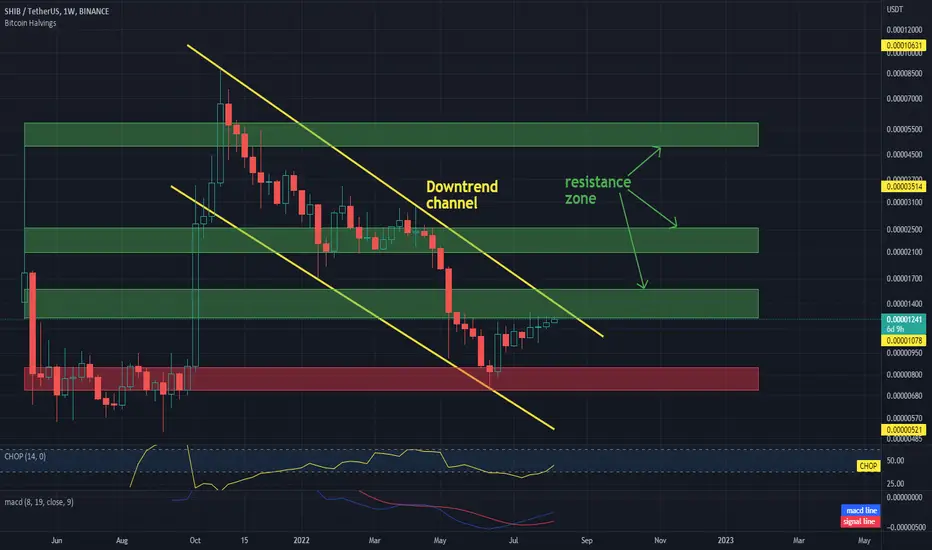
Let's take a look at the SHIBUSDT chart on the 1 day time frame.
As you can see, we are moving in the downtrend channel marked with yellow lines.
It is worth setting a support zone from which the SHIB price has rebounded, and 3 important resistance zones that the price has in front of it. We are currently fighting the first one from $ 0.00001245 to $ 0.00001567. However, it should be taken into account that in order to break the first resistance zone, we have to leave the downward channel upwards and change the trend in the long term.
The CHOP indicator shows that we are starting to gain more and more energy and the MACD indicator shows a local upward trend.
XRP at the top of the support zone!Hello, we are reviewing the XRP to USDT chart on a 1 day time frame looking at the long term.
It is worth designating two channels, the yellow lines for the uptrend channel and the blue lines for the downtrend channel in which we are currently. A price behavior that moves from the bottom to the top of the channel can be used for short-term licks.
It is worth noting that we are currently in the lower part of the channel and in the support zone. Looking at the price of XRP in the long term, it is worth setting two resistance zones that we must overcome in the future, the first is from $ 0.682 to $ 0.947, while the second is from $ 1.33 to $ 1.62.
Let us pay attention to the CHOP indicator which indicates that on the 1-day interval we are starting to regain energy, and the MACD indicator shows that the blue line has crossed the red one from the bottom, which confirms the local upward trend.

DOGE / USDT 1D IntervalHello everyone, let's take a look at the 1D DOGE to USDT chart as you can see the price is moving above the local uptrend line.
Let's start by setting goals for the near future that we can consider:
T1 = $ 0.06989
T2 = $ 0.07095
T3 = $ 0.07269
and
T4 = $ 0.07477
Now let's move on to the stop loss in case of further market declines:
SL1 = $ 0.06891
SL2 = $ 0.06819
SL3 = $ 0.06747
SL4 = $ 0.06633
SL5 = $ 0.06507
and
SL6 = $ 0.06117
Looking at the CHOP indicator, we can see that in the 1-day range we have a lot of energy and the MACD indicator shows a local upward trend.

Daily review of BTC interval 1DHello everyone, let's take a look at the BTC to USDT chart on a 1 day timeframe. As you can see, the price is moving in the local uptrend channel.
Let's start with the designation of the support line and as you can see the first support that the price is currently based on is $ 23,179, if the support breaks down, the next support is $ 22,694, $ 22,219 and $ 21,541.
Now let's move from the resistance line as you can see the first resistance is $ 23,509, if you can break it the next resistance will be $ 23,775 and $ 24,181.
Looking at the CHOP indicator, we can see that in the 1-day interval we still have energy to continue the movement and the MACD indicator shows a local downward trend.

Will BNB reverse its long downtrend?Hello everyone, let's take a look at the BNB to USDT chart on a 1 day time frame. As we can see, we have been moving in the downtrend channel for a long time, while locally we are in the upward trend and in a place where we can try to break out of the long-lasting downward trend.
Let's start with the designation of the support line and as you can see the first support in the near future is $ 293, if the support breaks down, the next support is $ 271 and $ 254.
Now let's move from the resistance line, as you can see, the first resistance we are currently struggling with is $ 322 breaking the first resistance will give us a potential exit from the long downturn channel, if we can break it, the next resistance will be $ 354 and $ 400.
Looking at the CHOP indicator, we can see that in the 1-day interval most of the energy has been used, and the MACD indicator indicates that we are locally in an upward trend.

ETH collects a lot of energy on a 1-day intervalHello everyone, let's take a look at the ETH to USDT 1 day chart as we can see price movements in the upward channel denoted by the yellow lines.
It is worth designating two support zones that the price has in the event of a correction, and as you can see, the first zone is $ 1,570 to $ 1,442, but if the next zone is broken, the next zone is $ 1,224 to $ 1,070.
Now let's move on to the resistance that ETH has in front of it. In this case, we can also designate two zones, the first of which is in the range from $ 1,913 to $ 2,235, while the second is in the range of $ 2,564 - $ 3,012.
Note the CHOP indicator, which shows that we still have a lot of energy for the next price move in the 1-day range, and the MACD indicator shows that we are in a local downtrend.

Daily BTCUSDT reviewHello everyone, let's take a look at the BTC to USDT chart over the 1 day timeframe as we are seeing movements in the local uptrend channel.
Let's start with the designation of the support line and as you can see the first support in the near future is $ 22,696, if the support breaks down, the next support is $ 22,243 and $ 21,520.
Now let's move from the resistance line as the first resistance is $ 23,255, if you can break it the next resistance will be $ 23,512, $ 23,796 and $ 24,212.
Looking at the CHOP indicator we can see that on the 1 day timeframe the CHOP indicator shows that we still have a lot of energy and the MACD indicator shows a downward trend in line with the price movement.

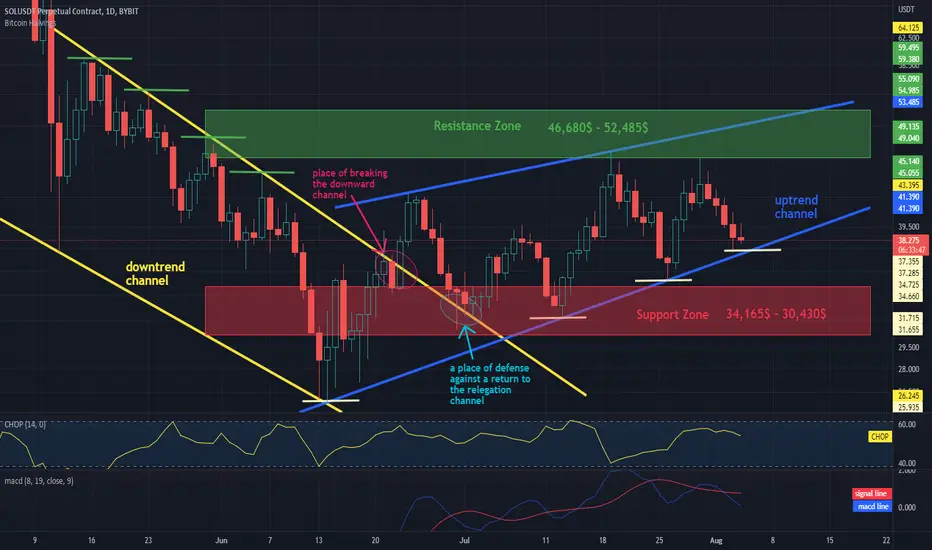
Review of the SOL situation on a 1-day intervalHi everyone,
Let's take a look at the SOLUSDT chart on the 1 day time frame.
What is striking in the foreground are two channels:
- the downtrend channel marked with yellow lines
and
- the uptrend channel marked with blue lines
Then, expressively, we can notice the place where the downward trend breaks and the point of defense of the upward trend change in which we are currently.
It is also worth designating support and resistance zones, and so we can see that the support zone is from $ 34,165 to $ 30,430, and the resistance zone is from $ 46.680 to $ 52,485.
Going further, we should pay attention to the behavior of the price, which moves nicely from the upper to the lower limit of the channel, which can potentially be used in short-term games with appropriately selected stoplots.
Remember these are my thoughts and this is not an investment advice :)
BTC relies on support at $ 23,021Hi everyone.
Today we have marked the channel in which the BTC price is currently moving with blue lines.
As you can see, we have two important zones:
-the first one is the support line on which the price is currently based on $ 23,021, then we have a support zone ahead of the price, which ranges from $ 20,957 to $ 17,669, if the price drops below the designated zone, we can expect further drops to around $ 12,000.
- the second is a resistance zone, we have from $ 24,696 to $ 26,196. A breakout from this zone may result in further increases towards the resistance at the level of $ 28,754.
Currently, the price on our channel is moving nicely to the side, which could potentially be used for short-term licks.
Also worth noting is the CHOP indicator, which indicates that energy is slowly depleting, and the MACD indicator, which indicates that we have entered a local downward trend.
Remember, however, that this is not investment advice.

Take a look at the BTC to USDT 1 day chartHello everyone, let's take a look at the BTC to USDT chart on a 1 day timeframe. As you can see, price is moving above the local uptrend line.
Let's start with the designation of the support line and as you can see the first support in the near future is $ 24,325, if the support breaks down, the next support is $ 23,044 and $ 21,168.
Now let's move from the resistance line as you can see the first resistance is $ 24768, if you can break it the next resistance will be $ 26,408 and $ 28,841.
Looking at the CHOP indicator, we can see that we have a lot of energy in the 1-day interval and the MACD indicator shows a local upward trend.

IOTA looks ready to break upward. Breakout target shown here in green. *not financial advice*. Iota may be a sleeper. Supposedly an ISO20022 compliant crypto.

BTC is moving in the channel. Two important zones!Hi everyone.
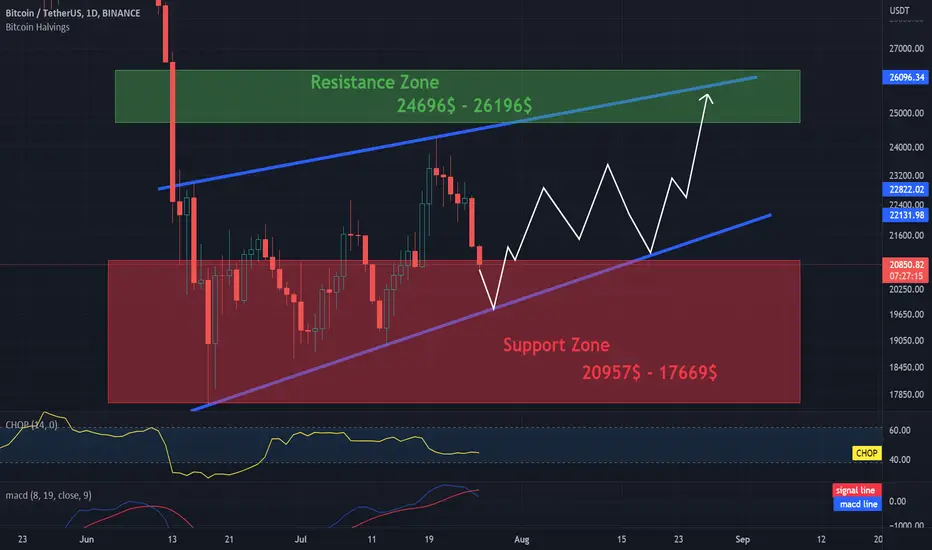
Today we have marked the channel with blue lines in which the BTC price is currently moving.
Then, with the help of the white arrow, I tried to set the course route for the next few days on which the BTC price may move.
As you can see, we have two important zones:
-the first of them is the support zone which is from $ 20,957 to $ 17,669, if the price drops below the designated zone, we can expect further drops to around $ 12,000.
- the second is the resistance zone, which we have from $ 24,696 to $ 26,196 breaking out of this zone may result in further increases above $ 30,000
Currently, the price is moving nicely sideways on our channel, going down to the top of the channel, which can be potentially used for short-term licks.
It is also worth paying attention to the CHOP indicator, which indicates that energy is slowly running out, and the MACD indicator, which indicates that we have entered a local downward trend.
However, please remember that this is not an investment advice.