MATIC / USDT 1D chartHello everyone, let's take a look at the 1D MATIC to USDT chart as you can see the price is moving above the local uptrend line.
Let's start by setting goals for the near future that we can consider:
T1 - $ 0.5245
T2 - $ 0.5490
T3 - $ 0.5853
and
T4 - $ 0.6616
Now let's move on to the stop loss in case of further market declines:
SL1 - $ 0.5103
SL2 - $ 0.4923
SL3 - $ 0.4773
SL4 - $ 0.4634
and
SL5 - $ 0.4436
Looking at the CHOP indicator, we can see that in the 1D range we have a lot of energy, and the MACD indicator indicates the beginning of a local uptrend.
1daychart

BTC maintains its bullish uptrendHello everyone, let's take a look at the BTC to USDT chart on a 1 day time frame. As you can see, the price is moving above the local uptrend line.
Let's start with the designation of the support line and as you can see the first support in the near future is $ 20,044, if the support breaks down, the next support is $ 19,768, $ 19504 and $ 19,114.
Now let's move from the resistance line as you can see, the first resistance is $ 20,643, if you can break it the next resistance will be $ 21,180 and $ 55,213,868.
Looking at the CHOP indicator, we can see that we have quite a lot of energy in the 1-day interval, while the MACD indicator shows a local upward trend.

ADA/USDT 1D INTERVALHello everyone, let's take a look at the 1D ADA to USDT chart as you can see the price is moving below the local downtrend line.
Let's start by setting goals for the near future that we can consider:
T1 - $ 0.4563
T2 - $ 0.4698
T3 - $ 0.4807
and
T4 - $ 0.4909
Now let's move on to the stop loss in case of further market declines:
SL1 - $ 0.4437
and
SL2 - $ 0.4213
Looking at the CHOP indicator, we can see that in the 1D range we have a lot of energy and the MACD indicator shows that we can enter an upward trend locally.

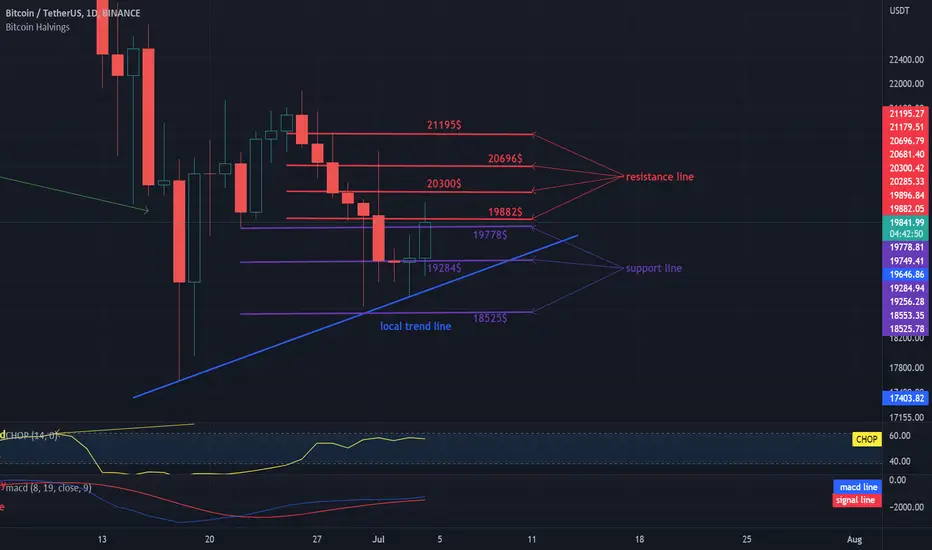
BTC on a 1-day intervalHello everyone, let's take a look at the BTC to USDT chart over the 1 day timeframe. As you can see, price is moving above the local uptrend line.
Let's start with the designation of the support line and as you can see the first support in the near future is $ 19,778, if the support breaks down, the next support is $ 19,284 and $ 18,525.
Now let's move from the resistance line as you can see the first resistance is $ 19,882, if you can break it the next resistance will be $ 20,300, $ 20,696 and $ 21,195.
Looking at the CHOP indicator, we can see that we have a lot of energy in the 1-day interval and the MACD indicator shows a continuation of the upward trend.
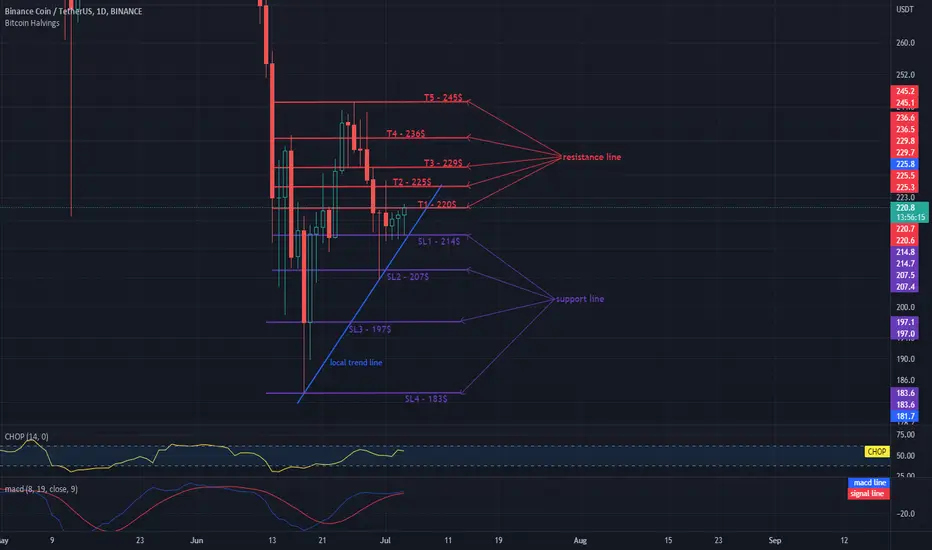
BNB / USDT 1DAYCHART TARGETS AND STOPLOSSHello everyone, let's take a look at the 1D BNB to USDT chart as you can see the price is moving above the local trendline.
Let's start by setting goals for the near future that we can consider:
T1 - $ 220
T2 - $ 225
T3 - $ 229
T4 - $ 236
and
T5 - $ 245
Now let's move on to the stop loss in case of further market declines:
SL1 - $ 214
SL2 - $ 207
SL3 - $ 197
and
SL4 - $ 183
Looking at the CHOP indicator, we can see that we have a lot of energy in the 1D range, while the MACD indicator shows a local upward trend.
BTC RETURNS AROUND $ 21,000Hello everyone, let's take a look at the BTC to USDT chart on a 1 day time frame as you can see the price is moving along the local uptrend line.
Let's start with the designation of the support line and as you can see the first support in the near future is $ 20,779, if the support breaks down, the next ones are $ 20168, $ 19,689 and $ 19,198.
Now let's move from the resistance line as you can see the first resistance is $ 21,151, if you can break it the next resistance will be $ 22,108 and $ 23,317.
Looking at the CHOP indicator, we can see that we have very little energy in the 1-day interval, while the MACD indicator shows that we have entered an upward trend.

ETH came back above $ 1,000Hello everyone, let's take a look at the 1 day ETH to USDT chart as you can see the price is moving below the downtrend line.
Let's start with the designation of the support line and as you can see the first support in the near future is $ 877, if the support breaks down, the next one is $ 685.
Now let's move from the resistance line as you can see the first resistance is $ 1173, if you can break it the next resistance will be $ 1361, $ 1522, $ 1674 and $ 1892.
Looking at the CHOP indicator, we can see that there is very little energy in the 1-day interval, but the MACD indicator shows a local upward trend.

QNT could bounce off the $214 area (.618 fib level)"IF" QNT goes lower, it could bounce at the .618 fib level area around $214. This would be a great scale in buy opportunity.

Will DOGE reverse the trend?Hello everyone, let's take a look at the DOGE to USDT chart on the 1 day timeframe as you can see the price is moving below the downtrend line.
Let's start with setting targets for the nearest future that we can take into account:
T1 = $ 0.05859
T2 = $ 0.06461
T3 = $ 0.06931
and
T4 = $ 0.0740
Now let's move on to the stop loss to keep in the event of further market declines:
SL1 = $ 0.05582
SL2 = $ 0.05441
SL3 = $ 0.05301
SL4 = $ 0.05118
and
SL5 = $ 0.04894
Looking at the CHOP indicator, we can see that in the 1-day interval the energy is slowly starting to bounce back, and the MACD indicator shows that we are in a downward trend, while the blue line is approaching the red one.

BTC rebounded from the first supportHello everyone, let's take a look at the BTC to USDT chart on the 1 day time frame, as you can see the price is still moving below the downtrend line.
Let's start with the line of support and as you can see the first support that has already bounced back once is $ 17,482, if the support breaks, the next ones are $ 11,754 and $ 8028.
Now let's move from the resistance line as you can see the first resistance is $ 21,101, if you can break it the next resistance will be $ 23,133, $ 24,912 and $ 26,605.
Looking at the CHOP indicator, we can see that there is no energy in the 1-day interval, and the MACD indicator confirms the downward trend.

BNB on the $ 200 borderHello everyone, let's take a look at the BNB to USDT chart on a 1 day time frame and as you can see the price is moving below the downtrend line.
Let's start with the designation of the support line and as you can see the first support where the price is currently at is $ 198, if the support breaks down, the next one is $ 173 and $ 145.
Now let's move from the resistance line as you can see the first resistance is $ 229, if you can break it the next resistance will be $ 250, $ 267 and $ 284.
Looking at the CHOP indicator, we can see that on the 1-day interval the energy slowly begins to spread and the MACD indicator shows a downward trend.

ETH below $ 1000Hello everyone, let's take a look at the ETH to USDT chart over the 1 day timeframe as you can see the price is moving below the downtrend line.
Let's start with the designation of the support line and as you can see the first support that has already bounced off $ 877, if the support is broken, the next one is $ 685
Now let's move from the resistance line as the first resistance is $ 1209, if you can break it the next resistance will be $ 1,361, $ 1,486, $ 1,614 and $ 1,791.
Looking at the CHOP indicator, we can see that energy has been used for the current 1-day decline, while the MACD indicator shows that we are in a downtrend.

BTC drops below the ATH from the previous bull marketHello everyone, let's take a look at the BTC to USDT chart on a 1 day time frame as you can see the price is moving under the downtrend line.
Let's start with the designation of the support line and as you can see the first support in the near future is $ 17,506, if the support breaks down, the next one is $ 11,781 and $ 8,177.
Now let's move from the resistance line as you can see the first resistance is $ 22,064, if you can break it the next resistance will be $ 23,972, $ 25,668 and $ 27,258.
Looking at the CHOP indicator, we can see that on the 1-day interval, each energy recovery gives another price drop, and the MACD indicator shows a downward trend.

The BTC price remains above the ATH from the previous bull markeHello everyone, let's take a look at the BTC to USDT 1 day chart as you can see the price is moving below the downtrend line.
Let's start with the designation of the support line and as you can see the first support is $ 19,928 equals ATH from the previous bullish, if the support breaks down, the next one is $ 17,423.
Now let's move from the resistance line as you can see the first resistance is $ 22,999, if you can break it the next resistance will be $ 24,763, $ 26,243, $ 27,722 and $ 29,827.
Looking at the CHOP indicator, we can see that we have very little energy in the 1-day interval, and the MACD indicator shows that we are still in a downward trend.

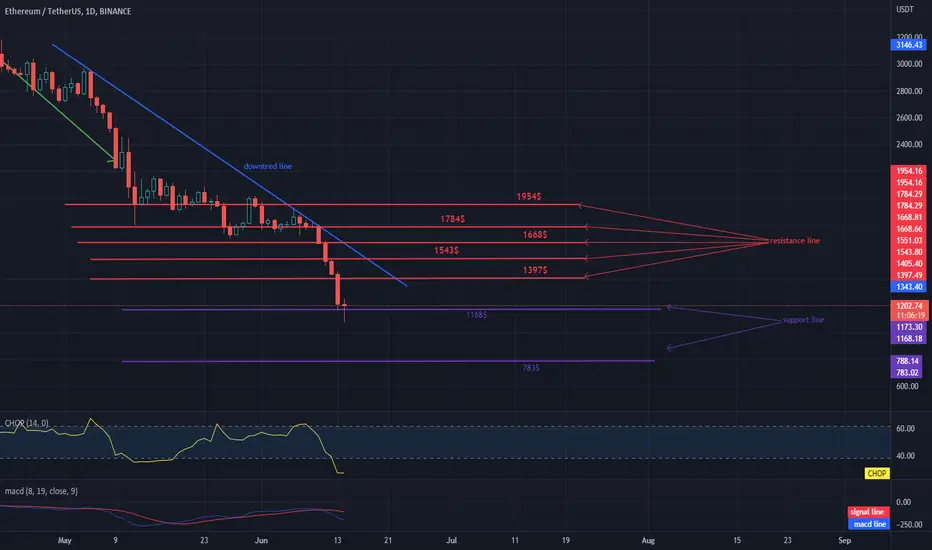
ETH with the support ofHello everyone, let's take a look at the ETH to USDT chart on the 1 day time frame as you can see the price is moving below the downtrend line.
Let's start with the designation of the support line and as you can see the first support from which the price has already rebounded $ 1168, if the support is broken, the next one is $ 783
Now let's move from the resistance line as you can see the first resistance is $ 1,397, if you can break it the next resistance will be $ 1,543, $ 1,668, $ 1,784 and $ 1,954.
Looking at the CHOP indicator , we can see that the energy has been used for the current decline in the 1-day interval, while the MACD indicator shows that we are in a downward trend.
BTC IN THE AREA OF ATH FROM THE PREVIOUS BULL MARKETHello everyone, let's take a look at the BTC to USDT chart on a 1 day time frame as you can see the price is moving below the downtrend line.
Let's start with the designation of the support line and as you can see the first support is $ 19,928 - ATH from the previous bullish, if the support breaks down, the next one is $ 17,397.
Now let's move from the resistance line as you can see the first resistance is $ 23,603, if you can break it the next resistance will be $ 25,210, $ 26,651, $ 27,980 and $ 29,975.
Looking at the CHOP indicator, we can see that the energy has been exhausted on the 1-day interval, and the MACD indicator shows that we are continuing the downward trend.

Dot as the whole market reacts with declinesHello everyone, let's take a look at the DOT to USDT chart on the 1 day time frame as you can see the price is moving under the downtrend line.
Let's start with the line of support and as you can see the first support is $ 7.08, if the support breaks down, the next one is $ 4.56.
Now let's move from the resistance line as you can see the first resistance is $ 7.68, if you can break it the next resistance will be $ 8.46, $ 9.12 and $ 9.79.
Looking at the CHOP indicator, we can see that the energy has been used on the 1-day interval, and the MACD indicator shows a downward trend.

ETH bounced off support on $ 1168Hello everyone, let's take a look at the ETH to USDT chart on the 1 day time frame as you can see the price is moving below the downtrend line.
Let's start with the designation of the support line and as you can see the first support from which the price has already rebounded $ 1168, if the support is broken, the next one is $ 783
Now let's move from the resistance line as you can see the first resistance is $ 1,397, if you can break it the next resistance will be $ 1,543, $ 1,668, $ 1,784 and $ 1,954.
Looking at the CHOP indicator, we can see that the energy has been used for the current decline in the 1-day interval, while the MACD indicator shows that we are in a downward trend.

BTC is close to ATH from the previous bull marketHello everyone, let's take a look at the BTC to USDT chart on a 1 day time frame. As you can see, the price is moving below the downtrend line.
Let's start with the designation of the support line and as you can see the first support in the near future is $ 23,244, if the support breaks, then we have the place of the previous ATH, it is worth remembering that historically BTC never fell below ATH from the previous bull market.
Now let's move from the resistance line as you can see the first resistance is $ 24,821, if you can break it the next resistance will be $ 26,126, $ 27,268, $ 28,356 and $ 29,933.
Looking at the CHOP indicator, we can see that the energy has been used in the 1-day interval, while the MACD indicator indicates a downward trend.

BTC in the downtrendHello everyone, let's take a look at the BTC to USDT chart on a 1 day time frame as you can see the price is moving under the downtrend line.
Let's start with the designation of the support line and as you can see the first support in the near future is $ 26,702, if the support breaks down, the next one is $ 23,042.
Now let's move from the resistance line as you can see the first resistance is $ 29,925, if you can break it the next resistance will be $ 31,862 and $ 33,413 and $ 35,049.
Looking at the CHOP indicator, we can see that there is still a lot of energy in the 1-day interval, while the MACD indicator shows a downward trend.

Will BTC continue its downward trend?Hello everyone, let's take a look at the BTC to USDT 1 day chart as you see the price is moving below the downtrend line.
Let's start with the designation of the support line and as you can see the first support in the near future is $ 27,902, if the support breaks down, the next one is $ 26,711 and $ 23,185.
Now let's move from the resistance line as you can see the first resistance is $ 29,856, if you can break it the next resistance will be $ 31,762, $ 33,429 and $ 34,954.
Looking at the CHOP indicator, we can see that we have a lot of energy in the 1-day interval, while the MACD indicator shows that we have entered a downward trend.

BNB is fighting the resistance!Hello everyone, let's take a look at the BNB to USDT chart over the 1 day timeframe as you can see the price is moving above the local trendline.
Let's start with the designation of the support line and as you can see the first support in the near future is $ 278, if the support breaks down, the next one is $ 264 and $ 244.
Now let's move from the resistance line, as you can see, the first resistance that price is currently struggling with is $ 289, if you can break it, the next resistance will be $ 298, $ 306, $ 313 and $ 324.
Looking at the CHOP indicator, we can see that we still have a lot of energy in the 1-day interval, while the MACD indicator shows that we are in a local downward trend.

BTC right on the support!Hello everyone, let's take a look at the BTC to USDT chart on the 1 day time frame as you can see the price is moving in the channel indicated.
Let's start with the designation of the support line and as you can see the first support in the near future is $ 30,191, if the support breaks down, the next ones are $ 29,604 and $ 28,912 and $ 17,950.
Now let's move from the resistance line as you can see the first resistance is $ 30,448, if you can break it the next resistance will be $ 30,836, $ 31,207, $ 31,730 and $ 32,422.
Looking at the CHOP indicator, we can see that we still have a lot of energy in the 1-day interval, while the MACD indicator shows that despite the dynamic movements between $ 32,000 and $ 29,000, we are in the local upward trend.
