Massive falling wedge/h&s on bitcoin. Which way is more likely?We can see that bitcoin is inside a massive falling wedge on the daily chart, and like usual with most bullish falling wedge patterns there also hides within it a bearish head and shoulder pattern as well. I have charted the breakdown target for the head and shoulder pattern as well as the breakout target for the falling wedge here and it’s pretty obvious to me which outcome seems more realistic. Though ultimately the break up from the falling wedge seems the most realistic, price action could certainly do a fakeout breakdown and dip below the neckline of the h&s (aka the bottom trendline of the wedge) before actually slingshotting upwards to break up from the wedge. I see any such move as that as a buying opportunity. *not financial advice*
1daychart

GMT is based on 1 stop lossHello everyone, let's take a look at the GMT to USDT chart over the 1 day timeframe. As you can see, the price is moving below the local downtrend line.
Let's start with determining the stop loss that we should take into account in the coming days. As you can see, we have a fixed 3 stoploss:
SL1 - $ 0.997 where the price is currently located.
SL2 - $ 0.907
and
SL3 - $ 0.798
Now let's move on to the targets that we can take into account, as you can see the targets are at the price:
T1 - $ 1,027,
T2 - $ 1,165,
and
T3 - $ 1,279
Looking at the CHOP indicator, we can see that in the 1-day interval we still have some energy for further moves, and the MACD indicator shows that we are following the local upward trend.

BTC a lot of energy in the 1D intervalHello everyone, let's take a look at the BTC to USDT chart on a 1 day time frame. As you can see, price is moving above the local uptrend line.
Let's start with the designation of the support line and as you can see the first support in the near future is $ 29,288, if the support breaks down, the next one is $ 28,405.
Now let's move from the resistance line as you can see the first resistance is $ 30,029, if you can break it the next resistance will be $ 30,484 and $ 30,848, $ 31,186 and $ 31,745.
Looking at the CHOP indicator, we can see that we have a lot of energy in the 1-day interval, while the MACD indicator shows that we are in a local upward trend.

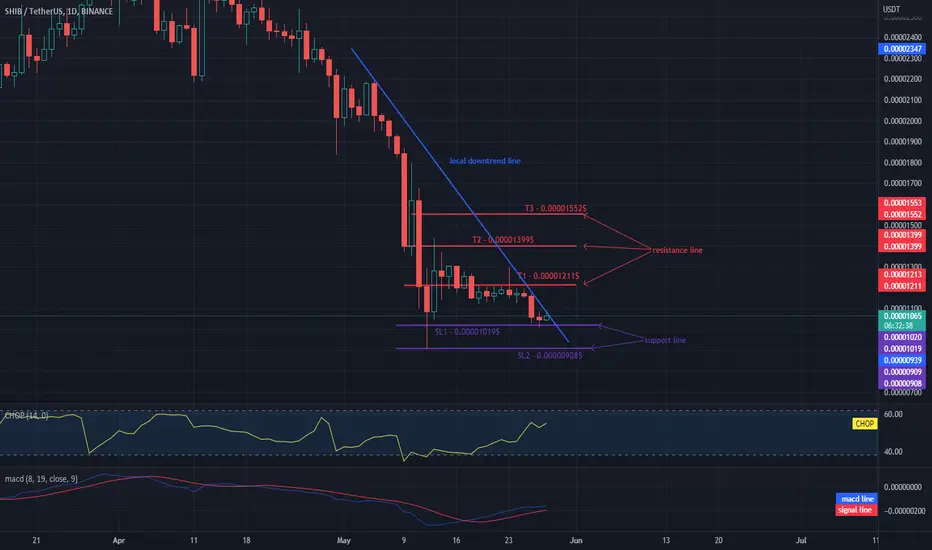
Will SHIB recover from declines?Hello everyone, let's take a look at the SHIB to USDT chart on a 1 day time frame. As you can see, the price is moving below the local downtrend line and is approaching its side exit.
It is worth starting with setting a stop loss, which we should take into account in the coming hours. As you can see, we chose 4 stop losses:
SL1 - $ 0.00001170,
SL2 - $ 0.00001109,
Now let's move on to defining the goals of price and as you can see, the first is at the T1 level - $ 0.00001211, which the price is currently struggling with, the next is at the T2 - $ 0.00001399 level, the next is T3 - $ 0.00001552.
Looking at the CHOP indicator, we can see that we collect more and more energy in the 1-day interval, and the MACD indicator does not indicate a downward trend.
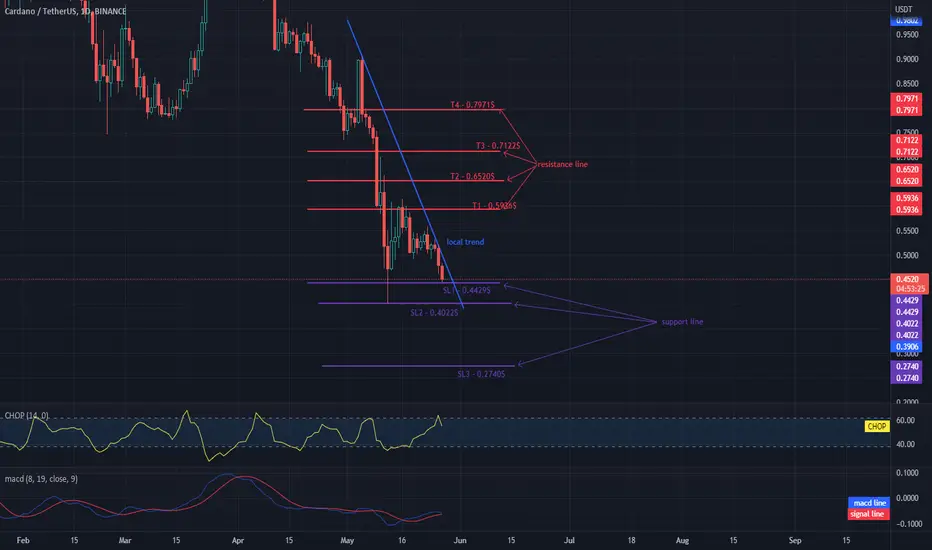
The ADA is based on the first stop lossHello everyone, let's take a look at the ADA to USDT chart on a 1 day time frame. As you can see, the price is moving below the local downtrend line.
Let's start with the designation of the support line and as you can see the first support in the near future is SL1 - $ 0.4429 which is currently in price, if the support breaks, the next one is SL2 - $ 0.4022 and SL3 - $ 0.2740.
Now let's move from the resistance line, as you can see, the first resistance is T1 - $ 0.5936, if you manage to break it, the next ones will be T2 - $ 0.6520 and T3 - $ 0.7122 and T4 - $ 0.7971.
Looking at the CHOP indicator, we can see that in the 1-day interval some energy has been used to reduce the price, but we still have a lot of energy that can be used in the coming days.
BTC has accumulated a lot of energy in the 1D intervalHello everyone, let's take a look at the BTC to USDT chart over the 1 day timeframe. As you can see, the price is moving below the downtrend line.
Let's start with the designation of the support line and as you can see the first support in the near future is $ 28,497, if the support breaks down, the next one is $ 26,606.
Now let's move from the resistance line as you can see the first resistance is $ 29,196, if you can break it the next resistance will be $ 31,763, $ 33,367 and $ 34,914.
Looking at the CHOP indicator, we can see that nha in the 1-day range has a lot of energy that we can use in the near future, although the MACD indicator indicates that we should enter an uptrend.
Be especially careful and use stop loss when trading.

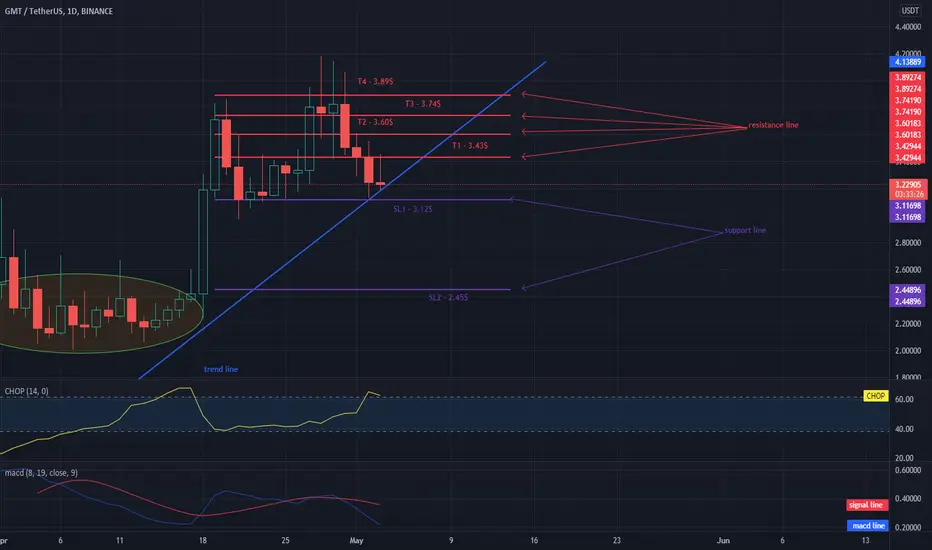
GMT has a price adjustment but has collected a lot of 1D energyHello everyone, let's take a look at the 1D GMT to USDT chart. As you can see, price is moving above the local uptrend line.
Let's start with the designation of the support line and as you can see the first support in the near future is SL1 - $ 3.12, if the support breaks, the next one is SL2 - $ 2.45. It is worth choosing at least one stop loss.
Now let's move from the resistance line, as you can see, the first resistance is T1 - $ 3.43, if you can break it, the next resistance will be T2 - $ 3.60 and T3 - $ 3.74 and T4 - $ 3.89.
Looking at the CHOP indicator, we can see that on the 1D m interval, we have a lot of energy for the next move, while the MACD indicator shows a downward trend because the blue line is below the red one.
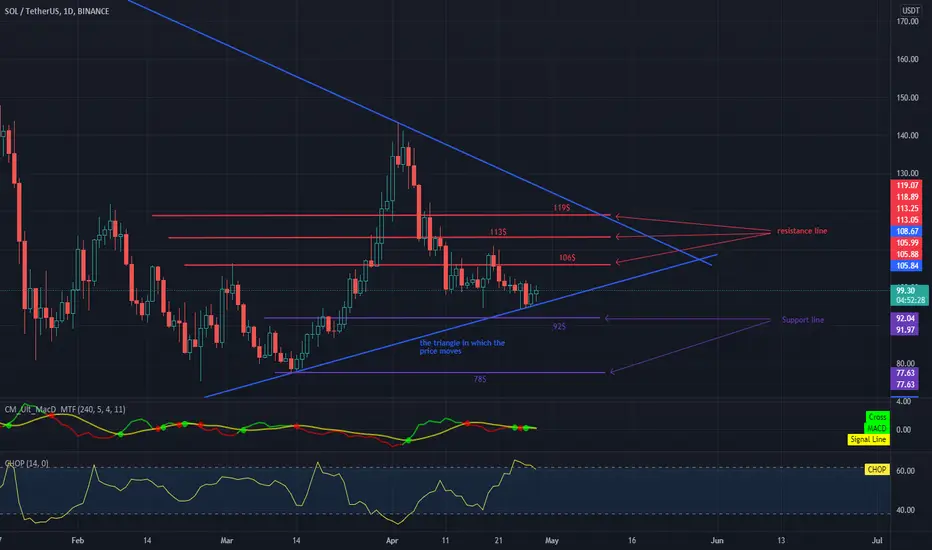
SOL collected a lot of energy in the 1D interval.Hello everyone, let's take a look at the 1D SOL to USDT chart. As you can see, price is moving above the local uptrend line.
Let's start with the designation of the support line and as you can see the first support in the near future is $ 92 if the support is broken, the next $ 78.
Now let's move from the resistance line, as you can see the first resistance is $ 106 which price is currently struggling with, if it manages to break it, the next resistance will be $ 113 and $ 119.
Looking at the CHOP indicator, we can see that we have a lot of energy in the 1D interval, we can expect more traffic in the coming days.
STG / USDT right on the support!Hello everyone, let's take a look at the 1D STG to USDT chart. As you can see, the price is moving below the downtrend line.
Let's start with the designation of the support line and as you can see the first support that the price is currently based on is $ 1.20, if the support breaks down, the next ones are $ 0.90 and $ 0.43.
Now let's move from the resistance line as you can see the first resistance is $ 1.94, if you can break it the next resistance will be $ 2.39 and $ 2.78.
Looking at the CHOP indicator, we can see that in the 1D interval most of the energy has been used, but it is worth paying attention to the MACD indicator which shows that we are on the green line, which indicates an upward trend.

BTC returns to around $ 40,000 !Hello everyone, let's take a look at the BTC to USDT chart on a 1 day time frame. As you can see, the price moves in the uptrend channel marked with blue lines.
Let's start with the designation of the support line and as you can see the first support in the near future is $ 38,782, if the support breaks down, the next one is $ 36,174 and $ 32,893.
Now let's move from the resistance line, as you can see, the first resistance BTC is heading towards is $ 40,170, if you can break it, the next resistance will be $ 41,727 and $ 42,905.
Looking at the CHOP indicator, we can see that in the 1-day interval we have a lot of energy that can be used in the coming days, while the MACD indicator shows a continuation of the upward trend.

BTC rebound possible after yesterday's correctionHello everyone, let's take a look at the BTC to USDT chart on a 1 day timeframe. As you can see, the price is moving in the uptrend channel marked by the blue lines.
Let's start by marking the resistance line, as you can see, the first resistance is $ 41,132, if you can break it, the next resistance will be $ 42,705, another resistance at $ 44,120 and $ 45,379.
Now let's move on to the designation of the support line and as you can see the first support where the price is currently at is $ 39,244, if the support breaks down, the next one is $ 38,143 and another one at $ 37,003.
Looking at the CHOP indicator, we can see that in the 1-day interval, despite yesterday's correction, we have a lot of energy for a new move. On the other hand, the MACD indicator shows that we are still in an uptrend.

BTCUSDT T.F 1 Day, Channel + Bullish DivergenceChannel formation has been found in 1 Day time frame of BTCUSDT and the Bullish Divergence can also be seen. Which can result in the Bullish Trend.

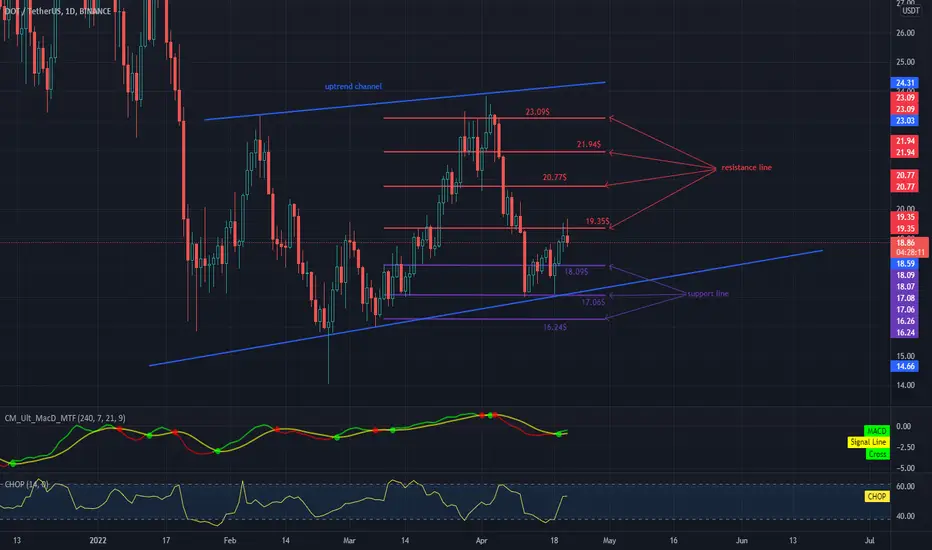
DOT possible breakout?Hello everyone, let's take a look at the DOT to USDT chart over the 1 day timeframe. As you can see, the price is moving in an uptrend channel marked with blue lines.
Let's start by determining the support lines with the Trend-Based Fib Extension tool and as you can see, the first support in the near future is $ 18.09, if the support breaks down, the next ones are $ 17.06 and $ 16.24.
Now let's move from the resistance line as the first resistance is $ 19.35, if you can break it the next resistance will be $ 20.77 and $ 21.94 plus $ 23.09.
Looking at the CHOP indicator, we can see that in the 1-day range we are starting to gain more and more energy, and the MACD indicator shows that an uptrend has started.
rune great longbig liquidity zone we are in now you can see it goes back a couple weeks now. resistance turned into support. this looks like a gigantic falling wedge to me we just broke and are came back down to accumulate more. 4 hr chart i see a massvie cup and handle. low rsi and mac d finally turning white on the 1 day makes me believe we are in a re test liquidity grab stage before we moon. next couple days weeks should be massive upside in my opinion.

Update on Monero double bottom Looks like Monero is gonna trigger this double bottom that I posted an idea on last week or so. $240 is the target *not financial advice*

Miners inching closer to triggering this double bottom.Looks like if this triggers it should head to $240. Luna has already reached its double bottom measured move target and the market as a whole has only recently switched from the downtrend correction back to an uptrend s this all increases the probability of this double bottom on mongers both triggering and reaching its measured move target. Of course yas always you should always wait for confirmation of the breakout. I don’t own any modern but couldn’t resist charting this obvious double bottom scenario. *not financial advice*

XMR (Monero) Swing Long 30% Profit For those who have entered this $XMR trade, congrats! I have now added 7 TP Points labeled next to the Fibonacci levels. Of course, you book some profits now if you'd like and do expect a little price movement to retest previous levels.
I suggest that you do move your SL tighter to the entry or even in front of the entry zone.
The 20 EMA has crossed over the 50 EMA on the daily chart and with this momentum, we should see the 20 EMA breakthrough over the 200 EMA which would indicate a price movement up to the take-profit zones I have placed on this updated chart!
I will reiterate, expect the price action to come back down a little before we continue to take off.

ETHUSD above the necklines of 3 very bullish patternsNot only is ETHUSD’s price action currently above the neckline(tan trendline) of a descending inverse head and shoulder. It’s also above the neckline of 2 different double bottom patterns. (Green and yellow horizontal trendlines). The right shoulder of the inverse head and shoulder pattern is actually also a valid double bottom pattern on the 4hr timefram(daily time frame shown here instead of 4hr). Also, The head of the inverse head and shoulder and the right shoulder combined also create somewhat of an Adam and Eve double bottom, similar to the one playing out currently on cardano. We are only just now having price action poke its head above the inv h&s neckline though and since, as is usually the case, patterns rarely trigger their breakout on the first break of the neckline we could still see price action retrace below this neckline before the real breakout occurs. There’s always a chance this is the real breakout too though so the best thing to watch for on the initial neckline break is whether or not we getting any sort of major bullish impulse in the volume to help confirm an official breakout. I cou;d see a breakout fakeout going as high as to test the 200ma then get rejected and fall back below the neckline, before it finally has the break break above it. So we must remain vigilant. In the long run i think these patterns will confirm their bullish breakout eventually but am not yet sold on the current 1 day candle being the breakout candle just yet.

ZECUSD attempting double bottom breakout. $196 possible target. Luna completed it’s double bottom breakout with ease, and considering we only just recently shifted back into an uptrend I’m assuming this double bottom as well as several other cryptos double bottom patterns are likely to trigger as well. Of course, as always we should wait for confirmation of a bullish breakout from this pattern, not go off assumptions, and currently the price action is finding resistance upon testing the double bottom neckline. Once it flips it to solidified support and then we see a nice impulse of bullish volume afterwards we can be more confident that it will validate the breakout. If so the target is $196. *not financial advice* Until then this idea will have to be listed as neutral despite myself having a bias towards the bullish outcome.

Head and shoulders on 1D chart BTCThere is an inverted head and shoulders on 1D BTC chart.
Any thoughts about thay?

Current falling wedge on the 1day btcusd chart.Based on todays wick we may have just retested the top trendline of the wedge. However there is a chance this yellow trendline is a more valid top trendline and that we are already up above the wedge. I have included both just in case. Ultimately if we were to break above the green trendline here or in the next few days the measured move of that breakout would be somewhere between 62 and 64k. *not financial advice* Let’s see what happens.

GBPJPY Trendline + Support 1Di am showing my analyse of GBPJPY. We are in downtrend and i am waiting for breakout of an trendline, I am bullish on this, because my view is, that it will don´t cross an support. RSI is low and we will get a lot of reports for GBPJPY.
NOT FINANCIAL ADVICE
if you admire my analyse, please hit the "like" button, stay safe.

Previous AVAXUSD chart w/the potential Descending triangle addedNot 100% confident about this descending triangle pattern yet. But if it is indeed valid then the price action should head towards the 158-160 target before too long with some resistance on the way there at around $130 or so depending on where we retest this ascending yellow trendline at.
