USDCAD 1D ORB-NR4 STRATEGYORB = Opening Range Breakout pattern
Nr4 = 4TH Candle's daily range is smaller than the previous 3 days.
*Note: The 4th day doesn’t necessarily need to be an inside day, it only needs to have its daily range smaller than the previous 3 days.
What if we told you that 40% of the time the first trading hour can tell you what is the high and the low of the day? If you know that you can define a trading system around it, you can manage your risk and set your targets.
Step #1: Wait until you can spot a bar that has its daily range smaller than the previous three days
The first rule requires you to have the patience until the Nr4 pattern develops on the chart. When we have a daily trading range that is narrower than the previous trading ranges, it means that the price is contracting.
Based on our backtesting results, we have found out that there is a high probability of a trend move after you spot this type of contraction. This is kind of a general rule because the markets move from periods of contractions to periods of expansion.
This is the reason why this short-term price pattern is so powerful.
Step #2: Mark the High and the Low of the 4th day and switch to the 1 hour time frame
Our trade is taken the next day after the Nr4 pattern showed up. In order to have a clear view of the short-term price action, we need to switch our focus to the 1-hour time frame. Before you switch the time frames make sure you mark on your chart the high and the low of the 4th day.
Step #3: Buy/Sell only if the breakout of the Nr4 high happens during the first 5 trading hours.
We use the Opening Range Breakout technique to time the market and have an effective trade entry. The ORB is even more profitable if it occurs after inside days that have a smaller trading range than the previous 3 days.
Trades based on the ORB – Nr4 pattern will show you a profit instantly.
Now, if the trade is not showing you a profit right away, then your trade becomes more vulnerable. As a general rule, if after the first trading hour your trade is not in the green, you can safely close the trade at the market.
Of course, you can only do that if your stop loss hasn’t been triggered in the meantime.
Step #4: Place your protective Stop Loss below the Nr4 day low or ATR x 1.5
You can hide your protective stop loss below the Nr4 day low. Alternatively, you can place your stop loss below the current day low as this will give you a better risk to reward ratio.
The ORB - Nr4 pattern tends to precede strong trend day activity, so your stop loss should be rarely hit. Both of these patterns can be traded individually, but when combined, they tend to produce even more powerful trades.
Step #5: Take profit at the close of the first 1-hour bearish candle
Our take profit strategy is fairly easy and slightly modified from the original strategy highlighted in the “Day Trading with Short Term Price Patterns and Opening Range Breakout” book written by Toby Crabel.
Although the ORB pattern tends to lead to trend trading days, we’re more conservative and want to quickly take profits. So as soon as the first bearish candle shows up, we close the trade and enjoy our daytrade profits.
Alternatively, you can keep the trade open until the end of the day if you want to extrapolate more profits from the cryptocurrency market.
OR use the ATR x 1 = TP
1h

SPY 15-Minute ChartThe third price target was hit on the market open from yesterday's 1-Hour chart analysis due to the gap up at the open. Let's see how much farther the bulls want to take it.


EURUSD 1H Volume Zone Oscillator Strategy Long TradeInstall Volume Zone Oscillator & 50sma to your chart.
Find in Indicator Search (type VZO) - Public Library - GMAN indicator
Change levels from 30 to 40
Change 0 level & VZO line to blue colored line
If price is above 50sma bullish bias for long trades, below then short trades.
How to Use Volume Zone Oscillator?
We’re going to reveal how to interpret the volume zone readings.
A move above the centerline will give us a bullish reading. And, a move below the centerline will give us a bearish reading.
The most important volume zones are "+60", "+40", “0", “-40", and "-60".
Additionally, traders also use the “+5”, and “-5” volume zone readings.
Here is how to use VZO in your trading decisions.
Here are the four main volume zones to keep an eye on:
When VZO rises above and maintains the 5% level, it marks the early phase of an uptrend. Conversely, when VZO falls below the -5% level, it marks the early phase of a downtrend.
Oscillations between 5% and 40% volume zones mark a bullish trend zone. Conversely, a reading between -5% and -40% volume zones mark a bearish trend zone.
An overbought signal is generated when we have a reading above the 40% volume zone. Conversely, an oversold signal is generated when we have a reading below the -40% volume zone.
Reading above the 60% volume zone is an extremely overbought reading that can signal a bearish reversal. While a reading below the -60% volume zone is an extremely oversold reading that can signal a bullish reversal.
Let’s see what trading tactics we can use with the volume-based indicators.
During bullish trends, volume rises with rising prices. The same is true in reverse for bearish trends.
This is basic 101 uptrend volume psychology.
For this purpose, let’s examine again the EUR/USD chart.
We’re in a clear, strong bullish trend. The VZO is above the centerline signaling buying pressure. The volume zone reading between 5% and 40% also indicate a sustained uptrend zone. A buy signal is generated when we cross above the centerline.
The EUR/USD chart above demonstrates how during bullish trends, the VZO has the tendency to stay in the higher volume zone fluctuating between 0 and 40.
This is a good method to identify the direction of the trend and trade with the trend.
Go to our TSG website - then blog - find volume oscillator article for complete strategy instructions.

RAMAN 2 MONTHS 2 SUCCESS DAILY TRADING STRATEGY SHORT TRADEDay Chart
New Daily High was not made.
Previous Day closed Bearish.
New Current Trading Day has a Bearish bias.
30m Chart
Bullish Pullback has an ascending trendline drawn underneath it.
1st Entry is a 30m candle close below trendline
Fractal Low is at 1.2900
2nd Entry is a 30m candle close below support level
1st Take Profit is at support level of 1.2870
2nd Take Profit is at support level of 1.2825
SL @ 1.2955


GBPUSD 1H SHORT 125 PIPSGBPUSD
1H
SHORT
125 PIPS
DOWN TREND
HEAD AND SHOLDER
PRICE 1.28470
SL 1.29040
TP 1.27200


GBPUSD 1H MASS INDEX TRADING STRATEGYFind Mass Index Indicator in TradingView under Public Library - Mass Index/HPotter
Add to chart Stochastic Indicator default settings
Mass Index Trend Reversal Strategy
Mass index trend reversal is a powerful strategy to detect trend changes. You can find money-making trading opportunities that evade most traders. We use two forex reversal indicators to develop this reversal trading strategy:
The obvious mass index tool
Stochastic indicator used to determine the directional signal.
Both of these forex reversal indicators will protect you from false reversal signals. As we already mentioned we use the trend reversal trading strategy in combination with the price. The secret to trading trend reversal like a professional trader is to combine the price with other technical tools.
That’s exactly what we try to accomplish here. As this will help you spot high probability bullish and bearish trend reversal signals.
Now you’re wondering:
“How do I combine all these pieces together to actually identify trend reversal trading setups that work?”
Knowing what indicators to use and what is the Best Combination of Technical Indicators can dramatically improve your chart reading skills. If you use the wrong technical indicators, this can lead to inaccurate price interpretation and subsequently to bad trading decisions.
The mass index trend reversal strategy can be broken down into a three-step process:
Identify the reversal bulge on the mass index indicator.
Identify the prevailing trend prior to the reversal bulge.
Use the Stochastic indicator to generate a directional signal.
Here is how to actually do it:
Step #1 Identify the Prevailing Trend
Always zoom out to have a clear picture of what is the prevailing trend.
The previous GBP?USD chart zoomed out revealed that the prevailing trend is bearish.
Naturally, we assume that a bullish reversal signal will follow. The trading bias is upwards once we correlated the mass index reading with the price action.
Generally, we also want to confirm that the price is expanding and that we’re indeed in the last stage of a trend. This information is revealed in the price chart. We simply compare the most recent candlestick bars with the previous ones.
Are the candlesticks expanding?
If yes, that’s what we need to see.
The bigger the candles are, the higher the change that a bigger trend reversal is going to develop.
Step #2 Identify the reversal Bulge
The mass index reversal bulge was already revealed at the beginning of this trend reversal guide.
The mass index must first go above the 27 level and then it needs to be followed by a drop back below the 26.5 level.
There is a high degree that the market will reverse from here.
That’s pretty much it. There is nothing we can add here as everything else comes down to the relationship between the price and the mass index reading.
So far, so good.
Huston, we have a problem.
The mass index indicator is prone to also produce large moves by the time the mass index line it takes to drop back below the 26.5 level. This can create the false illusion of a trend. But, in reality this can be a simple trend pullback.
We’re going to teach you another great trick to use to capture trend retracements and pullbacks using the mass index.
Let me explain…
A picture is worth a thousand words.
In this case, we’re effectively trend trading.
See below the last step before pulling the trigger:
Step #3 Use the Stochastic for Trigger
We have established our trading bias and we have a mass index bullish reversal signal.
Next, is to wait for the stochastic indicator to provide us with a bullish signal to trigger our long trade.
The classical stochastic crossover is the most popular crossover trade signal. The stochastic bullish crossover occurs right after the mass index dropped below the 26.5 level.
This is our signal that the momentum has shifted to the upside and the trend is ready to reverse.
So, you can go ahead and deploy your soldiers aka the money to capture more soldiers.
There are always going to be pros and cons between reversal trading vs. trend trading.
But what type of trader should you become?
Should you be a Reversal Trader or Trend Trader?
Each trading style has its own merits and proper use. While trend trading gives you the advantage of trading in the direction of the prevailing momentum, reversal trading gives you the advantage to buy low, sell high. But, if you don’t know what is your trading style, the chance of succeeding as a reversal trader or as a trend trader is very slim.
If you’re searching for a trend following strategy that will turn your trading around make sure you check the MACD Trend Following Strategy.
You need to develop your strategy to accommodate reversal trading if you want to catch tops and bottoms. There is no right or wrong between trend trading vs. reversal trading.
The short answer is that you should be trading in a way to fit your own personality.
While the trend is your friend, not many have the discipline to stay in a trade riding a trend. The fact is reversal trading can be a quick way to make some profits. The advantage of reversal trading is that you can be in and out of the trade very fast.
Learn more about how to identify a Forex trend: Identifying Trends through Synchronization.
Final Words – Mass Index Chart
The Mass index indicator allows traders to predict trend reversals that other technical indicators may fail to notice. Using the mass index reversal bulge you can catch market tops and bottoms with deadly accuracy. You don’t have to be scared to try catching a falling knife. Most prominent hedge fund managers engage in reversal trading because it provides trade setups with high risk to reward ratios.
You can always keep a mass index chart on the sideline to check if your favorite market is about to end a big trend cycle. The secret to trading trend reversal like a pro is to simply stop being scared of engaging in this type of trade activity. Just make sure you use wise risk management strategies before you put at work your hard-earned money.
PM me if you want the link to the actual complete mass index strategy


XRPUSD 1H EMA CROSSOVER STRATEGYStep #1: Plot on your chart the 20 and 50 EMA
The first step is to properly set up our charts with the right moving averages. We can identify the EMA crossover at the later stage. The exponential moving average strategy uses the 20 and 50 periods EMA.
Most standard trading platforms come with default moving average indicators. It should not be a problem to locate the EMA either on your MT4 platform or Tradingview.
Step #2: Wait for the EMA crossover and for the price to trade above the 20 and 50 EMA.
The second rule of this moving average strategy is the need for the price to trade above both 20 and 50 EMA. Secondly, we need to wait for the EMA crossover, which will add weight to the bullish case.
We refer to the EMA crossover for a buy trade when the 20-EMA crosses above the 50-EMA.
By looking at the EMA crossover, we create an automatic buy and sell signals.
Since the market is prone to false breakouts, we need more evidence than a simple EMA crossover. At this stage, we don’t know if the bullish sentiment is strong enough to push the price further after we buy to make a profit.
To avoid the false breakout, we added a new confluence to support our view. This brings us to the next step of the strategy.
Step #3: Wait for the zone between 20 and 50 EMA to be tested at least twice, then look for buying opportunities.
The conviction behind this moving average strategy relies on multiple factors. After the EMA crossover happened, we need to exercise more patience. We will wait for two successive and successful retests of the zone between the 20 and 50 EMA.
The two successful retests of the zone between 20 and 50 EMA give the market enough time to develop a trend.
Never forget that no price is too high to buy in trading. And no price is too low to sell.
Note* When we refer to the “zone between 20 and 50EMA,” we actually don’t mean that the price needs to trade in the space between the two moving averages.
We just wanted to cover the whole price spectrum between the two EMAs. This is because the price will only briefly touch the shorter moving average (20-EMA). But this is still a successful retest.
Now, we still need to define where exactly we are going to buy. This brings us to the next step of the strategy.
Step #4: Buy at the market when we retest the zone between 20 and 50 EMA for the third time.
If the price successfully retests the zone between 20 and 50 EMA for the third time, we go ahead and buy at the market price. We now have enough evidence that the bullish momentum is strong to continue pushing this market higher.
Now, we still need to define where to place our protective stop loss and where to take profits. This brings us to the next step of the strategy.
Step #5: Place the protective Stop Los 20 pips below the 50 EMA
After the EMA crossover happened, and after we had two successive retests, we know the trend is up. As long as we trade above both exponential moving averages the trend remains intact.
In this regard, we place our protective stop loss 20 pips below the 50 EMA. We added a buffer of 20 pips because we understand we’re not living in a perfect world. The market is prone to do false breakouts.
Step #6: You choose TP or Take Profit once we break and close below the 50-EMA
In this particular case, we don't use the same exit technique as our entry technique, which was based on the EMA crossover.
If we waited for the EMA crossover to happen on the other side, we would have given back some of the potential profits. We need to consider the fact that the exponential moving averages are a lagging indicator.
The exponential moving average formula used to plot our EMAs allow us to still take profits right at the time the market is about to reverse.
Note** The above was an example of a BUY trade. Use the same rules – but in reverse – for a SELL trade. However, because the market goes down much faster, we sell on the 1st retest of the zone between 20 and 50. After the EMA crossover happened.


SELL bitcoin $8555 - $8645 Limit SELL Orders from $ 8555 - $8645
Reason 4 Trade: ewCount | RSI Div. | MACD Div.(Sell Signal) | Just Bcuz ))
TP: $ 8313 - $ 8300
Risk: 8/10
1% MAX Position Allocation
7x leverage (Cross leverage)
**Always USE Protection** ))
Stop Loss : ABOVE $8750

BTCUSD 4H 1H DESCENDING CHANNEL BEARISH BREAKOUTStep#1: Draw a Price Channel if you are able to see at least two Higher Highs and Higher Lows. The Price Channel pattern is drawn by connecting the highs and lows.
During this stage, we’re looking for distinctive price action that can be contained within two parallel lines. These lines will ultimately form the Price Channel Pattern.
If you’re able to spot two consecutive swing highs followed by two consecutive two higher lows you simply connect these points using the Price Channel tool.
The majority of the trading platforms has incorporated into their default trading tools the Price Channel indicator.
Step #2: Wait for a Swing High to fail to reach the top of the Price Channel pattern.
In the case of an ascending or upward Price Channel pattern the first warning signal that the price will fail to trade within the boundaries set by the Price Channel Pattern presents itself when the last swing high point fails to reach the top of the channel.
Only our Price Channel trading strategy makes use of this powerful price reading technique because our team at Trading Strategy Guide has developed the “early signs” of Price Channel breakout.
The fail attempt to test again the top of the Price Channel is a sign of price weakness which is confirmed when the price also fails to bounce off the Price Channel bottom and breaks it instead.
Note* - The more times a swing High fails to reach the top of the Price Channel pattern the better the trade setup
Step #3: Wait for the Price Channel breakout and for breakout confirmation
One of the worst mistakes traders does when trading Price Channel patterns is that they don’t wait for confirmation signal when the breakout happens.
You should always wait for breakout confirmation!
What do we mean by breakout confirmation?
In simple terms, we want the breakout candle to post a close below the Price Channel bottom to confirm the breakout. We also have training on How to use Japanese Candlesticks.
So we don’t just wait for the Price Channel breakout, but instead, we also want to see the breakout candle closing below the Price Channel pattern. This is a very simple way to avoid many of the false breakout signals.
Note* - The breakout candle needs to be a big decisive looking candle, but it’s not mandatory
Step #4: Sell right at the Breakout Candle Closing Price
The Price Channel trading strategy uses a very simple trade entry technique.
A sell order is triggered at the breakout candle closing price.
The Price Channel breakout technique provides us with an entry signal that you can be confident in executing the trade.
The next logical thing we need to establish for the Price Channel trading strategy is where to take profits.
Step #5: Take Profit 1 at the 50% Fibonacci Retracement of the previous trend, Take Profit 2 at the starting point of the Price Channel
The Price Channel trading strategy employs multiple entry techniques.
Our first potential take profit zone is the 50% Fibonacci retracement of the previous trend.
What do we mean by the previous trend?
The trend that was contained within the Price Channel pattern. So plot the Fibonacci retracement indicator between the high and the low of the price channel.
The second potential take profit zone is the Price channel starting point.
Step #6: Place the protective stop loss above the swing high prior to the Price Channel breakout
We’re adopting a very conservative approach when it comes to the stop loss technique. Simply hide the stop loss above the swing high prior to the Price Channel breakout.
We also recommend you to trail your stop loss above the last swing high once you cash in on the first portion of the trade.

USDCAD 1H WHAT DOES TRADEABLE OPEN SPACE MEANLook to the left at the past candles.
Trade 1 had a long body bearish candle to the left so price is rising through that space now.
Above trade 1 box you see several candles in a consolidation sideways move which creates a resistance zone.
If price can break through that resistance zone then you see to the left several long body bearish candles.
This will be the tradeable open space for trade 2 to pass through in a bullish trade.

USDCHF 1H - Move along Trendline to Daily R3/Weekly R2OANDA:USDCHF
Price currently moving up along a trend line that is also the 20EMA and mid Bollinger Band. Reaching a squeeze point between the Daily R1 and 75 Fib and upper Bollinger Band. Expecting price break to the upside to the daily R3 which is also the weekly R2 and psychological 0.9980 (just below 1.00).
Watch for a break of the trendline to the downside as price could retrace to daily Pivot at 0.9890 and 55EMA.


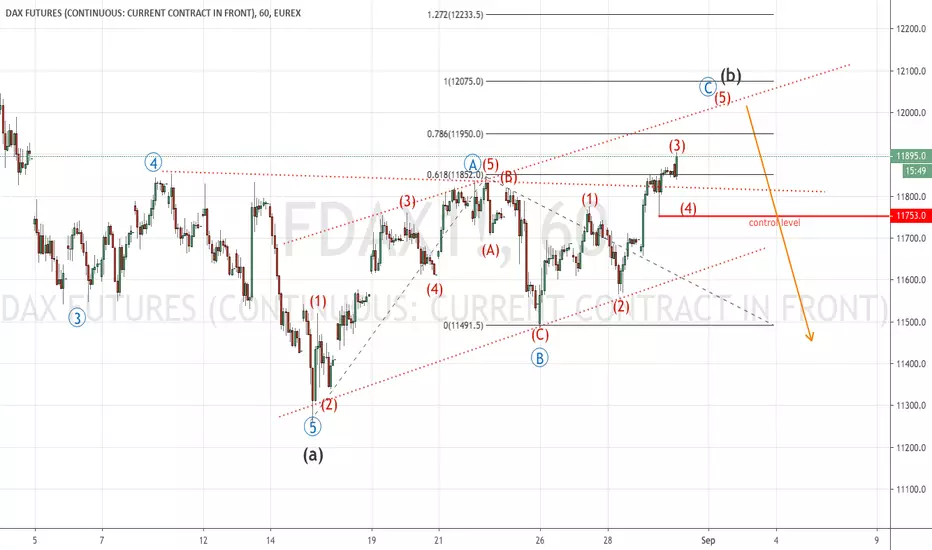
FDAX/DAX 1H alternive EW Count (ABCDE Szenario) Please take look at the DAX Big Picutre Analysis to understand this EW Count more deeply. Should we break the red control level (around 11740) in the next couple of session then I would prefere this ABCDE Szenrio over the (ABC) Szenario which I have postet prior. As long as the Index stays above the red control level I prefere the ABC count.

FDAX/DAX 1H EW Count Update (ABC Szenario)Please take a look at the DAX Big Picture Analysis to understand the EW Count. As long as we are staying over the red control level (around 11740) there should be an ABC up in play which will end around the 12K level.

USDCAD - Waiting for Reversal PatternHi Traders!
The market was just moving up for the recent candles.
Now it reaches the next resistance level.
We expect the market to pull back.
We recommend to sell with a risk-to-reward ratio of 1 to 4.5.
But wait for the reversal pattern :)!
Thanks and good luck!
