ETHUSD 1H RSI 80-20 TRADING STRATEGYStep One: Find the currency pair that is showing a high the last 50 candlesticks. (OR low depending on the trade)
The 80-20 Trading strategy can be used for any period or any market.
This is because there are reversals of trends in every period. This can be a swing trade, day trade, or a scalping trade. As long as it follows the rules, it is a valid trade. We also have training for building a foundation before a forex strategy matters.
In this step, we only need to ensure it is the low or the high of the last 50 candles.
Step Two Using the RSI Trading Indicator: RSI Settings - Period 8 - Levels 80/20
When we find 50 candle low, it needs to be coupled with RSI reading 20 or lower. (If it’s high it needs to be combined with the RSI reading 80 or higher.)
Once we see that we had a low, the last 50 candles, and the RSI is BELOW 20, we can move to the next step.
Remember that this strategy is a reversal strategy. It is going to break the current trend and move the other direction.
Step Three: Wait for a second price (low candle) to close after the first one that we already identified.
The second price low must be below the first low. Although the RSI Trading indicator must provide a higher signal than the first. Remember that divergence can be seen by comparing price action and the movement of an indicator.
If the price is making higher highs, the oscillator should also be making higher highs. If the price is making lower lows, the oscillator should also be making lower lows.
If they are not, that means price and the oscillator are diverging from each other.
Which is why it’s called “divergence.”
Just because you see a divergence, doesn’t mean you should automatically jump in with a position.
We have rules in place that will capitalize on this divergence so that we can make a significant profit.
Keep in mind, that this step may take time to develop. It is very important to wait for this second low because it gets you in a better trade making position.
Price goes down/RSI goes up. That is the Divergence.
Remember that our example is a current downtrend looking to break to the upside. If this was a 50 candle high, we would be looking at the exact opposite of this step.
Step Four: How to Enter the Trade with the RSI Trading Strategy.
The way you enter a trade is very simple.
You wait for the price to head in the direction of the trade and wait for a candle to close above the first candle that you identified that was previously 50 candle low.
Step five: Once you make your entry, place a stop loss.
To place your stop, bump back 1 to 3 time periods and find a reasonable, logical level to put your stop. You are looking for prior resistance, support.
Step 6: I recommend you follow at least a 1 to 3 profit vs. risk level. This will ensure that you are maximizing your potential to get the most out of the strategy. You can adjust as you wish. Keep in mind that most successful strategies that identify breaks of a trend use a 1 to 3 profit vs. risk level.
1h

NEO/BTC: Shortterm targets (1H chart)Target 1: 2035
target 2: 1950
bearish crossover on daily stoch RSI, MACD about to turn bearish aswell on the daily. I think we will see even lower prices than 1950. *not financial advice*

ORB Nr4 CANDLESTICK PRICE ACTION STRATEGYORB - Opening Range Breakout
This strategy works on all markets - time frame is Day & 1H
Step #1: Wait until you can spot a bar that has its daily range smaller than the previous three days
The first rule requires you to have the patience until the Nr4 pattern develops on the YOUR chart. When we have a daily trading range that is narrowed than the previous trading ranges it means that the price is contracting.
Based on our backtesting results we have found out that there is a high probability of a trend move after you spot this type of contraction. This is kind of a general rule because the markets do move from periods of contractions to periods of expansion.
This is the reason why this short-term price pattern is so powerful.
Step #2: Mark the High and the Low of the 4th day and switch to the 1 hour time frame
Our trade is taken the next day after the Nr4 pattern showed up. In order to have a clear view of the short-term price action we need to switch our focus to the 1 hour time frame. Before you switch the time frames make sure you mark on your chart the high and the low of the 4th day.
The short-term pattern Nr4 satisfies all the requirements for a valid setup, which mean that we can move forward and describe how to buy or sell.
Step #3: How to buy or sell: Buy/sell only if the breakout of the Nr4 high/low happens during the first 5 trading hours.
We use the Opening Range Breakout technique to time the market and have an effective trade entry. The ORB is even more profitable if it occurs after inside days that have a smaller trading range than the previous 3 days. Here is another strategy called simple yet profitable strategy.
Our trade may not have an inside day, but nevertheless we want to buy/sell only after we break above/below the Nr4 day high/low. Also, we want to make sure the breakout happens during the first five trading hours of the next day.
Trades based on the ORB – Nr4 pattern will show you a profit instantly.
Now, if the trade is not showing you a profit right away then your trade becomes more vulnerable. As a general rule, if after the first trading hour your trade is not in the green, you can safely close the trade at the market.
Of course, you can only do that if your stop loss hasn’t been triggered in the meantime.
Now, let’s outline where to place our protective stop loss.
Step #4: Place your protective Stop Loss above/below the Nr4 day high/low
You can hide your protective stop loss above/below the Nr4 day high/low. Alternatively, you can also place your stop loss below the current day high/low as this will give you a better risk to reward ratio.
The ORB - Nr4 pattern tends to precede strong trend day activity, so your stop loss should be rarely hit. Both of these patterns can be traded individually, but when combined they tend to produce even more powerful trades.
Step #5: Take profit at the close of the first 1-hour bearish candle
Our take profit strategy is fairly easy and it’s slightly modified from the original strategy highlighted in the “Day Trading with Short Term Price Patterns and Opening Range Breakout” book written by Toby Crabel.
Even though the ORB pattern tends to lead to trend trading days we’re more conservative and want to quickly take profits. So as soon as the first bullish/bearish candle shows up we close the trade and enjoy our daytrade profits.
Alternatively, you can keep the trade open until the end of the day if you want to extrapolate more profits from the market.


AUDJPY 1H MA CROSSOVER STRATEGY W/ALERTStep 1 - Apply 8 & 20 sma to chart
Step 2 - Apply ma crossover alert to chart
Step 3 - Enter at candle close as 8 sma crosses above 20 sma
Step 4 - SL below crossover point
Step 5 - You determine TP point

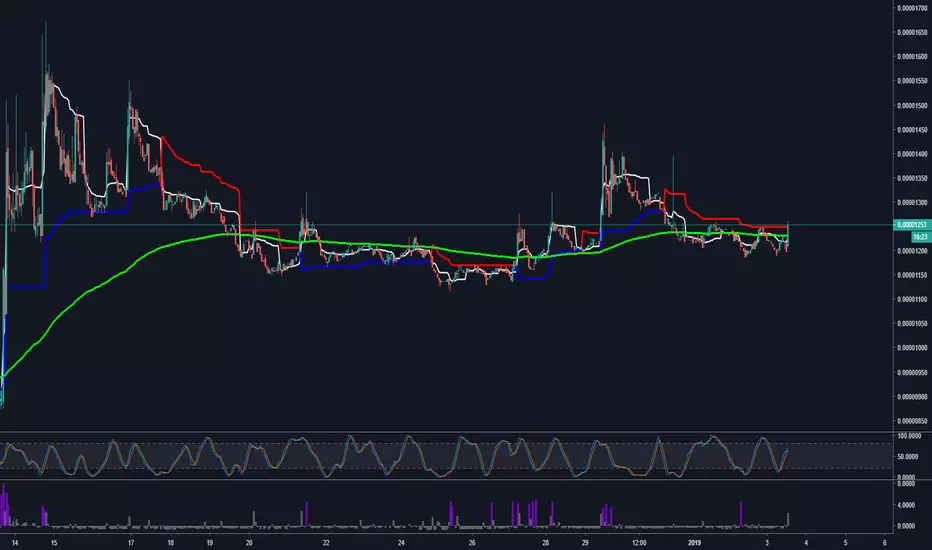
$SYSBTC Syscoin Short Term Long Channel Bounce 1 Hour Time FrameWatching a short-term 1 hour bullish engulfing candle bounce play off of support. I'm long at current level and looking for price targets at or above the 1460 satoshi area. Don't fall in love with her just trade the bitch! Viva La Crypto!


GBPAUD 1H SHOOTING STAR CANDLE STRATEGYStep #1: Attach the Chaikin Money Flow Indicator on your Preferred Time Frame
Start first by preparing your charts ready for the battle. Simply attach the Chaikin Money Flow indicator on your favorite time frame. This is the only additional technical tool we’re going to use to confirm the validity of the bearish shooting star pattern.
Using the CMF indicator we accomplish one major thing.
The validity of the bearish shooting star will be confirmed or invalidate instantly as soon as the bearish inverted hammer develops on our Bitcoin candlestick chart. This means that the price won’t move any further from the ideal entry price.
Step #2: The Shooting Star Candle should come after a strong bearish trend
The location or in other words, where the shooting star candlestick develops matters a lot.
This whole ingredient is what makes the bullish shooting star candle performs with such a high degree of accuracy. We need a strong downtrend that has two important features:
The first part of the trend is a slow and steady move to the downside
The last part of the uptrend, prior to the shooting star candle, needs to be more volatile.
Basically, we’re looking for a full-blown market bottom where the bears are exhausted and reach a climax point.
Step #3: The CMF indicator must be above the 0 line once the bullish shooting star candle develops
The Chaikin Money Flow is a great tool to read and measure institutional accumulation-distribution activity in any market. Basically, a CMF reading above the zero line shows that the buyers have the upper hand and they took control of the market.
Notice that the bullish shooting star spotted satisfies all the requirements of a bullish inverted hammer. The shadows are at least two times longer than the body; small body; and very little upper shadow. This candle would have been more powerful if the closing price is above the opening price.
But it’s still a good pattern to trade due to all the other features.
Now, it’s time to highlight how to find the right entry point for bullish shooting star candlestick.
Step #4: Buy once we break the high of the Shooting Star Candle
Simply, place a buy stop order above the high of the shooting star. Nothing complicated about our entry strategy. It’s in line with the textbook rule.
Step #5: Hide SL below the low of the Shooting Star Candle.
Simply hide your protective SL below the low of the shooting star pattern. You can add a buffer of a few pips if you wish to protect against possible false breakouts.
Step 6: TP when we get inside the slow part of the prevailing trend or you choose your TP strategy.
The full-blown bottom creates the necessary space where the bulls would find no level of support to stop the drop. The last stage of a trend has been always more volatile. And, when combined with the reversal shooting star pattern, it makes for a killer trading strategy.
Reverse strategy for a Bearish Shooting Star Strategy.

BCHUSD 1H BITCOIN INDICATOR LONG TRADE STRATEGYBitcoin Indicator found a long trade entry
Adjusted SL and TP shown
Bitcoin Indicator works on any market and time frame
If you have any questions PM me and i will be happy to help

ETHUSD 1H MA CROSSOVER STRATEGY WITH ALERTLook for our "Best Trading Indicator" for MT4/5
8 sma cross over of 20 sma with Alert
Alert can be sent to any of your devices
PM me for the complete pdf of this strategy if you are interested

EURAUD DAY ORB Nr4 Long TradeLook at rules listed on CADJPY
Step 2 breakout went long
Step 5 - waiting to place trailing stop at bottom low of each 1H candle close after breakout

ORB Nr4 CANDLESTICK PRICE ACTION DAILY STRATEGYStep #1 How to Identify the ORB Nr4
The ORB pattern is defined as a trade taken at a fixed value of the opening range.
The Opening range Breakout trade is more effective if taken after an inside day that has its daily range smaller than the previous 3 days, which is where the Nr4 stands for. You have three candles followed by another candle with a daily range narrower than the previous three days.
Note #1: The 4th day doesn’t necessarily need to be an inside day, it only needs to have its daily range smaller than the previous 3 days. However, inside days tend to produce a higher success rate.
The ORB Nr4 pattern can be the best candlestick patterns for intraday trading too. You simply have to apply the same rules outline in this guide on your favorite intraday chart
What if we told you that, 40% of the time the first trading hour can tell you what is the high and the low of the day. Our candlestick patterns strategy incorporates this price behavior so you can better manage your risk and set your targets.
Basically, you can become a proficient trader.
Like with all our trading strategies we’re going to give you first the trading rules by going through an actual live trade example that uses the best candlestick patterns mentioned through this PDF guide.
Step #2: Identify the best candlestick patterns and mark the high and the low of the 4th candle
When you search for the ORB Nr4 candlestick chart pattern keep in mind two things:
The Daily range of the 4th candle needs to be narrow and smaller than the previous 3 candles.
The 4th candle price range also needs to be inside the candle number 3.
The ORB Nr4 pattern in the chart above is a bullish candlestick patterns because it leads to a bullish move.
Narrow daily trading ranges suggest contraction. And contraction always leads to expansion. This is kind of a general rule because the markets do move from periods of contractions to periods of expansion.
This is the reason why this ORB Nr4 candlestick pattern is so powerful.
Step #3: Switch to 1h TF and Buy if we break the high, Sell if we break the low of the Nr4 candle.
Our trade is taken the next day after the Nr4 pattern showed up. In order to have a clear view of the short-term price action we need to switch our focus to the 1 hour time frame.
Note #2: Only Buy or Sell if the breakout happens during the first 5 hours of the new trading day.
We use the Opening Range Breakout technique to time the market and have an effective trade entry.
Trades based on the ORB – Nr4 candlestick chart pattern will show you a profit instantly.
Now, if the trade is not showing you a profit right away than your trade becomes more vulnerable. As a general rule, if after the first trading hour your trade is not in the green, you can safely close the trade at the market.
Of course, you can only do that if your stop loss hasn’t been triggered in the meantime.
Step #4: Place SL below NR4 day low,
Step #5: Take profit using a trailing SL below each 1h candle low/high
For buy trades, hide your stop loss below Nr4 day low. The ORB – Nr4 pattern tends to precede strong trend day activity, so your stop loss should be rarely hit.
Our take profit strategy is fairly easy and it’s slightly modified from the original strategy highlighted in the “Day Trading with Short Term Price Patterns and Opening Range Breakout” book written by Toby Crabel.
Even though the ORB nr4 pattern tends to lead to trend trading days we’re more conservative and want to quickly
take profits. We would trail our SL below each 1h candle low and wait for the market to reverse to take profits.


BTCUSD 1 hourHello,
The green 1 on the TD sequential setup phase looked promising when it went above the green 9, indicating that we could accelerate the 13 countdown phase to the upside. Unfortunately, this candle was also a perfect gravestone doji. Candle shape overrides TD sequential.
We are still above the cloud, however, the baseline of the ichimoku crossed the conversion line, indicating the close of the long.
The 50h MA provided perfect support and the 128h MA is providing very strong resistence.
If we can consolidate at current level, we can start attacking the 128h MA, brake it to the upside, and flip it from resistence to support.
Best regards,
Alexandre Simões

BTCUSD 1hourHello,
We are above the cloud with the conversion line above the base line and we have a green 1 on the TD sequential setup phase. The RSI is getting close to overbought but wee still have some room to go up. We are set to go to the 200h MA, around 3700, in the next 9 hours. After that we will probably have a correction.
Best regards,
Alexandre Simões

EURAUD 1H BICTCOIN INDICATOR STRATEGYBitcoin Indicator works on all markets and time frames
Bitcoin Indicator shows entry point, take profit, stop loss that becomes an adjusted trailing stop
PM me if you have any questions on this great indicator

BTCUSD - Reverse H&S formingPossible reverse H&S forming since breaking the downward resistance trendline of the falling wedge this morning.
Small volume not able to break the 50MA for now, but price supported by the 38.2 fib level. Next target could be the 50 Fib at 3870 USD.
If BTC breaks the 50 fib, strong resistance at the 67.8 fib will probably push the price down towards the 3.700-3.680

USD/JPY Gartley Pattern You already can see confirming for USD/JPY strong sell in my account. There is confirm for sell on Month, daily, STRONG SUPPLY and forecast for USD in Friday on payrolls and employment rate are only sell.


GBPCHF: Short From The TopWhaaaat´s up traders ?
Here is my short analysis for the GBPCHF pair. Im short on this pair as we see major market structures forming. Currently price is above my entry ,but with the right risk management there is nothing to worry or stress about. As long we do not move a larger move (20-50 pips) over the divergence trend line. After 3 levels of rise we expect at least a bigger correction from there.
Wishing you a great trading week and be careful for pre elections during these hours :)


EURUSD 1H BITCOIN SIGNAL STRATEGY INDICATORBitcoin Signal Indicator works on all markets and time frames
Bitcoin Signal Strategy Indicator shows entry and exit/take profit signals
Bitcoin Signal Strategy Indicator has an adjusted trailing stop
TP is adjustable. This pair was a 2 to 1 reward risk ratio
1st trade exited with price hitting the trailing stop
2nd trade is still active rising to take profit level
PM me if you have any question i can help you with.
