GBPJPY BUY ANALYSISFX:GBPJPY
Overall structure based o the weekly, daily, 4h and 1 h is bullish, so I am strictly looking for buys on GBPJPY. Price broke above 186.218 4H resistance area and made a retest as support, entry was based on a morning star candlestick pattern on the 15 min timeframe
1h

GBPCAD BUYFX:GBPCAD
Break above and retest above 1.71047 daily resistance on GBPCAD with overall trend being bullish on the daily,4h, weekly and 1h.

GBPCADFX:GBPCAD
Break above and retest above 1.71047 daily resistance on GBPCAD with overall trend being bullish on the daily,4h, weekly and 1h.

NZDJPY BUYOANDA:NZDJPY
break above 89.604 weekly resistance and a retest on what is now 89.604 weekly support on an overall bullish trend on the weekly,4h and daily. the bullish engulfing variation is my confirmation to continue my bullish bias.

NZDJPY BUYOANDA:NZDJPY
break above 89.604 weekly resistance and a retest on what is now 89.604 weekly support on an overall bullish trend on the weekly,4h and daily. the bullish engulfing variation is my confirmation to continue my bullish bias.

usdjpy buyFX:USDJPY
Overall structure based on the Weekly, Daily and 4h timeframes is bullish. Yesterdays CPI news release pushed price down to 150.355 Daily support area. An bullish engulfing variation candlestick was my confirmation to continue my bullish bias on USDJPY

gbpaud buyFX:GBPAUD
Break and retest on the daily support/resistance area. Bullish engulfing candlestick on the 4h is confirmation that price will continue its bullish run

GBPAUD BUYFX:GBPAUD
Break and retest on the daily support/resistance area. Bullish engulfing candlestick on the 4h is confirmation that price will continue its bullish run.

EUR-USDThe EURUSD currently traded at 1.06850 price. And the support and also demand area at 1.06600-1.06500. Market is test three time and gain momentum to pull the price upward.

gbpjpy buyFX:GBPJPY
Overall structure is bullish on the weekly, daily 4h and 1h. Price broke the bearish countertrend structure, making a retest on the 1H 185.247 support area. I am anticipating a push to the upside until around th3 186.438 Daily resistance area

gbpjpy buy analysisFX:GBPJPY
Overall structure is bullish on the weekly, daily 4h and 1h. Price broke the bearish countertrend structure, making a retest on the 1H 185.247 support area. I am anticipating a push to the upside until around th3 186.438 Daily resistance area


EURUSD Swing Trade Potential with Wyckoff RTM AnalysisIn this post, I'll provide an overview of my recent exploration into EURUSD swing trading, employing a combination of two powerful analytical approaches: Wyckoff Price Action Analysis and RTM. While these methodologies can offer valuable insights into market dynamics, it's important to emphasize that this approach is inherently speculative and should be taken with a grain of salt.

USDJPY BUYFX:USDJPY
Overall structure based on the Weekly, Daily, 4H, 1H timeframes is bullish, so we only look for buys. In the previous two days, price broke above 149.922 Daily resistance and made a pullback to around the 149.922 Daily support today, a great are to buy USDJPY

GBPCAD in bearish trend.GBPCAD is in bearish trend and printing LH and LL. There is no divergence on 1H timeframe at the moment. Oil prices are also on the rise which will probably strengthen CAD resulting in further bearish trend.
Sellers will be in control once support level of 1.66593 is broken. It will get retested and then hopefully, will go further down to 1.66067.

GBPJPY SELLFX:GBPJPY
Price on GBPJPY is consistently rejecting at Daily resistance. The Daily, 4H, and 1H time frames are bearish, hence we will have a sell bias on GBPJPY.

25/09/23 Weekly outlookLast weeks high: $27490.1
Last weeks low: $26897.7
Midpoint: $26305.4
Despite several big news events relating to the FED funds rate, CPI & PPI, we saw a much tighter range last week than the week previously.
We're already trading lower than last weeks low and confirmed as resistance with a bearish retest.
It is interesting that the news events that used to give us such volatility are now barely noticeable on the chart at all. This leads me to believe we're in the later stages of the bear market, where the speculative investors traders are no longer interested, the market makers are not interested in trading news events that are risky and therefore we have almost a stalemate in price action.
When an asset like BTC fails to have buy side pressure/volume then price will naturally creep lower to find buyers, this is basic supply and demand and the reason for my prediction that we'll see a retest of that yearly open price around 19k in my opinion. By that point smart money will look to catapult BTC back towards ATH over the next couple of years. Survive the next 6-9 months and the patient shall be rewarded, we see it with every cycle.

18/09/23 Weekly outlookLast weeks high: $26894.1
Last weeks low: $25873.8
Midpoint: $24853.5
After CPI and PPI news events that took place last week, we can see a clear uptrend after a deviation below the midpoint, then a reclaim and a move up higher.
This week we have FOMC and the interest rate decision. The forecast is for the interest rate to remain the same at 5.50%. This decision has been priced in IMO but that doesn't rule out any potential whipsawing in the minutes up to and following the decision, we also have the press conference that can give some volatility too. However, if last weeks news events are anything to go by the volatility will be low compared to previous FOMC's.
The bigger picture plan stays the same for me, I do think we're moving towards that yearly open retest before thinking about the run up to the halving and the bullrun beyond. A retest of 28k resistance with a bearish reaction off that level would further add confluence to this idea. As for now staying patient and looking for opportunities outside of the choppy price action.

29/08/23 Weekly outlookLast weeks high: $26824.0
Last weeks low: $26045.0
Midpoint: $25266.0
The weekly outlook starts on Tuesday this week due to the bank holiday. Despite a strong decline 2 weeks ago price has stabilised into a much tighter spread, almost like a sinewave across the midpoint.
Because of this for me personally there is no clear near term direction, however the longer term direction would seem to be bearish thinks to that new lower high after the pullback. We'll know for sure once a new lower high is posted.
If that happens, I would expect most of this years progress to be retraced back down towards the 19k area by the end of the year/Q1 2024.
For now there is not a lot to do as LTF chop is very difficult to navigate currently.

21/08/23 Weekly outlookLast weeks high: $29678.9
Last weeks low: $26943.6
Midpoint: $24208.4
August so far has been living up to it's history of being a red month. Last week we saw price fall ~18.45% from weekly high to low, filling in the fair value gaps from the previous HTF rally and printing a new 1W lower high for the first time this year.
Now that the FVG has been filled and a bit of volatility reintroduced into the market the next move is very important. For BTC to stand a chance in the near term I think the bulls need to reclaim the 1D 200EMA very quickly. Last weeks midpoint at 26942.4 is also approximately at the 1D 200EMA. However, If price rejects off that level when retesting it then I do think price will slowly find itself tending towards the yearly open of around 19k.

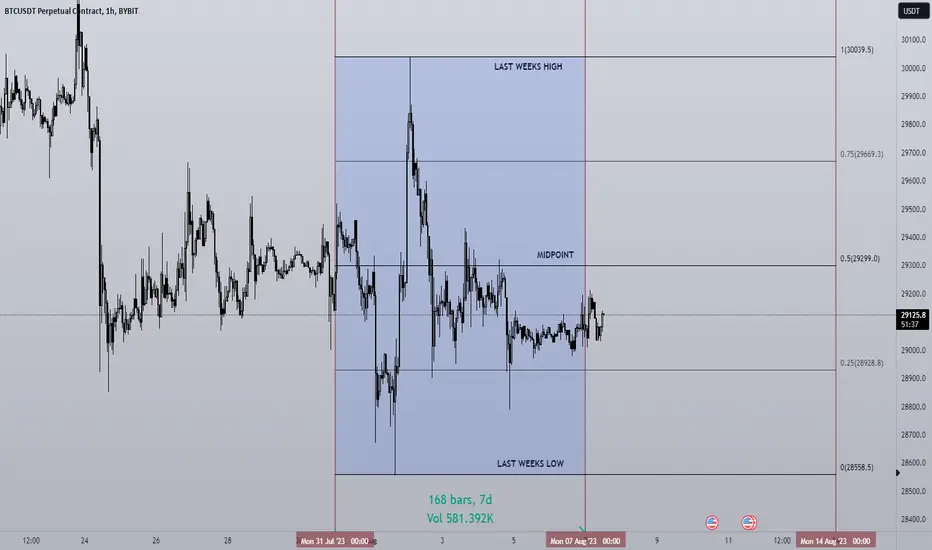
07/08/23 Weekly outlookLast weeks high: $30039.5
Last weeks low: $29299.0
Midpoint: $28558.5
Historically, August has not been a very bullish month for bitcoin and crypto as a whole. Other than 2013, 2017 & 2021 (Bull market years) August has had negative ROI.
The pattern shows that since 2013, every 4 years bitcoin has a positive monthly return coinciding with a bull market rally. If we were to apply this pattern to future returns, 2025 should have green August thanks to a bull market.
We already know that the halving is taking place somewhere in Q2 of 2024, the US election in Q4 2024 along with potential BTC ETF's from Blackrock becoming closer and closer to reality. 2025 Could be a very strong year for the crypto market as a whole.
In the short term, the way price has been behaving in recent weeks I would struggle to see why this August will be any different. For many weeks now I have believed that the target of 26.5K is in reach for the bears, approximately -9% from current price and when not including bull market years the average % return for the month is -9.8%. 2018's august returned -9.27%.
14/08/23 Weekly outlookLast weeks high: $30265.2
Last weeks low: $29472.7
Midpoint: $28680.1
BTC continues to trade a very tight range as it has for many weeks now. 30k continues to be the resistance area, the previous weeks midpoint is the local resistance as its been tested for the last few days and cannot reclaim above. As usual that midpoint from the previous week is important to the direction of this week.
We've had some talk about ETF's recently, the former SEC chief has said the SEC will not approve a spot Bitcoin ETF. Personally I believe the SEC will not want to approve an ETF, however eventually I think players like Blackrock will get what they want, they always do and I wouldn't be surprised if it miraculously gets approved around the halving event, and you can be sure Blackrock and the other big players like Valkyrie would have already bought a large chunk of BTC before the supply halves at much lower prices.
Really that's what every trader/investor is waiting for because at the current moment there really isn't a lot of money/volume at all in the market. The start of this half of the year is evidence enough for that. Reserving capital for the big moves that come later down the line is essential and avoiding being chopped up by the market is a big priority.

29.5K PIVOT POINT After many days of sideways choppiness between 29 & 29.5K. The pattern was broke sending us into that FVG I have mentioned in previous posts with a target of 26.5K. However, having dropped down to 28.5k and back up to 30k in 11 hours some volatility has been reintroduced into the market in the short term.
I have mapped out a mini range that I am observing, the 29.5K pivot is still the controlling factor in my mind. Now that price has deviated above and is now back in range printing a SFP, in addition to a bullish orderblock that is providing a reaction as the time of writing this post. I still think we have some downside to come should this reaction now clear the pivot point of 29.5K
Because of this, I am still confident that reaching the 26.5k target is possible. Regaining 29.5k confidently and proof that it is now support would make me reconsider this strategy.
