BTC recovers energy after yesterday's correction.Hello everyone, let's take a look at the BTC to USDT chart on a 1 hour timeframe. As you can see, the price is moving in the uptrend channel marked by the blue lines.
Let's start with the designation of the support line and as you can see the first support in the near future is $ 39,334, if the support breaks down, the next one is $ 38,174 and another one at $ 36,982.
Now let's move from the resistance line, as you can see, the first resistance is $ 40,785, if you can break it, the next resistance will be $ 41,429, another resistance at $ 41,945, the next resistance is $ 42,493 and $ 43,202.
Looking at the CHOP indicator, we can see that in the 1-hour interval the energy was used for a local correction and now we collect the energy anew.
1hrchart

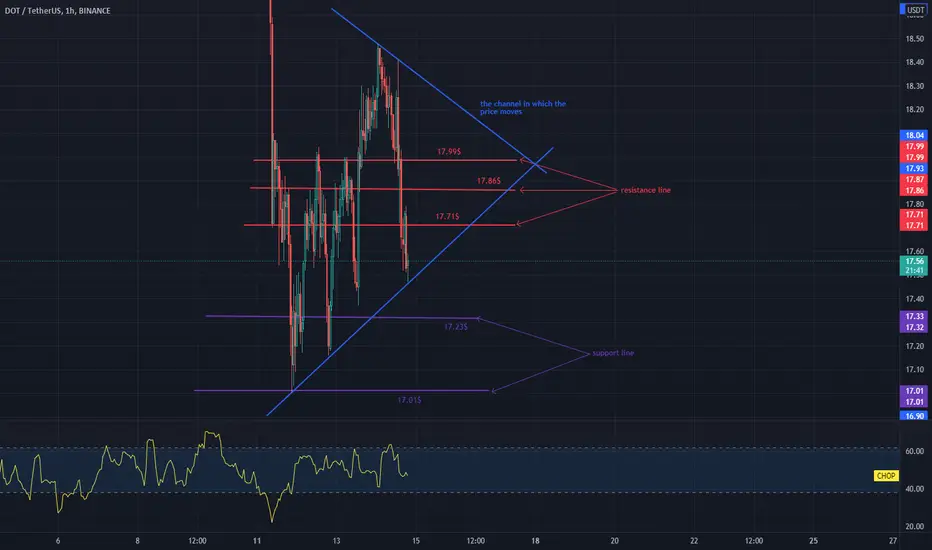
DOT without energy for 1H intervalHello everyone, let's take a look at the 1H DOT to USDT chart. As you can see, the price moves in the designated channel with blue lines.
Please note that this is a short-term analysis.
Let's start with the designation of the support line and as you can see the first support in the near future is $ 17.23, if the support breaks down, the next one is $ 17.01.
Now let's move from the resistance line as you can see the first resistance is $ 17.71, if you can break it the next resistance will be $ 17.86 and $ 17.99.
Looking at the CHOP indicator, we can see that in the 1H interval most of the energy was used.
AUDUSD LONGOANDA:AUDUSD
AUDUSD is in an overall 1H uptrend with price retracing at 61.8%, creating a new higher low. Long Wicks indicates that sellers are losing their bearish momentum. On the 15 min chart price created a double bottom pattern.

DXY 1Hr Analysis, London Close Friday 1/28/22Wow, what a move this week by USD
Expecting us to come back for liquidity to
96.95. It is possible this Dollar trend may just keep going
but usually the weekly candle crossover provides some bout of
liquidity

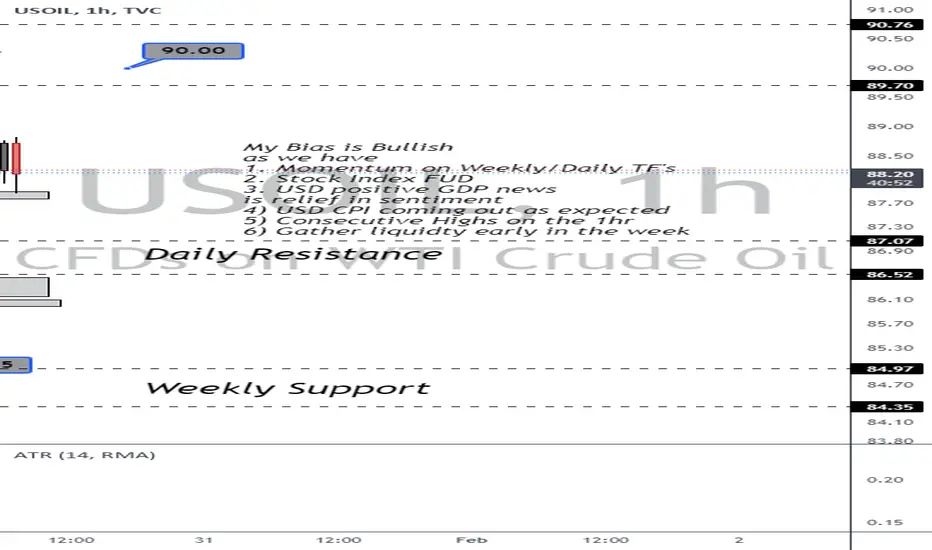
USOIL 1Hr Chart Friday NY Session, 88.20$Consecutive HH's on the 1Hr
Fakeout for liquidity back down to 86.75 yesterday duirng NY Session
to grab orders. Shouted out buys if your Bias is Bullish on crude in the "update section "
yesterday from 86.75
Intraday ATR increasing as we move into London Close, could see another leg here.
Or we reject to gather more liquidty for Sunday/Monday next week.
Anything can happen, always have a stop and a good Risk Reward
1H $BTC scenario game planThis scenario would I like to play out, run up to the weekly supply block on the weekend to grab liquidity at the weekly lows to look for an reversal.

FET Flag Formation 1H %18Hello everyone,
I am observing a flag formation on the 1-hour chart. It can be bought if it retests the resistance (0.5185).
The target (90.6142) will again be the upper resistance.
Just in case, the lower support (0.4572) 10% stop-loss should not be ignored.
Farewell

Adobe LONG +11%ADBE. Let's try to make money from rebound from resistance on 1h timeframe.
Take profit ≈ $624 (+11%)
Stop lose ≈ $548(-2,3%)
this is not a financial recommendation.
Take care.

1hr Analysis on KMX(Carmax)This is my 1hr markup on the 1hr chart with KMX.
I have an entry above 138.55 with an initial take profit at 140..
If price pushes above 140, then I plan on holding back to 143-145.
I like this idea based off the the 200MA bounce(blue line) as well as the Daily Chart sitting at or around a 50% retracement.
Will watching over the next few days.

Iota - USDT Every day starting with charting!1hr View
It has had a few good runs so have used it to day to mark out my support, resistance and trend lines.
Every day starting with charting!
Purple rectangle - 1 day
Yellow - 4hr
Green - 1 hr
IOTA kicked away from descending wedge and went bullish - Parallell Channel represents this.
Needs to break resistance at 1.05 - you could look to trade the channel and take it to 1.10
The next interesting session will be bouncing between 1.05 (if becomes support) and 1.10
If 1.10 becomes support 1.20 is the next point of resistance.
Feel free to pass on any feedback on my analysis.

EURUSD H1 Chart Analysis & IdeaAs the EURUSD resets for the next trading week, price closes at 1.1795, inside a contraction level zone around 1.182/1.178, nearest demand zone around 1.172/1.168, nearest supply zone around 1.188/1.192, with weekly close reset trading range between 1.19 & 1.17, these are the areas of interest in this chart as of the week close. For price action, there's this wedge-like structure forming up on the hourly, and on the zoomed-out 4-hourly there's a established descending parallel channel getting escaped to the upside, maybe some more downside is possible, but only to grab liquidity further down and then move for higher prices, as this market finds a demand imbalance.

$SUSHI Breakout ImminentAs you can see on the one hour chart, SUSHI has a repeating pattern that looks as if it is getting ready for takeoff.

ethusd may be following maticusd's leadethusd is also in a bit of an inv h&s that it has also broken above...it isn't quite as high above the neckline as matic is though so it currently has somewhat less probability of validating the breakout as maticusd does. Eth's pattern probably also could qualify as an adam an eve double bottom. Should ethusd's pattern get validated it could reach a target of 3.7k which wouldn't create a new all time high unlike matic which will create a new all time high by reaching the measured move...as with any pattern that forms on as small of a time frame as the 1 hour chart however we must remember that patterns on this small of a time frame get invalidated all the time so even though price action is currently above the neckline its still fairly easy for it to dump back below before reaching the target since it is on such a small time frame. For that reason I will list this idea as neutral.


XRP 1HR Tripple BottomTriple Bottoms being one of my favorite plays, I have located one the 1HR $XRP chart. Solid bounces right of the support with ranges marked with Horizontal rays. Gives you a decent idea of where it can go with continued solid volume. This is my first publish, thanks for taking the time to check it out and read. Any recommendation are greatly appreciated. Thank You, happy trading. Go Green Or Go Home.

NIfty 50 1 hour Time Frame analysis1 hour Time frame analysis
If Nifty 50 Open Gap Up from here and 15 min Sustain Above from the open Price then nice chance to initiate long
Current Resistance Level from here -- 14700 ----------> 14785 ------------> 14885 --------------> 15000
Current Support Level From Here ---- 14560-----------> 14445 ------------> 14370 ---------------> 14300
I am not a SEBI registered adviser. All the information provided by me is for educational/informational purposes only. Never invest more than 2 % Capital In Single trade. Trade on your own Risk and analysis

1hr chart inv h&s seem to be confirming breakout on xrp & btcthis is the inv h&s pattern we just broke up from on the 1hr chart that seems to be confirming its breakout....its measured move breakout target should then take us above the top trendline of the 1 day charts bullflag(not shown here) that we are currently just below the resistance of
n it's top trendline..greatly increasing the odds that we will break above that trendline on the way to reach the inv h&s's breakout target....bitcoin is doing the same exact 2 patterns as well right now so where goes bitcoin xrp is likely to follow...currently the bullish confluence tips the probability scales slightly in the bulls favor for continuing to the upside. However we need to see confirmation similar to this inv h&s pattern's on the 1 day bullflags as well in the next few days to feel confident that the breakout it fully confirmed.

1hr inverse head & shoulders on btcusd...target 65.9k?There's still a chance this could be a fakeout but probability currently favors a breakout...as always I must wait for confirmation of breakout first before entering.

LTCUSDT Re-accumulation with inverse head and shoulders.LTCUSDT has formed a re-accumulation zone on the one-hour chart! This process is also creating a very nice textbook - Inverted head and shoulders. The chart also has a price imbalance x 2. Good luck!

Green Triangle Region (DOGE)I think the Green Triangle Region is suitable for investing and after that we will see a pump again.


FIOUSDT Intraday wave countI've put together a brief wave count. This may be more helpful than the prior chart. Good luck!

SANDUSDT Intraday one hour wave countHello traders. Please find my intraday one-hour wave count for SANDUSDT. Sell target is on the chart. Good luck!
