Xrpusd cup and handle targetIf xrp triggers the current bullflag its in on the daily chart it should take price ell above the neckline of the cup and handleshown here on this chart and trigger its breakout as well which has a breakout target around $6.70. *Not financial advice*
1wk

Weekly/monthly bullflag on xrpusdAn even higher target than the symmetrical triangles two potential targets materializes when we confirm the breakout up from this bull flag. It will likely have a bullish target somewhere around $5.20. Upon reaching this target it will also be breaking above a big cup and handle that will then have an even higher breakout target which I will post in my next idea *not financial advice*

Ascending Inverse H&S on the BTC weekly chartThe longer it takes to break above this neckline the higher the breakout target will be. I have arbitrarily placed the measured move line at July 18th 2025. If the breakout were to happen on that day the measured move target is around 208k, which could take quite awhile to reach or if we entered a truly hyperparabolic blow off top we could reach such a target way quicker than when the dotted measured move line reaches it. *not financial advice*

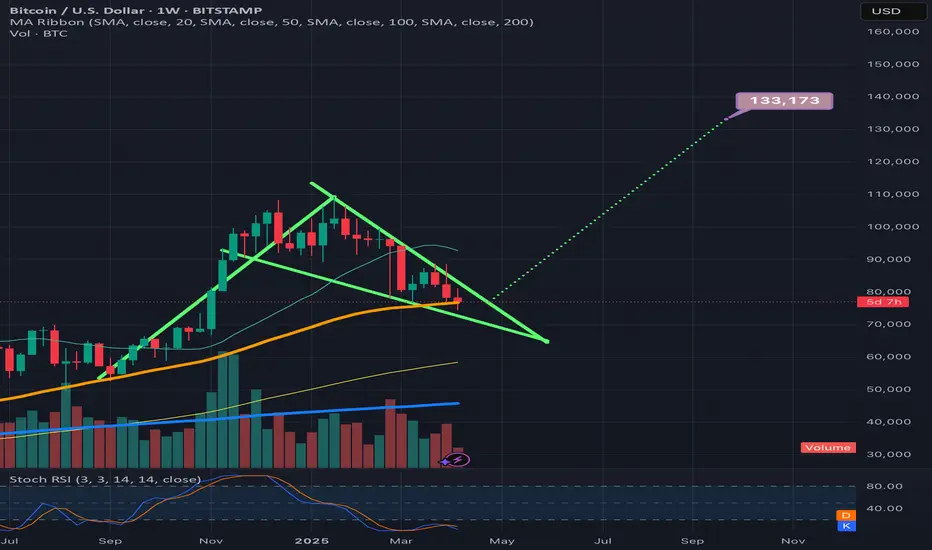
BTCUSD. Weekly bull pennantThe daily failing wedge’s top trendline is not as sharp of a trajectory as the the weekly timeframe’s and due to this, the daily time frames wege is noticeably longer, so I thinkI am going to post a follow p idea to this one that shows the longer version of the wedge, not sure which one is more valid yet at this current time. If the weekly 50ma(in orange) can hold support then we should break up from this wedge right around where I have placed the dotted measured move lne, in which case the breakout target would be around 133k, if the longer version of the wedge on the daily time frame is the more valid of the two then we will likely have to correct longer before we see a breakout. Will post the longer version n the very next idea post. *not financial advice*
XRP just found bounce support on the bttm trendline of the wedgeLooking like a very valid pattern on the weekly hart. My guess is it will break upward somewhere around where I have arbitrarily placed the dottedmeasuredmove line, in which case the breakout target would be somewhere around $4.80 always a chance we retest the bottom trendline and even send a wick below. It before confirming a break upward though. *not financial advice*

Current bitcoin bullflag has a target of 144kBeen consolidating inside this one for some time now and its been creating a lot of uncertainty in the market lately as most people have been distracted by the bearish h&s pattern on the Daly chart and haven’t zoomed out to the higher time frames to realize this whole time we’ve ust been consolidating inside this bullflag. The stochrsi has already been reset for awhile on the Daly time frame and is about to be fully reset here on the weekly time frame too sugget we will resume the uptrend in the near future. *not financial advice*

XDC breaking up from 3 different bull patterns at the same timeI had to use the weekly time frame instead of the daily to fit all 3 patterns in the frame here. As you can see we have a double bottom(green neckline), an inverse head and shoulders (tan neckline), and a pink bullflag that price action is currently breaking above each of. Their full measured move targets are all relatively close to eachother too which creates some bullish confluence. *not financial advice*

Potential c&h on ETHUSD would have a target around 7kFor now this is just a speculative cup and handle pattern, plenty of them have gotten to this level and even completed the handle with a candle or two above the rimline of the cup and still ended up falling and eventually being nullified, so there’s no absolute guarantee this will play out this way. However, as it seems we may be now entering phase 2 of the bull markets uptrends, It is certainly probable this could very well play out just like this. The channel ether is just now breaking up from that I posted a chart on the other day(which. Will link below) has a big enough breakout target/measured move that it should bring price action up above the rimline of its bigger cup and handle pattern here. We will see soon enough I’m sure. Only thing I see prolonging such an outcome would be some sort of unforeseen black swan. *not financial advice*

SUIUSD starting a handle to the cup it just formedI placed the measured move line arbitrarily where price action would usually tend to break up from the handle of a cup of this size, if it does validate a breakout anywhere near there the target should be around $4.32. If bitcoin is cleared for takeoff soon and resumes the uptrend/bull market there’s a chance SUI could break out of this cup and handle pattern sooner than that. Also a chance after SUIs meteoric rise that it could continue to consolidate while the rest of the market pumps as well. My hope is the handle sui is now forming is similar in depth to the handle bitcoin has been forming since march, if so I will wait for a good correction before buying any additional sui myself. *not financial advice*

A close above the top red trendline would be very bullishShown here on the weekly chart is the weekly bullflag bitcoin has been consolidating in ever since correcting from the all time high we hit earlier this year.. For the first time since then, we now have part of a daily candle body above the top eligible top trendline of the flag and may very well close the current daily candle above that trendline for the first time which would be a very bullish development. It will be even more bullish if we can also manage to close a weekly candle above it as well but we still have another 6 days before anything like that can occur. For now a daily candle close above is still good progress which we have about 40 minutes left before the current daily candle closes (not shown here). If we were to break up from the red bullflag at this exact spot on the chart, there is some excellent bullish confluence here as you can see the measured move breakout target from here would be the exact same target as the much larger Purple bull flag we broke upwards from back in February. Both have a target around 99k. So this would indeed be a great spot for such a breakout to occur. We can also see the weekly 50 moving average(in orange) is holding very strong bounce support and should help to prevent the price action from recentering the flag/channel in the coming months as it climbs higher. *not financial advice*

XRPUSD Weekly chart suggests a triangle breakout is nearingWe can see here how the bottom trendline of this brown symmetrical triangle has held support since early 2020 and will likely continue to do so. We can also see that we are on the verge of a weekly golden cross with the weekly 50ma (in orange) looking like it will cross above the weekly 200ma(in blue) shortly after the next bullish impulse in price action. Those MAs are currently serving as support for current price action and could easily maintain that support. If so then the place I arbitrarily put the dotted breakout measured move line is likely to be close to where the actual breakout occurs in which case the price target should be similar to what you see here. There is also a chance that we are given some sort of Black Friday or holiday discount, in which case price action dips below the weekly MAs momentarily….if so I personally think a retest of the bottom trendline of the brown triangle will be an optimal place for me to buy such a dip if I’m lucky enough for price action to retest it. If that were to happen the spot where the breakout eventually happens will have to be changed but it shouldn’t effect the price target too dramatically. Of course as always this is not financial advice and simply my strategy for my own holdings. Thanks for reading. Excited to see how this one pans out.

Legendary Golden Cross on XRP happening right at triangle apexThis chart screams bullishness. We are just a few weeks max from the apex of this symmetrical triangle on the xrpusd weekly chart and we are also about to have a weekly golden cross(where the orange line goes above the blue line) Doesn’t take a TA expert to see on this chart what tends to happen when this weekly Goldencross occurs on xrp. Obviously this isn’t financial advice but if I had to take a mildly educated guess of what the outcome with the highest probability of happening here is I’d simply say:UP!!!

Posted a chart of the XRP triangle fractalWe can see xrpusd is doing something very very similar for the past few years its been forming this massive triangle pattern that it did before the last time it had its massive breakout from a triangle that eventually led to its all time high. On the weekly chart we can see we are now very very close to the apex of this triangle and I have also superimposed a small screenshot of the triangle it broke up from. Back then as it does seem to be repeating itself here. If you zoom in you can see just before it broke up from the previous triangle it painted a big red wick to the downside to fake a lot. Of traders out of their positions before finally skyrocketing up and out of the triangle. This increases the odds that the fractal of that triangle we are in now might also have a big capitulation wick that dips below the current triangle first before the breakout upwards. If we are lucky enough to get a repeat of this fakeout tactic I know I will personally be buying such a dip. Speaking only for myself of course *not financial advice*

XRPUSD Weekly triangle currently retesting as exact wick supportEven though we are still inside the triangles on the logarithmic chart, we have now been above this key linear chart symmetrical weekly triangle now for 2 consecutive weekly candle closes, and sure enough the big dump that coincided with the SEC’s appeal found wick support right on the top trendline of this triangle retesting it currently as support. It’s certainly plausible that price could continue to fall back inside the linear chart symmetrical triangle here, however closing the currentl weekly candle above ot’s top trendline here and maintaining it as precise wick support would be such a bullish sign were it. To happen that then I would start wondering if the entire appeal thing might actually not go through because maintaining this as support should validate the breakout and send price action on its way up to find that $3.73 cent measured move target. Of curse still very probably we could dip back inside this triangle one more time as well, either way I thought it’d be a good idea to repost this triangle and also include a screenshot of the current wick support zoomed in. *not financial advice8

The weekly linear symmetrical triangle truncatedI wanted to post thesame triangle I posted in the previous idea,but instead of starting the top trendline from the ath in 2018 starting it from the second highest wick.I think both are valid but wanted to give this one its own separate chart since in doing so it makes both the top trendline of the triangle and the bottom have a more similar length and also gives me a easy red ,ove line that is tilted forward which could be useful should the dotted measured ove line start to act as additional support or resistance along the way to the target. Once again as I said in the previous idea, no breakout has been confirmed of this in ear triangle pattern just yet, but the current weekly candle is holding wick support exactly on the top trendline currently which is an optimistic sign. Still completely possible it loses that support but for now it seems post worthy so I can keep a close eye on it. *not financial advice*

2invh&s acting like Russian nesting dolls on XRPUSD chartNow that xrp has chosen to consolidate here for a few days it gives the chance for the potential blue inv h&s possiblity to form a right shoulder here, so I thought it was worth including, The smaller purple inner inverse head and shoulders patter is definitely legit and should have its breakout confirmed as soon as xrp has it’s next move to the upside. *not financial advice*

4 potential shorter timeframe triangles on rep 1wk log chartMy previous chart idea which I will link to below showed the monthly timeframe logchart of the 2 potential larger triangles xrp has been consolidating in, so I wanted to also follow that up with a weekly chart timeframe of the the 4 potential smaller triangles we have also been consolidating in so I can eep track of their progress as well. All the potential measured move ines here have been randomly placed so of course where ever it does break upward will likely be slightly different and will only require I readjust those measured move lines slightly at that point only changing their price targets slightly. *not financial advice*

XRP can breakout of logchart triangle once .59 is sold supportThe top trendline of this logarithmic weekly chart symmetrical triangle has played amazing resistance for quite some time now. However since that trendline is a descending one, the price that xrp’s price action needs to maintain as support gets lower and lower with every weekly candle close. Currently, if xrp can flip 59 cents to solidified support and maintain that support for multiple weekly candles it would validate the breakout. By next week’s candle it could be even lower. For the sake of the steroids 589 number that seems to be associated with XRP, it would be fun if the level needed to flip to support to break above was 58.9 cents imo. With the uptrend in the crypto bull cycle seemingly resuming here, the probability of XRP climbing above .589 in the near future and staying above it has greatly increased. Wouldn’t surprise me if the day it really blasts off and confirms//validates the breakout of this triangle coincides with something newsworthy like Gensler resigning or the SEC Ripple case being settled or even dropped. I anticipate a Bullish December, but perhaps even a quite bullish rest of november here as well for XRP It’s already off to a good start to the month so far and hopefully it can keep that momentum going. Always a chance at some sort of temporary Black Friday black swan discounts though so wise to stay vigilant. In order to get as zoomed in as possible on price action for this post, I cut the measured move target out of the frame, but if you were to drag the chart with your mouse(or finger if using a touchscreen) you will see that the target for the breakout of this log triangle is around $10.57 if it were to break above the triangle on the enxt few candles. *not financial advice*

Total3 chart breaking up from inverse head & shoulders patternThis is the chart that is every altcoin except for ethereum. Bitcoin is also not factored in. We can see it appears to have broken upward from the inverse head and shoulders pattern and the breakout target should be around 1.27 trillion. We also currently have the potential for a cup and handle to be formed with an even bigger breakout, but I want to see an actual handle forming first before I post a target for anything like that. *not financial advice*

Altcoins excluding Ethereum about to complete right shoulderBreaking above the neckline of this inverse head and shoulders can take the Others chart’s price action to around 670 billion. *not financial advice*

Vechain attempting to flip inverse h&s neckline to supportCan see here on the weekly timeframe chart how it’s already closed one weekly candl above the neckline.there have been many daily chart candles recently battling to main support on that neckline as well and also an impending golden cross on the daily chart time frame set to occur in tthe next 1-2 daily candles as seen here —-> blob:https://www.tradingview.com/e00ebf4c-9780-485c-a37a-9d603aec6fd4blob:https://www.tradingview.com/e00ebf4c-9780-485c-a37a-9d603aec6fd4 Since btcoin is still in the midst of it’s first correction since it has entered the parabolic phase of the bull run and we are so close to Black Friday which is often a time of year one can scoop up cryptos at a discount, this impending daily chart golden cross may be one of the few exceptions atelier where price action doesn’t immediately hav a big pump the same day as the cross. Vechain could always break apart from the pack though at that point as well and pump while most things are still correcting. Also a slight chance the market correction is over before Black Friday too. Whatever the situation may be, if we see Vechain correct here as well but also hold support on the daily timeframes 50ma,I will likely add a little bit to my Vechain stack *not financial advice*

For now SOLUSD is retesting invh&s neckline as precise supportA good sign that the bottom could potentially be in. Of course there’s always the possibility of some sort of unexpected bald swan to dump the market much further, but even then that could be such a temporary occurrence that by the time the weekly candle closed it still closed the candle body above this neckline. At the bare minimum I get the vibe that at least the monthly candle body can maintain this neckline as support, but we will find out soon enough. *not financial advice*

XRPBTC chart working on a double bottom breakout. Current weekly candle on the weekly xrpbtc chart is holding support right on the neckline of this double bottom pattern. If this candle closes and still maintains the neckline as support, and the follow up candle also maintains that support that should likely validate the breakout at that point. f so XRP should continue to make gains against bitcoin in the near future. *not financial advice*
