XAUUSD 4H – Full Technical & Fundamental Deep Dive🔷 Chart Structure & Trendlines
Since early June, gold has formed a clean descending channel on the 4‑hour chart. Each bounce and rejection has respected these channel edges, which reflect consistent lower highs and lower lows.
A long-term ascending trendline (from late March lows) was recently broken. This broken support has now flipped into resistance, and price is currently retesting it.
The intersection of the descending channel’s top, the trendline resistance, and the 200 EMA creates a major triple-confluence zone—a classic area of institutional interest.
🔷200 EMA
The 200 EMA on the 4H chart is acting as dynamic overhead resistance, which price is currently testing.
Historically, during bearish regime, retests of the 200 EMA from below often trigger strong rejections.
If price breaks above and holds, it would mark a significant shift in market sentiment. If rejected, it adds weight to the bearish trend.
🔷Fair Value Gap (FVG) & Supply Order Blocks
A Fair Value Gap (vicinity of $3,340–3,350) remains structurally unfilled from the previous breakdown.
Price is now re-entering that FVG region—an area often used by smart money to target liquidity and trap retail traders.
This is a logical zone for sell orders, as price frequently reacts where gaps exist.
🔷Volume Profile: High/Low Volume Nodes
A High-Volume Node (HVN) sits around $3,360, where most sustained trading has occurred. This acts as a strong resistance/distribution area.
The current zone ($3,330–3,340) is a low-volume pocket, meaning moves through here can be fast, but rejections are still frequently seen.
Below, there's another HVN around $3,280–3,290—a logical demand area and intermediate target for retracement.
🔷Fundamental Perspective – This Week to Friday
🔸 U.S. Fed Outlook & Dollar Dynamics
U.S. dollar is weak, with growing speculation on imminent Fed rate cuts, partly due to pressure from political sources
Fed remains cautious—no July cut likely, more probable in September
Persistent volatility in Fed messaging means gold remains in play as a hedge.
🔸 Geopolitical & Macro Drivers
Geopolitical tensions (Middle East, trade) continue to add safe-haven support
Central banks, especially Australia, are upping gold purchases—may add structural support
🔸 Market Sentiment & Investment Flows
ETF inflows remain robust—global central bank demand offsetting retail weakness
Some macro research houses expect sideways action into early July, with range likely between $3,200–3,350
🔸 Risks Ahead of Friday
Watch for U.S. jobs data, Fed speakers, and geopolitical headlines—any surprise could spark sharp moves.
If Fed hints at delays in rate cuts or geopolitical risk cools, gold could see a rapid reactive drop.
🔷🤔 Possible Scenarios into Friday
✅ Bearish Rejection
Price fails to clear $3,340–$3,360 zone.
A strong rejection candle retests $3,280–$3,290.
Could accelerate down to $3,240 if momentum picks up.
⚠️ Bullish Breakout
Clean, high-volume break above 200 EMA and $3,360 HVN.
Likely continuation to $3,380–3,400, especially if supported by fundamentals (e.g., inflation, Fed dovish pivot).
🔷My Personal Bias into Friday
Slight bearish lean due to triple resistance confluence.
Fundamentals are mixed: Fed caution supports gold structurally but no immediate catalyst.
I will monitor price action closely: a sharp rejection off the 200 EMA area would confirm suspicion; but a clean breakout would require reassessment.
200ema-rejection

USDJPY Setup: SHORT on 200 EMA Rejection📉 Best Risk/Reward Setup: SHORT on 200 EMA Rejection
🔻 Entry: Sell in the 148.50 - 148.80 zone after rejecting the 200 EMA (⚪)
🎯 Take-Profit (TP1): 146.50 (RRR: 5:1)
🎯 Take-Profit (TP2): 145.00 (RRR: 9:1)
🛑 Stop-Loss (SL): 149.20
📊 Market Overview & Bias
🟥 Bearish Outlook (Macro Trend - Daily & 4H)
✅ USD/JPY remains in a clear downtrend, trading below the 200 EMA (⚪).
✅ Price has consistently rejected the 100 EMA (🟡) as resistance.
✅ Lower highs and lower lows are forming on the daily & 4H charts.
✅ If 146.50 breaks, next downside targets are 145.00 and 143.50.
🟩 Short-Term Bullish Retracement (1H & 30M)
🔹 USD/JPY has found temporary support at 146.50.
🔹 RSI shows bullish divergence, suggesting a possible short-term bounce.
🔹 If price breaks 148.00, we could see a move toward 149.00 – but this remains a counter-trend move within a larger downtrend.
📉 Why This Trade?
🔻 Major resistance at the 200 EMA (⚪) and previous swing highs.
🔻 The macro trend is bearish, so selling rallies is safer than counter-trend longs.
🔻 RSI may enter the overbought zone, signaling a sell opportunity.
🔻 If price struggles at 148.50, expect another bearish impulse.
⚠️ Trading carries a high level of risk, and past performance is not indicative of future results. Always manage your risk carefully and never trade with money you cannot afford to lose. This is for educational purposes only and not financial advice.
💬 Do you think USD/JPY will respect the 200 EMA or break through? Drop your thoughts below! 👇🔥

Xauusd ShortUnder H4 and D1 200 EMA. Looking to drop towards Daily and Weekly support
Tp1-$1790.00
Tp2-$1700.00

BTC Testing the 200 EMAHello friends.
It seems like BTC price started the day with a downtrend movement, and went directly to test the 200EMA on the 1hr Time Frame.
Let's see if it can hold or reject.

EURAUD LONG MONTHLY TF
- We've seen price test the 200 EMA twice recently and fail to break it to the downside.
- The month is off to a very bullish start. Price is currently at a strong daily resistance. We might see price pullback then continue to the upside.
- The monthly RSI just crossed the 50 to the upside.
- MACD bullish crossover, downtrend dying down.
Pls like & subscribe if you find this helpful!
Disclaimer: This is in no way trading or financial advice.

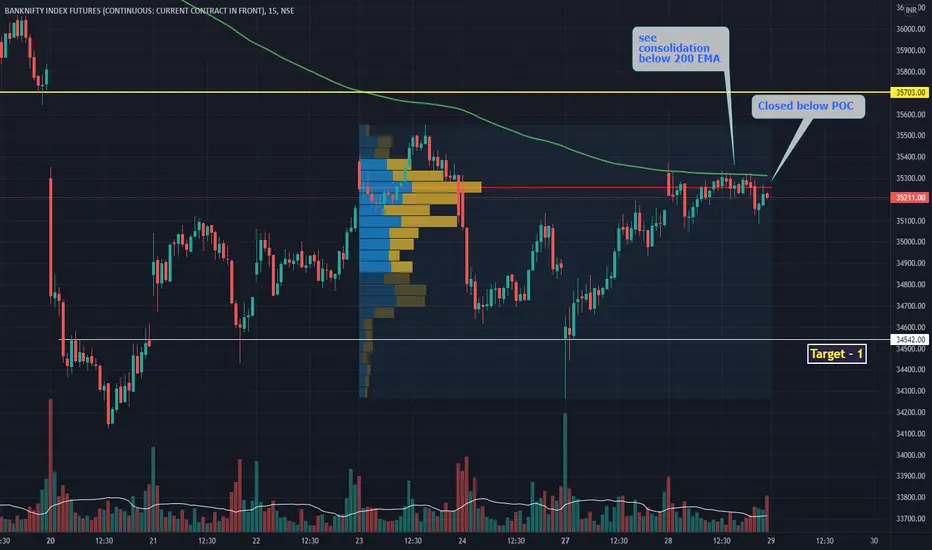
Bank nifty futureFixed range volume telling similar story. But we have to be very cautious for both of the sides. As 'Fakeouts' may come to trap retailers.
BNAK NIFTY 200 EMA ON DAILYNow you know what to do in this scenario.. Plan your trade according to risk management....

SUPER DUPER STRONG SUPPORTIT has taken a support of 200 ema
it also take support on trendline
it has taken a support on fibonacci 0.61% level

Butterfly Almost Complete Butterfly completes on the 200EMA, strong support and and order block, I'm going to wait for price to reach this level and wait for the reaction but this is looking like a 100% short, especially looking at the HTF PA! Then targets would be the D point of the Crab which also land down in a strong support zone in January before more rejection!

WIPRO 15 MIN as on 01.09.2021ASCENDING TRIANGLE PATTERN FORMED!!
Too many fake breakouts but Gave again one breakout!!
Taking a pull back and can move again!!
Do check volume!!
Target= 666.25/670
Stop Loss=635/630
200 EMA GIVING A GOOD SUPPORT!
(The above analysis is only for study purpose do not take it as any buy or sell call!!)

BTC Bouncing Around Between the 200 SMA and 200 EMA, Daily ChartThe chart shows the potential for some further sideways movement as a game of price ping pong plays out. Price seems to be respecting these two moving averages.

BTC updateBTC regardless of what has been said in news etc. has no power to push price higher.
Every attempt to go higher meets strong bearish candle.
BTC is still trading in channel. In my opinion the BTC will try to breach 30k again in near future. It might be short lived but whatever will happen it should established some more reliable support .
This chart for time being look like perfect example from the book, fully harmonic without any sudden spikes out of proportions

Silver Perfect signal for short Very simple setup for 2.6:1 Reward/Ratio. Let me point out the most important signals here and we have quite few on current chart:
• 200 Emma stopped further gains against dollar
• Followed by long bearish candle accompany with shooting star
• 50% of retracement after mayor drop.
The TP area is within the channel in which silver is traded for the last year.

GBPAUD Short (H4) POTENTIALLower highs and lower lows --- broke under 200ema and retested as resistance, looks like we have room to go down further to the key areas pointed out.
TRADING IDEA --- NOT AN INVESTMENT OPPORTUNITY -- DO NOT TRADE THESE!

Cardano PERPNicely back above the trend line and back at the range low. If we can claim the range low again, there is a very big chance that we are going to look for the range high again as we will have made a deviation and what we often see after a deviation is that the price is going to look for the other side of the range. Let's go ADA

POLS On The Edge of a BREAKOUT!Polkastarter has been respecting this triangle since it's all time high, the price action tried many time to break it but ended up by failing and we can see a strong support zone has formed below the price. On the 4h timeframe, the 200 EMA happens to pass by this support zone and the price can be clearly seen that it has tested it more than one time but failed in breaking through which adds confirmation to our trade idea. If the price breaks upwards we can expect it to reach 10$! Good Luck :)

EURCAD sharp fakeout + broken channel#EURCAD:
(1D):
The price here has been consolidating in a massive sideways formation for quite some time. Last week, a fakeout occurred, trying to break the 200 EMA as well but failed, drastically changing direction within the next day. Bearish structure was also broken, confirming the potential move to the upside, making our bias bullish.
(4H):
Zooming in, a clear bearish channel is presented, already broken, thus confirming a new HH. What we need to see now is a retracement back to our zone of interest, where we would look for a rejection for a final confirmation to the upside.

PFE : Not moving up, Why?PFE is a strong candidate for covid-19 vaccine and ahead in race. #Trump announced "Vaccine will be available soon". Then what is stopping #PFE for moving up? As I mentioned in chart $36 to$39 price range is a strong resistance. I'm waiting for breakout.
What do you think about this idea?
Feel free to ask any questions regarding this idea. Like and comment on this idea for encouragement.
Thank You!

USDJPY - Nearing the reversal zoneExpecting further downside on USDJPY - anticipating a reversal from the zone highlighted.
We may see a push up to meet the descending trendline/a rejection from the 200 EMA first - I will be monitoring this closely over the NY session.
A nice 200 pip drop to the July low could be achieved if this plays out to my expectations!

AUDCAD UPDATE This is a full breakdown of my perception of price action on higher time frames! I take my entries using smaller time frame confirmation and you should, too. If you have any questions about this trade or my strategies feel free to ask them in the comment section below!
Let’s make some money together!

GBPCHF price is stalling out on the 200 EMA will it drop? This is a full breakdown of my perception of price action on higher time frames! I take my entries using smaller time frame confirmation and you should, too. If you have any questions about this trade or my strategies feel free to ask them in the comment section below!
Let’s make some money together!


AUDJPY Will price make it back to the pivot? This is a full breakdown of my perception of price action on higher time frames! I take my entries using smaller time frame confirmation and you should, too. If you have any questions about this trade or my strategies feel free to ask them in the comment section below!
Let’s make some money together!
