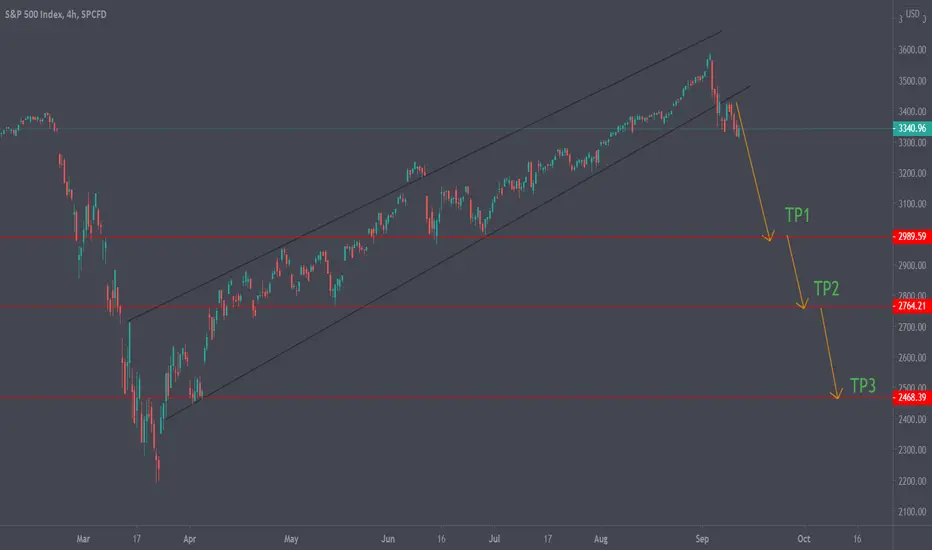
SPX - The second wave has started As we can see on the chart we have broken through the upward channel and we are ready for a correction. The correction on theory should have the TP1 target, but I think there is something else that could be going on. I have the following fundamental reasons for thinking that we will see much deeper drop:
- The elections are comming in America and this creates a lot of uncertainty, because of the different policies that could get implemented if whoever gets elected. This makes investors worried and they could pull their invesments out till all of this has cleared.
- The second wave of the virus has officialy started already in some countries like South Korea and also in Europe we see huge increase in new confirmed cases. There are many theories about a second wave in September which would be even stronger and this could scare investors aswell and pontetially close lead to closing down businesses which would triger even lower bottom.
- The stimulus packages are not going to last forever! They actually helped people through unemployment and also gave a little economy boost, but once it is over, people won't spend money and the economy will slow down again.
- There are many tenants who can't pay their rent and the landlords won't be able to recieve that rent, which they need to most likely pay for their mortgage, so this will lead to a chain reaction which will again slow down the economy and most likely cause housing crash.
- There are many people who can't repay their loans, because they don't have a job or stable income, so there would be a higher default rate on loans.
- The small businesses were damaged heavily by the virus and many of them won't recover, so this will hurt the economy and the people.
- The gains we saw in the market are unrealistic and right now everyone is just buying in without good fundamentals, so this is bound to fall sharp at one point or another, because the banks have to take out their profits. When this happens and it is most likely happening right now, the market will fall and wipe out as aways the retail investor.
My advice is don't short the economy just yet, rather be well diversified and reduce the risk! Make sure you have some money on the sidelines and be ready to buy into the market if we fall. Aways invest for the long-term and just be ready to buy more. Leave your comments bellow, if you like the idea give it a like!
2019

Options Idea: Sell The JD Oct 16 2020 62.5 Put @ $1.03JD has been in an ascending parallel channel since the COVID-19 peak in March and shows no sign of slowing down. I sold an October 16 2020 62.5 Put @ 1.03 near the bottom of the channel today with the idea that the uptrend will continue over the next couple months. This is one of China's biggest e-retailers and its been having a great time with extra sales due to the pandemic. Don't see any reason why that should stop anytime soon.
An alternative idea for a more aggressive trade would be to sell the $70 Put for a much larger credit. The $70 Put will be just below the bottom of the channel on the Oct 16 expiration.
20-JD-01
Opening Date: August 20, 2020
Expiration Date: October 16, 2020
DTE: 57
IV: 44%
IV Percentile: 36%
Odds of Winning: 80%
Win: > 61.47 @ Expiration
Loss: < 61.47 @ Expiration
Reg-T Margin @ Open: $720
Chart Legend
The green area represents 100% win zone.
The yellow area is a win, but we have to give back some of the initial credit taken in.
The red area is loss.
1 SD, 2 SD, 3 SD projections from Opening Date to Expiration Date are included.


12 Years a Slave - S&P ChannelI think the chart explains itself. We are at a critical moment. If price finds support on top of channel (making higher highs), then a new cycle outside of channel has begun. Expect another bull cycle?
If price does not find support on top of channel and is rejected, then we could come back down to the bottom of channel and re-test March lows.
This month will be critical to find out.

Bearish Divergence on monthly chart for the S&P 500 Any thoughts on the monthly bearish divergence on the S&P 500? It even goes all the way back to 2018. It looks obvious to me, but I'm open to discussion. If there's a big sell-off here I would of course expect the Fed and Gov to step in again and start spending money. This also coincides with the fact that the sugar from the last round of Fed and Gov stimulus is wearing off. Things could get ugly here, the whole market has been expecting a correction for quite some time now too. That is unless the Gov comes together and puts out a package before the sell-off.

RLFTF - Penny Stock Heating UpAnticipating some positive news from RLFTF's and further FDA approval for it's Aviptadil.
ABCDE Triagle wave approaching completion, confirmed by Williams Alligator, and Fib Retracement
A bounced off 0.382 level
C bounced off 0.5 level
Look for E confirmation off 0.618 level
Should price exit the triangle formation, setting target @ $1.2

[NVAX] Still holding - Novavax is first "safe" COVID vaccineThis proved to the market and world governments that their nanotechnology is superior and that it works. Next stop, flu vaccine. I'm holding.
Disclaimer: Not financial advice. Just my opinion. See my related posts.
Source: www.cnn.com

SPX Macro Outlook: Spring 2023 @ 1782 On the low time-frame the SPX has a blatantly obvious broadening wedge. This tends to be a bearish pattern, as volatility is increasing to the downside
more so than the upside. From a fundamental analysis perspective, the economy is valued at the highest it has ever been, but the economy is the worst it has been in almost a century. Something has to give...
On the high time-frame notice the trend line support extending more than 50 years to 1975! Assuming out broadening wedge plays out, and we retrace to a major support level, the pertinent question is where and when? I find it likely that the trend line support of our broadening wedge and the trend line support of the last 50 years converge at a critical point: Spring 2023 @ 1782
Analyzing the past two recessions yields interesting information. The 2000 Dot Com Bubble retraced 5.5 years of growth. The 2008 Housing Bubble retraced over 12 years of growth. Assuming the 2020 Everything Bubble retraces to that key support of 1780 and converges with two trend line supports, we will have wiped out over 7 years of growth.
Attached below is a chart made in 1875 identifying the length and magnitude of market cycles. As with any model, there is a degree of error. Nonetheless, it came pretty damn close to predicting the 1913 crash, Roaring 20's, Great Depression, WWII, 1970s stagnation, 1897 crash, housing crash, booming 2010s, and now 2020.
Chart: drive.google.com
Now, this model predicts this depression level correction to end in, you guessed it, 2023... Wow, that lines up with this analysis of Spring 2023 being the bottom @ 1782. How odd...

Gap fill for HoneywellPossible quick profits on a short position, but the trend is generally upwards. The gap could get filled quickly followed by a return to the upside due to increased sales of surgical masks in the COVID-19 pandemic.

LABU (XBI) LONG - Price Target: $70. Moving average convergence/divergence crossover on multiple timeframes, RSI rising quickly out of overbought area, price bounced off of a long term price support/resistance line.
Target $70 : Tight stop loss

if corona panic get over this is what will hapensif corona keep on media for more time, eu will consolidate and make a new high. This is my Personal Visionari View of the market futures.
Wish you the best "
peace and ligth


Novovax could see gains after COVID-19 vaccine orders roll in90 million vaccines have just been purchased by the UK government and the US is also in talks to purchase COVID-19 vaccines.


Looking for a break from bull flag for Johnson & JohnsonIf the Johnson & Johnson COVID-19 vaccine does well in final phase testing, this could cause the share price to break out from the current bull flag formation, if not we will see a break to the downside.

Wait and see for AstrazenicaThe price could go either way depending on the results from clinical trials of their Covid-19 vaccine.. so watch this space for confirmation either way.

Bullish outlook for ModernaI am looking for a breath through of resistance, followed by confirmation that the resistance becomes support as a signal to buy the next bull run for Moderna on the daily time frame.

Bitcoin vs COVID-19 - The pathway back to all time highs in $BTCAs the world entered its first pandemic in 100 years all financial markets cratered in early 2020. Even popular safe haven assets like $GOLD were not immune to the rush to liquidity amidst the panic and uncertainty. $BTC not widely known for its "safe haven" status also suffered the effects of this global liquidity squeeze. After 30 days of pain the fed ultimately injected trillions of dollars of liquidity into the financial markets while dropping rates to 0%. As the money printers go brrrrrr and the horrific economic data confirms the damage, investors and now seeking alternative safe havens for their cash as the purchasing power of all currencies is eroded by central bank money printing.
The fundamental case for Bitcoin has always been there. Bitcoin, like Gold is hard money. By design Bitcoin is a scarce asset. You cannot print more bitcoin, there is a finite supply. Bitcoin is a weapon to battle deflation and inflation.
Regardless of your opinion on Bitcoin my argument is this:
Bitcoin will capture a growing asset allocation from investors as a hedge over the coming years. Not just from internet kids and contrarian investors but major institutions. A small shift in this allocation will send Bitcoin to a 6 figure price.
The Chart:
Bitcoin has broken up from a major falling wedge pattern. The volume spike is a massive tell. You can easily see the final capitulation followed by a very strong move upwards. 10500 is a key level and trading above here would provide strong conviction.

Huge Price Target for CheggNYSE:CHGG
With students most likely sticking to a completely online course load this fall, CHEGG will be highly utilized for homework assignments and exam prep. I expect this stock to be close to a $200 stock by year end. First PT is $170.

It's a miracle, forget vaccines for COVID, death itself is cured10th Aug 2020 -48 deaths, okay: British people are resurrecting from the dead.

10 yrIm just thinking 3T stimulus from USA Trump bypasses congress to extend all benefits to Americans.
This is probably the news debt markets have been waiting for Fam.

[NVAX] Novavax: Preliminary studies produce promising resultsPreliminary studies on coronavirus vaccines have produced promising results.
I'm still a believer in their technology. Check out my previous NVAX posts and/or the first one. They have a promising technology that could revolutionize the vaccine industry. We (humanity) are already very behind in how we produce vaccines AKA using chicken eggs. So Novavax will hopefully pave the way for vaccines going forward.
Things to watch even after COVID-19:
- NanoFlu™
- ResVax™
- Recombinant Nanoparticle Vaccine Technology
- Matrix-M™ Adjuvant Technolog
TL;DR - To the moon and (probably) back lol
*Note: This is pure speculation and my own opinion*
NY Times: www.nytimes.com
CNBC: www.cnbc.com
