karman holdings (recent listing, new IPO)A chart view of the recent listing of Karman Holdings. The company appears to be headed in the right direction.
2025

Microstrategy (BTC wave)Microstrategy chart comparing Bitcoin lines to Microstrategy. The wave of Bitcoin and the ride that Microstrategy is on in connection with their initial interest of purchases and the following super investment after 2020.

ETH => Shift In Momentum Almost Done!Hello TradingView Family / Fellow Traders. This is Richard, also known as theSignalyst.
📉 Since breaking below its last major low in December 2024, Ethereum (ETH) has been stuck in a bearish trend.
But don’t lose hope, bulls! 🐂
⚠️It’s evident from the last correction phase, marked in blue, that it's larger than the previous ones — a clear sign that the bulls are stronger than ever.
A growing correction phase is often the first signal of an upcoming momentum shift.
This shift will be confirmed once ETH breaks above the last major high marked in red at $2,100.
📈A break above $2,100 would flip ETH’s trend from bearish to bullish, signaling the potential start of the Altcoin season!
Until then, patience is key. 🧘♂️
📚 Always follow your trading plan regarding entry, risk management, and trade management.
Good luck!
All Strategies Are Good; If Managed Properly!
~Rich

(LOFI) new to krakenAdded today to kraken, (LOFI) "live." Brand new. Been established since Nov 2024. It looks like a wooly blue frog thing meme based on the pepe frog meme. Icelandic version of Pepe? I don't like how Kraken does not offer 100% of the time a description about new coins. The same is true for Coinbase. Sometimes there is a description but sometimes there is no description. How can they offer a business model but not offer the complete up front package of short form information about a company. Seems like laziness to have all the documentation to list a coin but not take the amount of time is takes to copy and paste a quick description of the coin onto the user website.

BTC - From Bullish to Extreme Bullish...Hello TradingView Family / Fellow Traders. This is Richard, also known as theSignalyst.
🏢 BTC Building Blocks:
📈 Bullish:
BTC is currently trading within the second floor, between $92,000 and the previous all-time high (ATH) at $109,000.
As BTC retests the $96,000 demand zone, we’ll be looking for trend-following long setups!
📈 Extreme Bullish:
For the momentum to shift from Bullish to Extreme Bullish and enter the price discovery phase, a break above the previous ATH around $109,000 is needed.
📚 Always follow your trading plan regarding entry, risk management, and trade management.
Good luck!
All Strategies Are Good; If Managed Properly!
~Rich

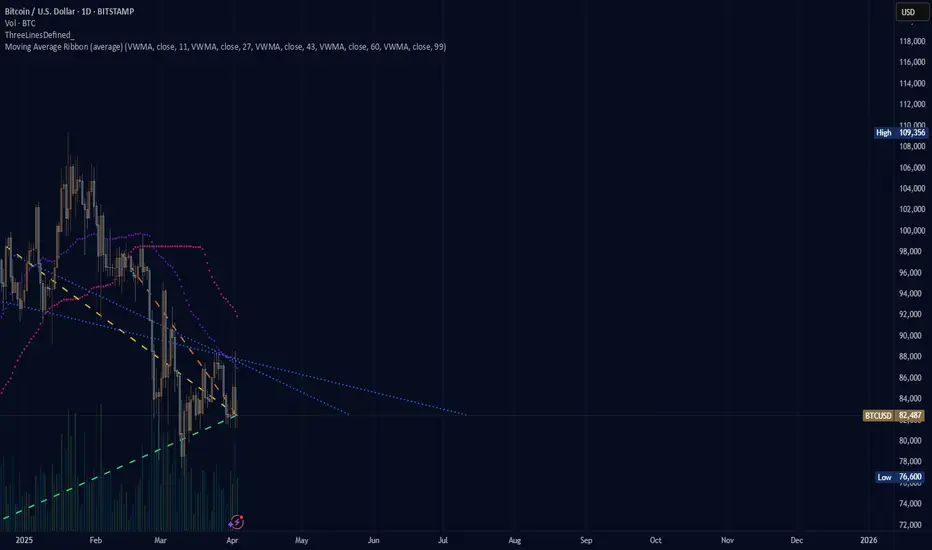
Later, Bitcoin!Bitcoin remains in a long-term bullish trend, but it currently appears significantly overvalued relative to gold. The recent breakout, followed by a re-test of the upsloping wedge formation, suggests that bullish momentum may be waning. This could indicate that capital is beginning to rotate out of Bitcoin. As a result, it may be more prudent to revisit the market in one to two years ahead. This shift may also mark the beginning of a potential altcoin season.

BTC - The Perfect Retest!Hello TradingView Family / Fellow Traders! This is Richard, also known as theSignalyst.
The picture says it all!
🔄Is history about to repeat itself?
If so, we are currently in Phase 2. 📈
What’s next? A dip toward the $87,000 - $88,000 zone would be the perfect retest to look for trend-following longs and expect the start of Phase 3.
📚 Reminder:
Always stick to your trading plan — entry, risk management, and trade management are key.
Good luck, and happy trading!
All Strategies Are Good, If Managed Properly!
~Rich

(PLUME) plume "new to kraken - secret"I noticed Plume became new to kraken but did not appear at the top of the newly listed tokens. Here is a post to share the information briefly about the plume token which I did not know of previous to today.

BTC - Two Bullish Scenarios...Hello TradingView Family / Fellow Traders! This is Richard, also known as theSignalyst.
📉 BTC has been overall bearish, trading within the falling channel marked in red.
The $70,000 area is a key confluence zone — it aligns with the lower red trendline, horizontal support, a psychological round number, and a potential demand zone.
📚 According to my trading style:
As #BTC approaches the blue circle zone, I’ll be looking for bullish reversal setups — such as a double bottom pattern, trendline break, and more.
🏹In parallel, for the bulls to take over long-term, and shift the entire trend in their favor, a break above the last major high marked in red at $88,888 is needed!
📚 Reminder:
Always stick to your trading plan — entry, risk management, and trade management are key.
Good luck, and happy trading!
All Strategies Are Good, If Managed Properly!
~Rich

AGLD/USDT — Accumulation Zone Setup 4-2025AGLD/USDT — Accumulation Zone Setup
Buy Zone: $0.80 – $0.60
Panic Key: Daily close below $0.50
Breakout Targets: $0.90 / $1.15
Long-Term Targets: $1.80 / $2.80
Low-cap project (Rank ~500), high volatility play.
Accumulation in progress — manage risk wisely.
Breakout above $0.90 could trigger momentum towards higher targets.
Note:
This is not financial advice but an analysis of coin movements. Conduct your own research and practice risk management before making any investment decisions. Remember, the cryptocurrency market carries significant volatility and risks.
Best wishes to all, we ask Allah reconcile and repay. 🙏

(PERP) perpetual "heightened activity in volume"Perpetual is showing an increase in volume for both sides of the table. This could be a sign of something to come that would otherwise be unexpected by most, perhaps a shot at a higher price. The bulk of activity is found in India 93% right now.

(JASMY) jasmy "sectioned macd - wave phase"As seen between the purple lines are the phases of the MACD with no overlap between each of the purple lines. The final bottom phase(5) was reached at which point the price rose to an astonishing 75%. Not sure if these purple lines will be of much use from here on out. I may delete them at some point.

(JASMY) jasmy "cycle-phase-wave"According to an enhanced MACD indicator that follows three layers of information I found the peak MACD green to line up with the yellow lines on the chart that are assigned with the next alternative colored line to be aligned with the most recent improvement in the otherwise losing price for the last months of time. Although an elliott wave is not seen I figured it would be possible to create a measurement like wave using an indicator to guide where those points should be.

(ETH) ethereum one day chart,. I confused the week chart setting for the day and found more optimism than there truly is. Still the line are converging and separating and creating time as a chart to distance oneself from reality only to get lost in the timeframes of trade.

(ETH) ethereum "triangle - slant"Ethereum is not priced for an only up direction as of right now, unlike Bitcoin. As seen in the chart and indicator. The pink and purple dotted lines are close to intersecting and if the pink link crosses over this is a good sign for the chance of a neutrality and even a possible upward forming price chart position.

15 April Nifty50 trading zone #15 April Nifty50 trading zone
#Nifty50 #Toady #TCS #NIFTYBANK #options
99% working trading plan
👉Gap up open 22910 above & 15m hold after positive trade target 23020, 23180
👉Gap up open 22910 below 15 m not break upside after nigetive trade target 22690 ,22492
👉Gap down open 22690 above 15m hold after positive trade target 22910, 23020
👉Gap down open 22690 below 15 m not break upside after nigetive trade target 22492, 22330
💫big gapdown open 22492 above hold 1st positive trade view
💫big Gapup opening 22022 below nigetive trade view
📌 Trade plan for education purpose I'm not responsible your trade
More education following me

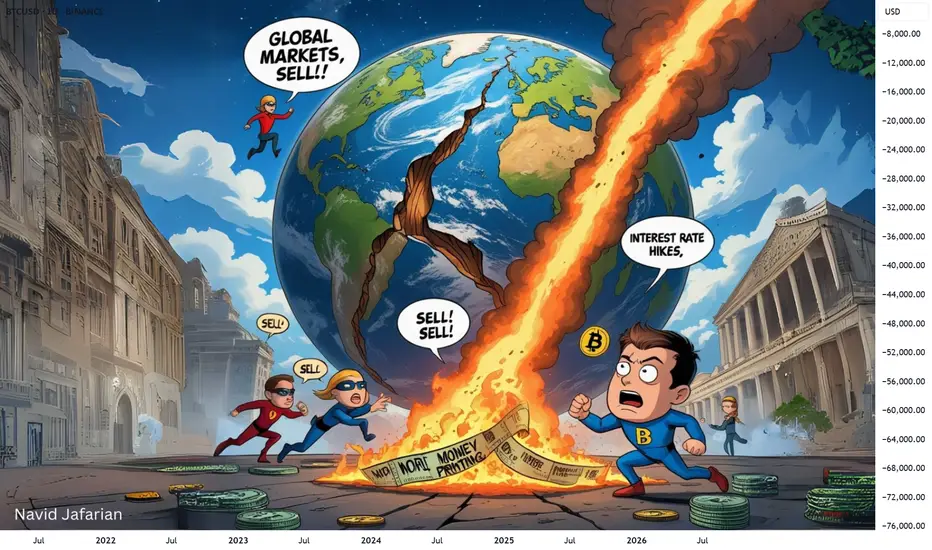
Global Markets Crashing: What Now?⚠️ Global Markets Crashing: What Now?
Don't panic , this is a worldwide event . Even big players are affected.
The important thing is to be patient and focus on future opportunities . We're hoping for a recovery in 2025.
We're holding on! ⏳
If you're experiencing losses right now , don't get discouraged, almost everyone is in the same boat . Even the largest funds managing billions of dollars are in trouble. Trillions of dollars are being wiped out from the world economy. Every country and every stock market is crashing. If you're thinking, 'My altcoin is dropping,' just look at how much ETH has fallen (18% in just one day).
Everything across the globe is falling , so it's natural that our market and investments will also fall. Don't feel bad if you didn't sell at the top in November or December; these are learning experiences for the future. Remember to take profit in the next uptrend.
Right now, all we can do is wait and hope for global issues to be resolved. Interest rate cuts and printing more money could bring a recovery in 2025.
S tay strong and make sure to take your profits if we see a big pump towards the end of the year.
We are also holding all our assets and waiting.
BTC - One More Leg...Hello TradingView Family / Fellow Traders!
This is Richard, also known as theSignalyst.
📉 BTC has been overall bearish , trading within the falling channel marked in red.
But the big question is — where could the potential bottom be?
👉 I’m watching the $70,000 zone!
Here’s why:
The $70,000 area is a key confluence zone — it aligns with the lower red trendline, horizontal support, a psychological round number, and a potential demand zone.
📚 According to my trading style:
As #BTC approaches the blue circle zone, I’ll be looking for bullish reversal setups — such as a double bottom pattern, trendline break, and more.
📚 Reminder:
Always stick to your trading plan — entry, risk management, and trade management are key.
Good luck, and happy trading!
All Strategies Are Good, If Managed Properly!
~Rich

(DOGE) dogecoin "fantasy"is the fantasy over for Dogecoin? The future version versus the present tense, versus the past, is something to speculate over and theorize on whether what people say about what happened in the past versus the past few months, is worth taking a look at. All the time in music people compress music and think the music is better afterwards. By applying the same logic to this Dogecoin chart I am sure all of you would say that you would prefer the uncompressed version.

(ATOM) cosmos "wave count"Long form wave count would appear to be in trend with an entirely new cycle for Cosmos, potentially, although I did not go all the way back to the origin of the company which is necessary to get a true depiction of history. Is the history of a company based on short lived moments or is there any knowledge to keeping track of the trend of a company through the entire duration of the chart regardless of what trends occur based on major moments in society and the seasonal hype from December and end of year excitement,.
Many years in the making. . .

(APT) aptos "ahead of the game, or not"It is not use in being ahead of the price trend if the price is not going to recovery before Bitcoin, Ethereum, Dogecoin. Dogecoin used to be the one to measure between the big three cryptocurrency prices. Nowadays, Dogecoin is so popular with such a strong price hold and the fact that the unlimited coins means to measure Dogecoin is quite a bit more strange when compared to all the other limited circulating supply companies. Aptos appears to be closer to a neutral position, or will the price keep falling if Etherum and Bitcoin do not go flat? That is what I mean by this.

(BTC) bitcoin "the case for bitcoin"Where is bitcoin going to be during this 2025 year. The image shows a blank canvas. The drawing untold, unknown for now? Where will the price move and how long will it take to move through the pattern, bearish? bullish? neutral? fire? ice? greener pastures? The graph showing what is being seen tends to see a rise in price once the price moves past the crossing of the blue lines but the purple and pink dotted lines are facing down with no indication that the price is moving neutrally in a recovery effort.
(ETH) ethereum "update"Ethereum update. Nothing per se to analyze. More of an image to share with two indicators. Not much else to say here. It would be better if the average lines (pink and purple) had dots closer together. The further those dots become on a descent, the higher the likelihood there is of a big drop in price. We want the purple line to begin to curve in a reversal pattern for the price to recover from what is losing right now. Huge discount on Etheruem though, if you like that sort of thing, and Ethereum.
