NEARUSDT Daily Chart Analysis|Strong Breakout & RSI ConfirmationNEARUSDT Daily Chart Analysis | Strong Breakout & RSI Confirmation
🔍 Let’s break down the latest NEAR/USDT daily chart, spotlighting critical resistance, target levels, and momentum signals.
⏳ Daily Overview
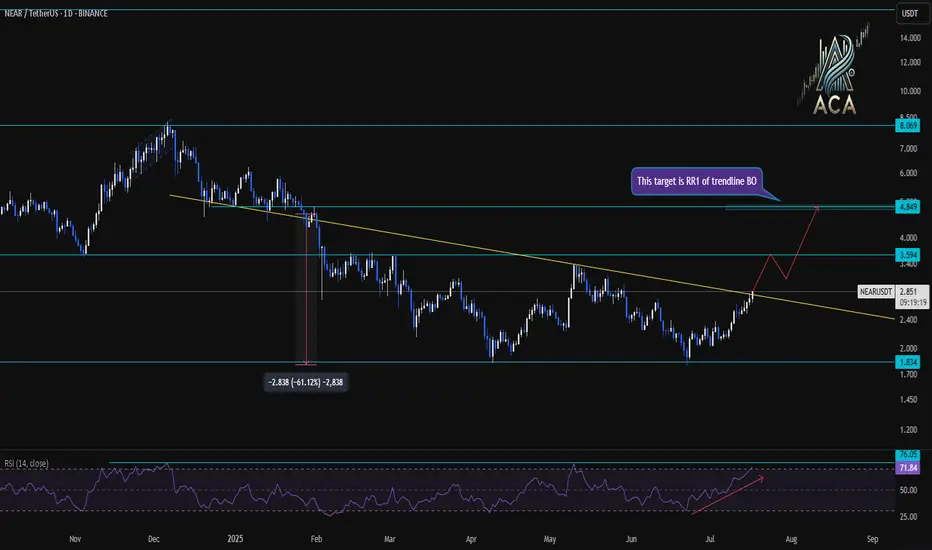
NEAR has confirmed a bullish breakout above its long-term descending trendline. This move comes with a surge in price and a strong daily candle—clear evidence of renewed bullish momentum.
📊 Momentum & RSI
RSI has surged to 76 (overbought zone), higher than the typical overbought level of 70. This spike reflects strong buying pressure, but also signals the possibility of near-term pullback or consolidation.
RSI-Momentum Convergence: The RSI uptrend is in lockstep with price action, confirming that bullish momentum is genuine and backed by increasing strength—not a divergence.
🔑 Key Levels
- First Resistance: $3.59—watch this closely as the next hurdle for bulls.
- Breakout Target: $4.85, which corresponds to the measured move (RR1) from the trendline breakout and aligns with the next horizontal resistance.
- Extension Target: $8.01 if momentum persists and price sustains above $4.85 in the coming weeks.
📌 Highlights
- Clear trendline breakout validated by strong RSI convergence.
- RSI has entered the overbought zone (76), backing momentum—watch for either breakout follow-through or brief cooling.
- Key levels: $3.59 (first resistance), $4.85 (breakout target).
🚨 Conclusion
Momentum is with the bulls after the breakout. Eyes on $3.59 as the near-term test; a clean move above opens up $4.85 and potentially $8.01 if momentum continues.
2025bullrun
Next top and bottomI exposing more future details. Dont be like the maxis and make sure to take some profits around October. Buy back around Nov 2026 to stack more sats for the long run

RSI suggesting a bear market comingThis is BTC and it's RSI. Bellow you can see LMACD applied on the RSI indicator to see the trend more clearly. We might be on the stage that we can see higher prices like in 2021, but the bear trend is already printed. Sell some now and buy back at 40k next year. Cheers

Pancake swing tradePancake is getting ready to release all the pressure that was build up inside of it.
we have vast amount of liquidity above us that we need to take.
Get ready! 🚀🌕
(You have the full responsibility for each action that u take because I'm not your financial advisor)

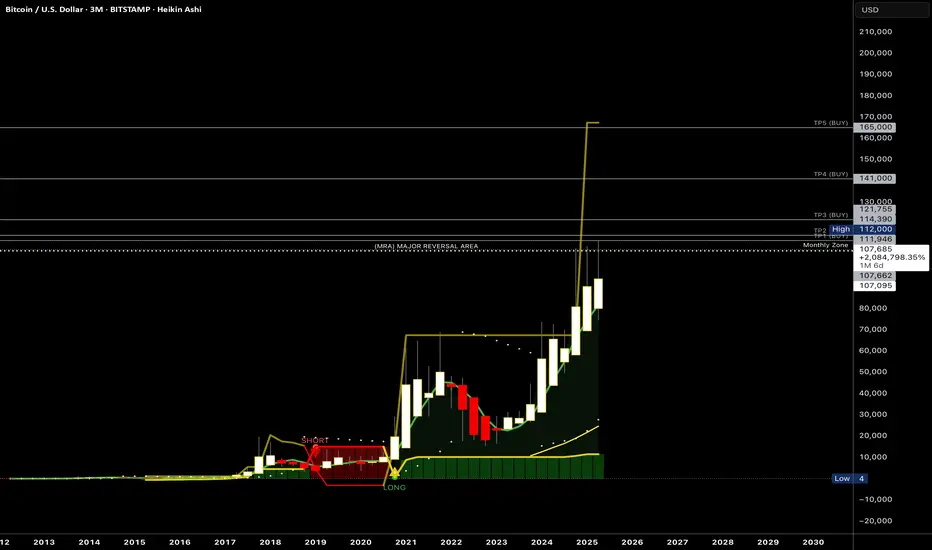
BTC Market Analysis for Q2BTC Market Analysis for Q2 - As we end the month the market tends to rescind. Pay close attention to the monthly and weekly zones. Price needs to break above the monthly zone. Let’s see if the month of June opens up above $107,700 that would indicate a continuation to the upside - possibly to $120-125K…
Cardano: The Longest Downtrend Ever Ends, Marketwide Bullish...The downtrend for Cardano vs Bitcoin (ADABTC) ended November 2024. If the uptrend last an entire year, 365 days, this would put a peak at around November 2025.
There is a dynamic where the end of the BTC pairs bullish trend happens before Bitcoin's peak price. That is because when you sell a BTC pair such as ADABTC you are automatically buying Bitcoin. With hundreds of those and trading at really high prices, massive selling can result in one final jump for the price of BTCUSD.
ADABTC ended its last bullish wave in August 2021. The bottom of the bear market that lasted more than three years, led to what I call the "initial bullish breakout." This is the first strong market reaction contrary to the previous trend. It signals the end of the downtrend.
This initial bullish breakout is always corrected and always ends in a higher low. There was a strong wick in early February 2025 but if we go by the candle close we have a very strong higher low. This is perfect bull market dynamics.
The higher low is in and consolidation has been going for months. What follows, is the continuation of the newly developing bullish cycle for this pair. A major advance that will end in a bull run.
From bottom to top, total growth will be huge for this BTC trading pair and with Bitcoin trading at such a high price, this has never been seen before. Cryptocurrency will be creating so many millionaires in early 2026 and late 2025, it is hard to fathom.
ADABTC is set to grow long-term. It can be five months, four months, six months, twelve months... I don't know, but it will be up, it will be strong and it will be great.
The bottom is in. The higher low is in. The consolidation phase is reaching its end. A strong advance is about to start now and when it starts, it won't stop until the end. One major push ending in a bull run phase.
People will be having dreams about how they missed the train, while others will be celebrating because they took action at the right time and decided to sell rather than waiting for forever higher and forever more.
When the bullish action becomes strong, watch-out for becoming too complacent. We tend to "fall asleep on the wheel," so to speak. We tend to see our paper profits and celebrate all the money we've made, but to make money you have to sell.
Money is not numbers on the screen, money is the paper (digits) that you can spend.
You know what I mean. We've been here before.
"Oh, I have a million dollars in my account," but you never sold a single coin. Then, in a day, in a flash, a market crash. What happens next? You don't know if it will recover or if it will continue lower, by the time you decide, your million is now 500K. By the time you decide to withdraw, it is already late 2026 and the market is hitting bottom, the start of the next long-term consolidation phase.
It will then take another four years before such a wonderful opportunity presents itself again. What are you doing now?
Are you going to theorize or will you take action?
Thanks a lot for your continued support.
This is a wake-up call.
You have what it takes.
All blessings to you,
Namaste.

DCR (SPOT )BINANCE:DCRUSDT
DCR / USDT
(4H + 1D) time frames
analysis tools
____________
SMC
FVG
Trend lines
Fibonacci
Support & resistance
MACD Cross
EMA Cross
______________________________________________________________
Golden Advices.
********************
* Please calculate your losses before any entry.
* Do not enter any trade you find it not suitable for you.
* No FOMO - No Rush , it is a long journey.
Useful Tags.
****************
My total posts
www.tradingview.com

ATOM (SPOT - INVESTMENT )BINANCE:ATOMUSDT
ATOM / USDT
(4H + 1D) time frames
analysis tools
____________
SMC
FVG
Trend lines
Fibonacci
Support & resistance
MACD Cross
EMA Cross
______________________________________________________________
Golden Advices.
********************
* Please calculate your losses before any entry.
* Do not enter any trade you find it not suitable for you.
* No FOMO - No Rush , it is a long journey.
Useful Tags.
****************
My total posts
www.tradingview.com

TIA ( SPOT)BINANCE:TIAUSDT
TIA / USDT
(4H + 1D) time frames
analysis tools
____________
SMC
FVG
Trend lines
Fibonacci
Support & resistance
MACD Cross
EMA Cross
______________________________________________________________
Golden Advices.
********************
* Please calculate your losses before any entry.
* Do not enter any trade you find it not suitable for you.
* No FOMO - No Rush , it is a long journey.
Useful Tags.
****************
My total posts
www.tradingview.com

ACE (SPOT - INVEST )BINANCE:ACEUSDT
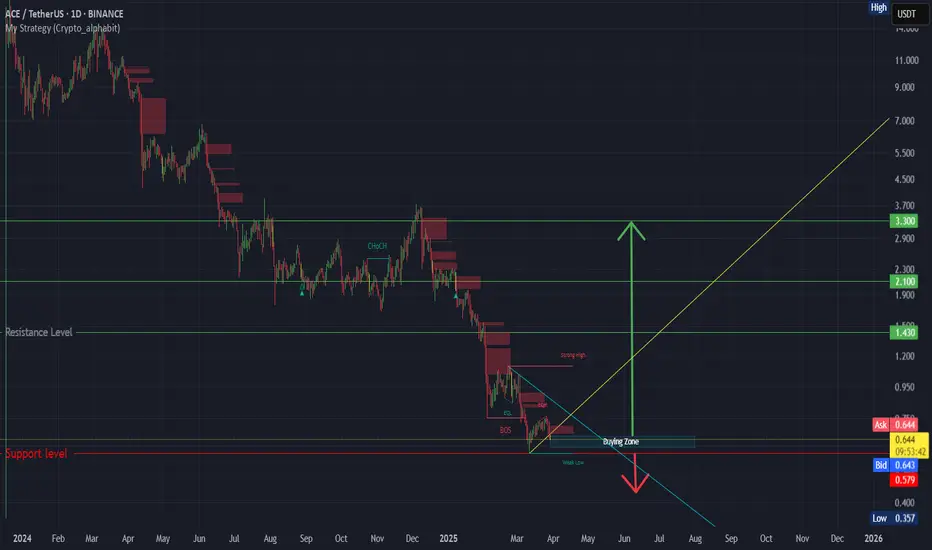
ACE / USDT
(4H + 1D) time frames
analysis tools
____________
SMC
FVG
Trend lines
Fibonacci
Support & resistance
MACD Cross
EMA Cross
______________________________________________________________
Golden Advices.
********************
* Please calculate your losses before any entry.
* Do not enter any trade you find it not suitable for you.
* No FOMO - No Rush , it is a long journey.
Useful Tags.
****************
My total posts
www.tradingview.com
W ( SPOT -INVEST)BINANCE:WUSDT
WLD / USDT
(4H + 1D) time frames
analysis tools
____________
SMC
FVG
Trend lines
Fibonacci
Support & resistance
MACD Cross
EMA Cross
______________________________________________________________
Golden Advices.
********************
* Please calculate your losses before any entry.
* Do not enter any trade you find it not suitable for you.
* No FOMO - No Rush , it is a long journey.
Useful Tags.
****************
My total posts
www.tradingview.com

WLD (SPOT)BINANCE:WLDUSDT
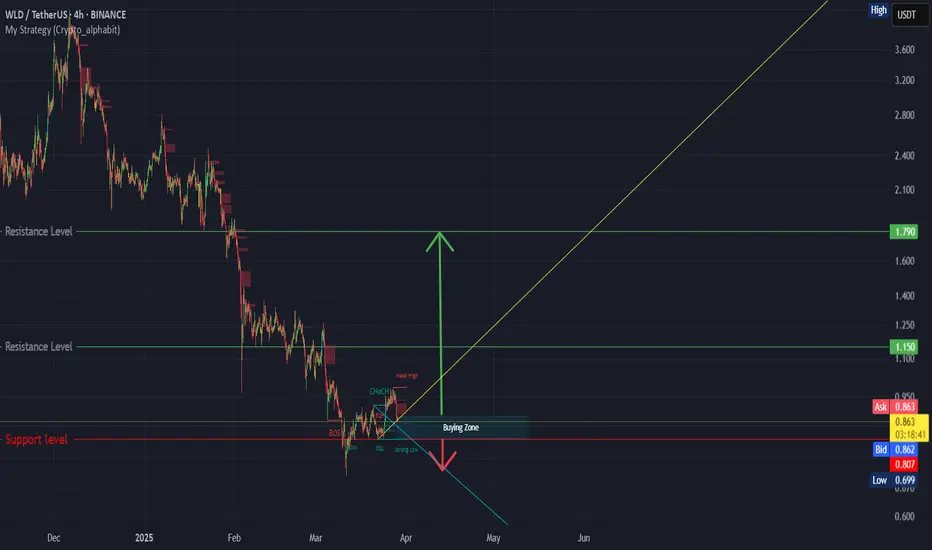
WLD / USDT
4H time frame
analysis tools
____________
SMC
FVG
Trend lines
Fibonacci
Support & resistance
MACD Cross
EMA Cross
______________________________________________________________
Golden Advices.
********************
* Please calculate your losses before any entry.
* Do not enter any trade you find it not suitable for you.
* No FOMO - No Rush , it is a long journey.
Useful Tags.
****************
My total posts
www.tradingview.com
Hook (SPOT)BINANCE:HOOKUSDT
HOOK / USDT
4H time frame
analysis tools
____________
SMC
FVG
Trend lines
Fibonacci
Support & resistance
MACD Cross
EMA Cross
______________________________________________________________
Golden Advices.
********************
* Please calculate your losses before any entry.
* Do not enter any trade you find it not suitable for you.
* No FOMO - No Rush , it is a long journey.
Useful Tags.
****************
My total posts
www.tradingview.com

DGB DGB / USDT
1D time frame
analysis tools
____________
SMC
FVG
Trend lines
Fibonacci
Support & resistance
MACD Cross
EMA Cross
______________________________________________________________
Golden Advices.
********************
* Please calculate your losses before any entry.
* Do not enter any trade you find it not suitable for you.
* No FOMO - No Rush , it is a long journey.
Useful Tags.
****************
My total posts
www.tradingview.com

$SP500 $SPX Is the bull run over?#SP500 SP:SPX S&P500
Is this just a bull-run retracement or the beginning of a bigger crash?
Is the bull run over?
Every major crash started with an “innocent” 10–15% pullback. 🧐
It’s difficult to draw any conclusions right now, but once the current bounce is over, the next retracement will give us more clues. ⏳👀
Are you bullish or bearish? 🐂 🐻

WIF (SPOT)BINANCE:WIFUSDT
WIF / USDT
4H time frame
analysis tools
____________
SMC
FVG
Trend lines
Fibonacci
Support & resistance
MACD Cross
EMA Cross
______________________________________________________________
Golden Advices.
********************
* Please calculate your losses before any entry.
* Do not enter any trade you find it not suitable for you.
* No FOMO - No Rush , it is a long journey.
Useful Tags.
****************
My total posts
www.tradingview.com

ALT ( SPOT - INVEST )BINANCE:ALTUSDT
ALT / USDT
1D time frame
analysis tools
____________
SMC
FVG
Trend lines
Fibonacci
Support & resistance
MACD Cross
EMA Cross
______________________________________________________________
Golden Advices.
********************
* Please calculate your losses before any entry.
* Do not enter any trade you find it not suitable for you.
* No FOMO - No Rush , it is a long journey.
Useful Tags.
****************
My total posts
www.tradingview.com

PIXEL (SPOT - INVEST) BINANCE:PIXELUSDT
PIXEL / USDT
1D time frame
analysis tools
____________
SMC
FVG
Trend lines
Fibonacci
Support & resistance
MACD Cross
EMA Cross
______________________________________________________________
Golden Advices.
********************
* Please calculate your losses before any entry.
* Do not enter any trade you find it not suitable for you.
* No FOMO - No Rush , it is a long journey.
Useful Tags.
****************
My total posts
www.tradingview.com

SCRT ( SPOT - INVEST)BINANCE:SCRTUSDT
SCRT / USDT
1D time frame
analysis tools
____________
SMC
FVG
Trend lines
Fibonacci
Support & resistance
MACD Cross
EMA Cross
______________________________________________________________
Golden Advices.
********************
* Please calculate your losses before any entry.
* Do not enter any trade you find it not suitable for you.
* No FOMO - No Rush , it is a long journey.
Useful Tags.
****************
My total posts
www.tradingview.com

RIF (SPOT)BINANCE:RIFUSDT
RIF / USDT
1D time frame
analysis tools
____________
SMC
FVG
Trend lines
Fibonacci
Support & resistance
MACD Cross
EMA Cross
______________________________________________________________
Golden Advices.
********************
* Please calculate your losses before any entry.
* Do not enter any trade you find it not suitable for you.
* No FOMO - No Rush , it is a long journey.
Useful Tags.
****************
My total posts
www.tradingview.com

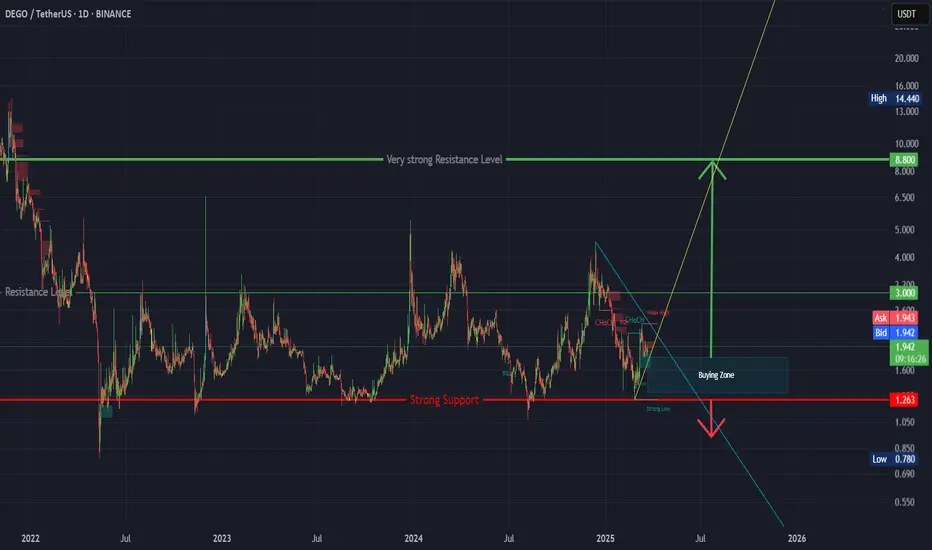
DEGO (SPOT)BINANCE:DEGOUSDT
DEGO / USDT
1D time frame ( wait for the price to come to buying zone)
analysis tools
____________
SMC
FVG
Trend lines
Fibonacci
Support & resistance
MACD Cross
EMA Cross
______________________________________________________________
Golden Advices.
********************
* Please calculate your losses before any entry.
* Do not enter any trade you find it not suitable for you.
* No FOMO - No Rush , it is a long journey.
Useful Tags.
****************
My total posts
www.tradingview.com
JOE ( SPOT)BINANCE:JOEUSDT
JOE / USDT
1D time frame
analysis tools
____________
SMC
FVG
Trend lines
Fibonacci
Support & resistance
MACD Cross
EMA Cross
______________________________________________________________
Golden Advices.
********************
* Please calculate your losses before any entry.
* Do not enter any trade you find it not suitable for you.
* No FOMO - No Rush , it is a long journey.
Useful Tags.
****************
My total posts
www.tradingview.com

PDA ( SPOT)BINANCE:PDAUSDT
PDA / USDT
4H time frame
analysis tools
____________
SMC
FVG
Trend lines
Fibonacci
Support & resistance
MACD Cross
EMA Cross
______________________________________________________________
Golden Advices.
********************
* Please calculate your losses before any entry.
* Do not enter any trade you find it not suitable for you.
* No FOMO - No Rush , it is a long journey.
Useful Tags.
****************
My total posts
www.tradingview.com
