Long EUR/NZD Here we have the EUR/NZD bullish wedge pattern where we think this will rise to around 1.78400 area,
Hope this helps everyone, if you have any other ideas comment below?
30min

GJ (GBP/JPY) Technicals +62 pips in 30 mins EC release
GJ (GBP/JPY) Technical momo setup +62 pips in 30 mins in my momo setup made +62 pips in 30 mins intra-day trading after release of economic calendar even it's release GBP is negative/bearish and JPY is positive and bullish.
Oversold os levels in vwap and momo stochastic crossover and reversal of momo squeeze, bounce back below vwap levels. High volume and volatility release scalp can made over +90 pips entering at fractals and EMA scalp signal.

GBP/CHF highly overbought GC GBP/CHF is very overbought as you can see in my MACZ-Vwap, DeMarker, CCI, momo Stoch, momo squeeze and RSI-EMA etc. it's for the pair going back to it's original bands and stop stretching itself.
FX:GBPCHF

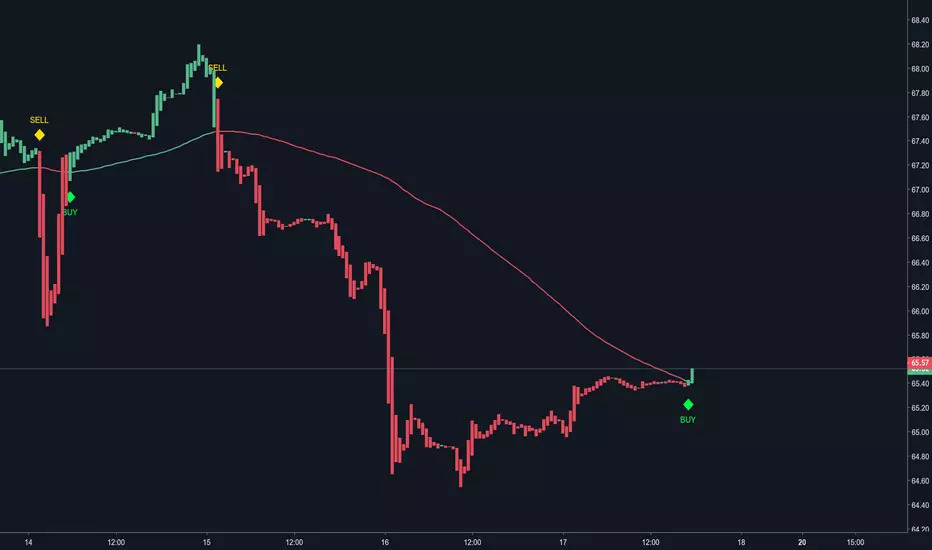
USOIL BUY OPPORTUNITY
Buy opportunity on USOIL .
Our Indicators are now showing a potential BUY opportunity for the USOIL asset.
Long position opened.
Lets see how this goes.
-CoderX
USD/TRY 30 min quick short setup Stochastic momentum index & Momentum squeeze showing strong sign for a consolidation

What is happening right now.. make sense of the marketThe only real way to understand the current status of the market is that we are trading around the Fibonacci line up.. the fight is stealth but strong between bulls and bears around this line.. at this moment we are above it.
i could be wrong,, everyone draw on chart from some different points..
this retracement was drawn on the 4 Hours chart and you see the 30 minutes candles..

Bearish BTC possibility One more update. Looks like this Lead line on the 30 minute cloud is actually quite relevant. We may just "Bart head" down from here without any sort of boost.

WAVES: UPDATE- 30 minute hidden bullish divergenceHere is the 30 minute hidden bullish divergence. Hopefully this can accelerate us out of the descending wedge for another breakout.

BTC boooooinnnngggg: 30 minute chartFrom what I charted quickly, looks like we have decent support in the green box. I'd like to see it push nicely through the added black horizontal line at 9444. I think that will be the first real test of resistance.

ONT: 30 minute chart. Bullish patterns. New trade entered!I've decided to re-enter ONT. The EMA crossing confirmed on 30min. Bull flag is still valid. A bull pennant has also formed. See new targets determined by Fibs (potential supports and resistance) flag pole lengths.
ROOKIE trader; Follow at your own risk!
-Solid horizontal orange line: I bought at that price
-Dotted horizontal orange line: mock buy, not in the trade yet
-Solid horizontal pink line: Stop loss/sell implemented
-Dotted horizontal pink lines: Targets

B I T C O I N : fill the volume trades !Hi, dear followers, investors and friends!
Short-term(30m) idea for YOU!
Expect 8600-8300.

BTC Analysis 4/6/18 Harmonics Of Market Indicate Buying Op.BTC has been holding today at the mid-6k critical support levels for the longest time since the selloff. In fact, this price hold is rather uncharacteristic of the bearish market patterns of the last few months. I tweaked the MA(100) to expose a more detailed periodic motion in the market. It's hard to deny the gut feeling that BTC prices should rebound. Emotions aside, the MA trend compares to similar trends right before a large price rebound, when the bears were dumping coins from 9k levels.
The correction could develop any moment or in a couple days. Granted, the bears have ruthlessly been targeting 6000, and there is nothing to confirm that the market is ready to fully rebound before then. I expect a dump shortly thereafter, but not before testing 7300.

AUDJPY another short followed by recent trendDouble or triple top bounced from 200 ema. Good R/R ratio

ABCD Pattern on AUDCAD - 30M. Bearish forecast. ABCD pattern detected on AUDCAD 30M time frame. Bearish forecast. Price aligns with previous resistances (H1, M30, M15)
SL @ 1.01340
TP 1 @ 1.00761
TP 2 @ 1.00345


NZDUSD BREAKOUT (SHORT) the NZDUSD is holding a support area in the 30M CD. the price is expected to reach a resistance area and go back to break the initial support.

EURUSD 30m Triangle BreakoutTriangle pattern on 4h - 2h - 30m
Watch for a 30m candle closed below bottom trendline
TP will be 4H 100 sma

eur/jpy short on 30timefram setupnice 30min short setups here on eur/jpy
guys don't missed it ..
i will update u later on.............
regards:
HAMZA MALIK


