PEPE: A 10x or a Hopeless Meme?
The price is currently testing the support zone between 0.00000054 and 0.00000039, an area that has previously acted as a strong demand zone. A hidden bullish divergence is forming on the RSI (7), where the RSI is making lower lows while the price remains relatively stable, suggesting potential exhaustion of selling pressure. Additionally, the RSI is in oversold territory, reinforcing the likelihood of a rebound.
Optimal entry points are within the 0.00000054 to 0.00000039 range, where buyers may start stepping in. Alternatively, a structural shift in lower timeframes could provide further confirmation before entering. The upside potential is significant, with the primary target set at the all-time high (ATH) of 0.0000283, presenting a high risk-reward opportunity.
👨🏻💻💭 This setup presents a solid case for a potential bounce. Are you prepared for the next move?
__
The information and publications within the 3Commas TradingView account are not meant to be and do not constitute financial, investment, trading, or other types of advice or recommendations supplied or endorsed by 3Commas and any of the parties acting on behalf of 3Commas, including its employees, contractors, ambassadors, etc.
3commas

The ADA Express – Next Stop: Moon
The price of ADA has maintained a bullish structure on the weekly timeframe, with the EMA Ribbon acting as dynamic support. Recently, the price successfully broke above the 0.73 resistance, which has now turned into a key support level. This move confirms the strength of the bullish momentum and provides an optimal entry point around 0.72, offering a favorable risk-reward setup.
If the price holds this level and confirms support, the next targets to consider are 1.32, where a significant resistance lies, followed by 3.10, which aligns with a potential trend continuation projection. As long as the bullish structure remains intact, the likelihood of reaching these levels remains strong.
Given the technical context, this zone offers an attractive opportunity for buyers. However, it is crucial to monitor the reaction at 0.7, as losing this level could invalidate the short-term bullish scenario.
👨🏻💻💭 What do you think about this analysis?
__
The information and publications within the 3Commas TradingView account are not meant to be and do not constitute financial, investment, trading, or other types of advice or recommendations supplied or endorsed by 3Commas and any of the parties acting on behalf of 3Commas, including its employees, contractors, ambassadors, etc.

The Calm Before the Moonshot?
BNB remains in a strong uptrend, maintaining higher highs and higher lows while staying above the bullish EMA ribbon. However, short-term momentum is bearish, making the support zone between $507 and $454 an optimal entry point for those looking to position themselves in the trend continuation. This area has historically acted as a strong demand zone, increasing the probability of a rebound.
If buyers step in and the price holds this level, the next targets are projected based on the current channel’s size, with potential upside levels at $1,165 and $1,640. This aligns with the broader bullish structure, offering an attractive risk-to-reward setup.
Traders should wait for confirmation of a reversal on LTF before entering long positions. If BNB maintains its structure within the channel, this could provide a solid opportunity for continuation.
👨🏻💻💭 Are you watching this level for a potential entry? Let me know your thoughts.
__
The information and publications within the 3Commas TradingView account are not meant to be and do not constitute financial, investment, trading, or other types of advice or recommendations supplied or endorsed by 3Commas and any of the parties acting on behalf of 3Commas, including its employees, contractors, ambassadors, etc.

If You Missed the Last Rally, This Might Be Your Shot
Bitcoin has broken below the 90K support level, turning it into a new resistance, marking a significant shift in market structure. Despite this, the EMA Ribbon remains bullish, signaling that the long-term trend is still intact. The Signal Builder has previously generated buy signals, reinforcing the idea that this could be a temporary retracement rather than a complete trend reversal.
Looking at historical price action, a similar pattern occurred when Bitcoin retested a breakout zone before resuming its upward movement. If history repeats itself, we could see the price revisiting the previous breakout area between 74K and 65K. This zone aligns with the long-term ascending channel that has been respected since November 2022, adding further confluence to this potential support area.
A strong reaction from this zone could provide a high-probability setup for a move back to the previous all-time high at 109K, and if bullish momentum continues, the Fibonacci extension suggests a potential target at 150K. For confirmation, traders should watch for structural shifts in price action, particularly a reclaim of key levels or a decisive breakout from resistance.
This level presents an opportunity for strategic positioning. Are we about to see a repeat of the previous cycle? Let’s monitor how Bitcoin reacts to this critical zone.
👨🏻💻💭 What’s your take on this setup? Do you see Bitcoin holding above support, or are we in for a deeper correction? Drop your thoughts in the comments.
__
The information and publications within the 3Commas TradingView account are not meant to be and do not constitute financial, investment, trading, or other types of advice or recommendations supplied or endorsed by 3Commas and any of the parties acting on behalf of 3Commas, including its employees, contractors, ambassadors, etc.

Is This the Best Buy Zone for DOGE?
Dogecoin has retraced to the key support level at 0.158, marking the beginning of an interesting buy zone between 0.158 and 0.089. This area offers an opportunity for buyers looking to maintain the bullish structure and potentially drive the price higher.
Entries in this range present a favorable risk-reward setup, with upside targets at 0.484, the previous high, and 0.859, which aligns with the 100% Fibonacci extension from the current low. The weekly EMA ribbon remains bullish, supporting the idea of a continuation to the upside. Additionally, the Signal Builder has previously triggered buy signals, reinforcing the potential for a bounce in this region.
If buyers step in and hold this support zone, Dogecoin could be setting up for another strong rally.
👨🏻💻💭 Are you positioning yourself for the next move?
__
The information and publications within the 3Commas TradingView account are not meant to be and do not constitute financial, investment, trading, or other types of advice or recommendations supplied or endorsed by 3Commas and any of the parties acting on behalf of 3Commas, including its employees, contractors, ambassadors, etc.

400 to 500 Zone – A Whale’s Playground
BINANCE:BNBUSDT CRYPTO:BNBUSD continues to follow a structure of higher highs and higher lows, signaling that the broader trend remains intact despite the recent pullback. Price is approaching the key support zone between 500 and 400, a range that coincides with psychological round numbers, an area where large market participants may step in to accumulate.
A strategic approach would be placing buy orders below 500 while implementing a Dollar Cost Averaging strategy down to 400 to smooth out entries in case of further downside. If the price confirms a reversal from this zone, the next targets align with 650 and ultimately 790, where prior resistance has been established.
The weekly EMA Ribbon remains bullish, providing dynamic support, which strengthens the probability of a continuation to the upside once this correction plays out.
Now the key question is whether buyers will defend this critical zone or if sellers will push for a deeper retracement.
👨🏻💻💭 What is your take, are you positioning for accumulation or waiting for further confirmation?
__
The information and publications within the 3Commas TradingView account are not meant to be and do not constitute financial, investment, trading, or other types of advice or recommendations supplied or endorsed by 3Commas and any of the parties acting on behalf of 3Commas, including its employees, contractors, ambassadors, etc.

$128 Support: The Line Between Relief and Disaster
BINANCE:SOLUSDT COINBASE:SOLUSD is currently testing the $128 support level, a crucial area that will determine its next move. If the price holds and buyers step in, we could see a rebound toward $195, where resistance is likely to be tested. However, a failure to maintain this level may lead to further downside, potentially reaching $82, the next major support zone.
For a clearer confirmation, traders should monitor lower timeframes for structural shifts, such as a break of recent swing highs or lows, which could provide additional validation for the next move.
👨🏻💻💭 Will SOL hold its ground and bounce back, or is another leg down incoming? The reaction at this key level will be critical!
__
The information and publications within the 3Commas TradingView account are not meant to be and do not constitute financial, investment, trading, or other types of advice or recommendations supplied or endorsed by 3Commas and any of the parties acting on behalf of 3Commas, including its employees, contractors, ambassadors, etc.

Bullish Flag Formation on XRP – A Rally to $4 in Sight?
BINANCE:XRPUSDT BITSTAMP:XRPUSD has been in a corrective phase after reaching its recent highs, forming what appears to be a bullish flag pattern. This structure suggests that the asset is consolidating before its next potential leg upward. The price has been repeatedly rejecting the support zone between $1.70 and $2.00, strengthening the case for this area acting as a key accumulation zone.
An optimal entry could be around the $1.70 level, as it aligns with the lower boundary of the support range and the pattern’s validation zone. If XRP manages to break out of the flag structure, the projected move based on the flagpole extension suggests a target of $4.00, offering a compelling risk-to-reward setup.
To confirm the trade before entering, traders could look for a structural shift in lower timeframes, such as a break in the current downtrend or strong bullish volume. If the pattern plays out as expected, this could set the stage for the next explosive move in XRP.
👨🏻💻💭 Will this bullish flag deliver? Time will tell, but the setup looks promising!
__
The information and publications within the 3Commas TradingView account are not meant to be and do not constitute financial, investment, trading, or other types of advice or recommendations supplied or endorsed by 3Commas and any of the parties acting on behalf of 3Commas, including its employees, contractors, ambassadors, etc.

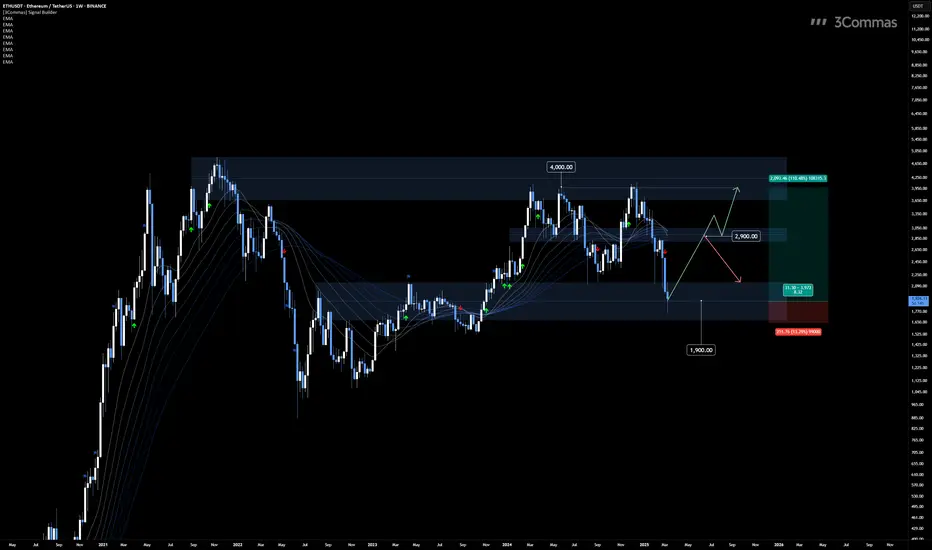
Ethereum Testing Key Support: Next Targets $2,900 and $4,000
The BINANCE:ETHUSDT BITSTAMP:ETHUSD chart on the 1W timeframe shows Ethereum testing a critical support level at $1,900, which aligns with the lower boundary of its ascending channel. This level has historically acted as a strong demand zone, making it a key area to watch for a potential bounce.
If ETH holds above $1,900, we could see a move toward the first resistance at $2,900, where price has previously faced rejection. A breakout above this zone would confirm further bullish momentum, with the next target at $4,000, aligning with the upper range of the channel.
However, if $1,900 fails to hold, Ethereum could continue forming lower lows, invalidating the bullish scenario. The next steps depend on confirmation signals from this key support level.
👨🏻💻💭 Will ETH bounce from $1,900 and push toward $4,000, or are lower prices ahead? Let’s discuss the potential next move!
__
The information and publications within the 3Commas TradingView account are not meant to be and do not constitute financial, investment, trading, or other types of advice or recommendations supplied or endorsed by 3Commas and any of the parties acting on behalf of 3Commas, including its employees, contractors, ambassadors, etc.
From $13.32 to $17.92: LINK’s Ping-Pong Price Action
The BINANCE:LINKUSDT COINBASE:LINKUSD chart on the 3D timeframe shows a well-defined range between $17.92 (resistance) and $13.32 (support), where price has been oscillating. Currently, LINK is testing the $17.92 resistance, a critical level that aligns with the EMA ribbon, reinforcing its importance.
If the price fails to break above $17.92 and starts rejecting this zone, a market structure shift on lower timeframes could confirm a move back down toward $13.32, keeping the range-bound behavior intact.
On the other hand, a clear breakout above $17.92 could invalidate the bearish scenario and open the door for a push toward higher levels.
For now, price remains below the EMA ribbon, suggesting that momentum is still on the bearish side unless buyers step in with strength.
👨🏻💻💭 Will LINK finally break above $17.92, or is another drop to $13.32 coming? Share your thoughts and let’s analyze the next move!
__
The information and publications within the 3Commas TradingView account are not meant to be and do not constitute financial, investment, trading, or other types of advice or recommendations supplied or endorsed by 3Commas and any of the parties acting on behalf of 3Commas, including its employees, contractors, ambassadors, etc.

A 1:5 Trade Setup? SUI’s Chart Looks Interesting
The BINANCE:SUIUSDT COINBASE:SUIUSD chart on the 1W timeframe presents a bullish structure despite the recent 70% retracement. The EMA ribbon remains upward-sloping, indicating that the long-term trend is still intact.
Currently, price is rejecting the $2.3680 support level, making this an area of interest for potential buyers. However, a deeper retracement toward $2.1349 could offer an even better entry opportunity, aligning with key historical price reactions.
A long position from $2.1349, targeting the previous all-time high at $5.3687, presents an attractive risk-to-reward ratio exceeding 1:5, making this a high-probability setup for traders looking to capitalize on a potential recovery.
The key confirmation for upside continuation would be a break of a recent swing high, signaling renewed bullish momentum.
👨🏻💻💭 Will SUI bounce from support and reclaim $5.36, or is there more downside ahead? Share your thoughts and let’s discuss the next move!
__
The information and publications within the 3Commas TradingView account are not meant to be and do not constitute financial, investment, trading, or other types of advice or recommendations supplied or endorsed by 3Commas and any of the parties acting on behalf of 3Commas, including its employees, contractors, ambassadors, etc.

AVAX at a Critical Support Level: Next Move Incoming
The BINANCE:AVAXUSDT COINBASE:AVAXUSD chart on the 1W timeframe is at a crucial decision point as it tests the $22 support level, a key area where price previously bounced. The strong wick rejections suggest buying interest, but the price remains within this range, meaning a breakdown is still a possibility.
If $22 holds, a long position targeting $38 offers a favorable risk-to-reward ratio of more than 1:3. For confirmation, traders might wait for a swing high formation, followed by a break to the upside, signaling renewed bullish momentum.
However, if $22 fails, the next significant downside target sits at $10, marking a major support zone where buyers could step in for a deeper accumulation phase.
This setup presents both bullish and bearish scenarios, making it a high-stakes area to watch.
👨🏻💻💭 Will AVAX defend $22 and push toward $38, or is a drop to $10 on the horizon? Share your thoughts and let’s discuss the next move!
__
The information and publications within the 3Commas TradingView account are not meant to be and do not constitute financial, investment, trading, or other types of advice or recommendations supplied or endorsed by 3Commas and any of the parties acting on behalf of 3Commas, including its employees, contractors, ambassadors, etc.

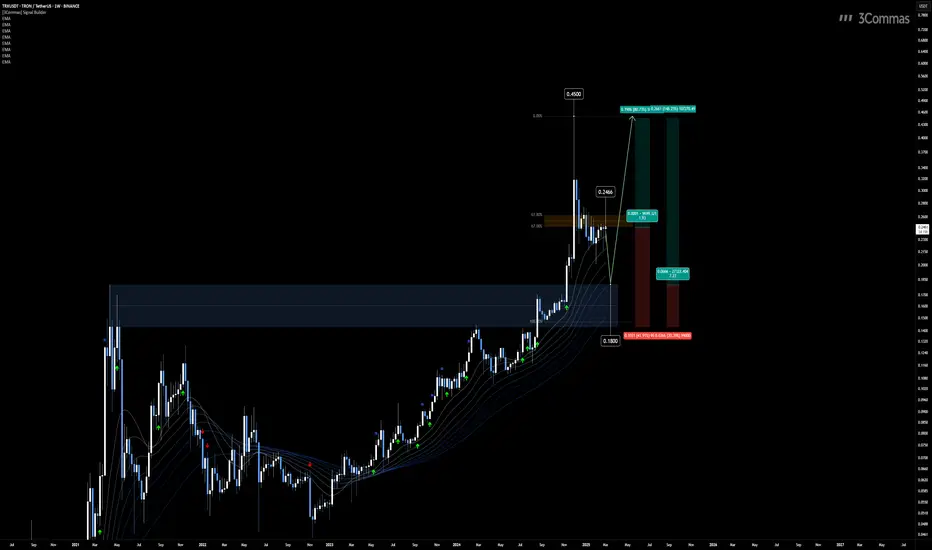
Will TRX Hold Above $0.2466 or Drop to $0.18 Before a Rally?
The BINANCE:TRXUSDT BINANCE:TRXUSD chart on the 1W timeframe maintains a bullish structure despite the recent retracement. The EMA ribbon remains upward-sloping, and the price is showing signs of rejection from this zone, reinforcing the broader uptrend.
Two potential entry zones stand out for a continuation to the upside. The first is $0.2466, aligning with the golden Fibonacci retracement zone, a key level where buyers may step in. The second is $0.18, a significant support level where the price previously broke through a major historical high. Both areas offer favorable setups targeting $0.45, the next major resistance level.
The market’s reaction at these key levels will determine the next move. A strong bounce could confirm a continuation toward $0.45, while a breakdown of these supports could shift the momentum.
👨🏻💻💭 Which entry do you favor? Will TRX hold above $0.2466 or revisit $0.18 before its next leg up? Let’s discuss your outlook!
__
The information and publications within the 3Commas TradingView account are not meant to be and do not constitute financial, investment, trading, or other types of advice or recommendations supplied or endorsed by 3Commas and any of the parties acting on behalf of 3Commas, including its employees, contractors, ambassadors, etc.
Rejection at Resistance Could Send BTC to $71,500
The BINANCE:BTCUSDT chart on the 1D timeframe presents a critical moment as Bitcoin remains below the EMA ribbon, which has now turned bearish. This signals a potential continuation of the downward momentum unless bulls regain control.
Currently, the price is rejecting the previous support level, now acting as resistance, reinforcing the bearish case. If BTC fails to reclaim $95,000, the probability of further downside increases significantly.
If the rejection at this resistance level continues, the next key support zones to watch are $81,500, followed by the major support at $71,500. The latter serves as a strong accumulation zone where buyers may step in for a potential rebound.
👨🏻💻💭 Will BTC manage to reclaim $95,000 and shift back to bullish, or are we heading toward $71,500? Share your thoughts and let’s analyze the setup!
__
The information and publications within the 3Commas TradingView account are not meant to be and do not constitute financial, investment, trading, or other types of advice or recommendations supplied or endorsed by 3Commas and any of the parties acting on behalf of 3Commas, including its employees, contractors, ambassadors, etc.

Is This SHIB’s Last Chance Before a Major Move?
The BINANCE:SHIBUSDT chart is approaching a key support level at 1107, a zone where the price previously rebounded with strong bullish momentum. This level aligns with oversold conditions, making it a potential area for accumulation and a possible price rejection to the upside.
Looking at historical behavior, SHIB has shown similar bounce patterns, suggesting that a recovery from this level could target the next resistance zones at 1673 and 2798. If buyers step in again, these price levels present a structured roadmap for potential upside movements.
For confirmation, traders can wait for a break of a recent bearish swing high to indicate a trend shift, or monitor lower timeframes for market structure reversals once price reaches 1107, signaling a higher probability of a rebound.
👨🏻💻💭 Will SHIB repeat its previous bounce and push toward 1673 and 2798, or are we in for more downside? Share your thoughts below and let’s discuss the setup!
__
The information and publications within the 3Commas TradingView account are not meant to be and do not constitute financial, investment, trading, or other types of advice or recommendations supplied or endorsed by 3Commas and any of the parties acting on behalf of 3Commas, including its employees, contractors, ambassadors, etc.

DOT’s Discount Zone Could Fuel the Next Big Move
The BINANCE:DOTUSDT chart is trading within a key accumulation and discount zone, making this a critical level for long-term positioning. Historically, this area has acted as a strong support, suggesting that it could be an optimal entry point before a potential upward move.
The support zone around $4.37 has been tested multiple times, reinforcing its significance. If buyers step in at this level, the projected upside targets stand at $11.80 (+140%) and $23.06 (+350%), offering substantial profit potential.
The EMA ribbon reflects the ongoing consolidation, confirming that the price is still within a structural range. Given this, entering near the lower boundary of the channel increases the likelihood of a successful trade, aligning with historical reactions at this level.
👨🏻💻💭 Will DOT continue accumulating at this key support before making a big move, or are we in for a deeper correction? Share your thoughts and let’s analyze the setup together!
__
The information and publications within the 3Commas TradingView account are not meant to be and do not constitute financial, investment, trading, or other types of advice or recommendations supplied or endorsed by 3Commas and any of the parties acting on behalf of 3Commas, including its employees, contractors, ambassadors, etc.

LTC Holds Key Level as Uptrend Gains Strength
The BINANCE:LTCUSDT OANDA:LTCUSD chart is showing a strong bullish structure after breaking above the $115 resistance, which is now acting as support. The price is currently testing this level, and as long as it holds, the bullish outlook remains intact.
From a technical perspective, Litecoin is trading above the EMA ribbon, and the ribbon itself is sloping upwards, reinforcing the ongoing uptrend. Additionally, the True Strength Index (TSI) is above the zero level and its moving average, indicating strong bullish momentum and increasing the probability of further upside.
With the $115 level confirmed as support, the next key target is at $225, where a significant resistance zone is located. If buying pressure continues, this would be the next logical area for price to test.
👨🏻💻💭 Will LTC hold $115 as support and continue toward $225, or is a deeper retracement needed first? Let me know your thoughts and let’s discuss!
__
The information and publications within the 3Commas TradingView account are not meant to be and do not constitute financial, investment, trading, or other types of advice or recommendations supplied or endorsed by 3Commas and any of the parties acting on behalf of 3Commas, including its employees, contractors, ambassadors, etc.

Will PEPE Hold 686 Support and Rebound to 1234?
The BINANCE:PEPEUSDT CRYPTO:PEPEUSD chart is approaching a key support level at 686, an area where price has previously reacted with strong bullish momentum. The current structure suggests that buyers might step in again at this zone, making it a potential area of interest for long entries.
The Stochastic Oscillator is signaling an oversold condition, with a bullish crossover forming. This indicates that selling pressure may be weakening, increasing the probability of a reversal. If the price finds support at 686, a long position with a stop-loss below this level presents an attractive risk-to-reward ratio targeting the 1234 resistance level.
For additional confirmation, traders could wait for a break of a recent swing high to signal momentum shifting in favor of buyers. Another approach is to monitor lower timeframes for market structure reversals once the price reaches 686, ensuring a more refined entry.
👨🏻💻💭 Will PEPE bounce from 686 again and target 1234, or will sellers take control? Let me know your thoughts below!
__
The information and publications within the 3Commas TradingView account are not meant to be and do not constitute financial, investment, trading, or other types of advice or recommendations supplied or endorsed by 3Commas and any of the parties acting on behalf of 3Commas, including its employees, contractors, ambassadors, etc.

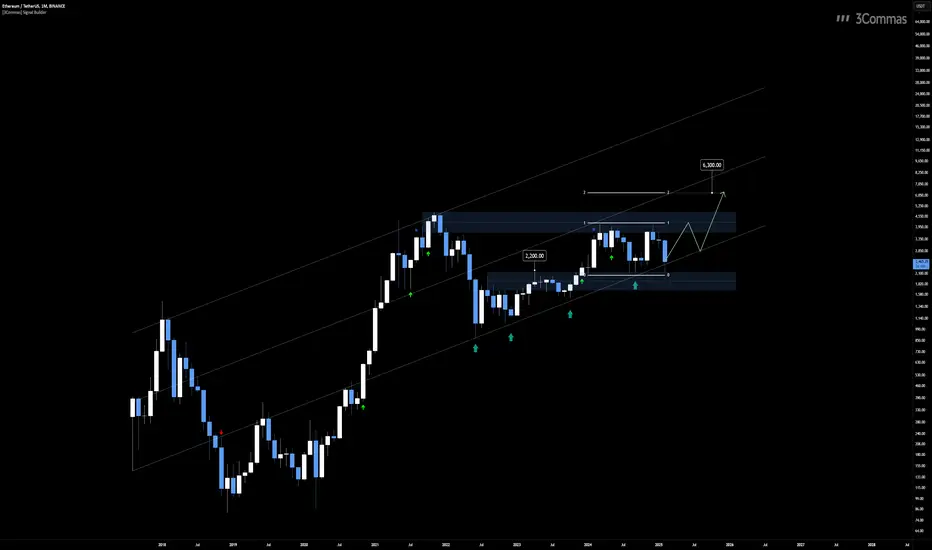
Is Ethereum Ready to Bounce from the Channel Low?
The BINANCE:ETHUSDT BITSTAMP:ETHUSD chart shows Ethereum trading near the lower boundary of the ascending parallel channel, with the $2,200 level serving as a key support zone. This area is particularly significant as it aligns with previous resistance turned support, making it an attractive entry point for long-term buyers.
Historically, ETH has respected this lower channel trendline, bouncing off it on multiple occasions. The current price action suggests that the pattern remains intact, reinforcing the possibility of another upward move from this region.
If the price holds and momentum builds, projecting the width of the current consolidation channel gives an estimated upside target near the $6,300 level. This aligns with the channel’s upper boundary and represents a potential long-term target should the bullish scenario unfold.
👨🏻💻💭 What’s your plan? Will ETH hold $2,200 and climb toward $6,300, or is more consolidation ahead? Share your thoughts and let’s discuss potential strategies!
__
The information and publications within the 3Commas TradingView account are not meant to be and do not constitute financial, investment, trading, or other types of advice or recommendations supplied or endorsed by 3Commas and any of the parties acting on behalf of 3Commas, including its employees, contractors, ambassadors, etc.
Bitcoin at a Crucial Level: $89,000 or $69,000 Next
The BITSTAMP:BTCUSD BINANCE:BTCUSDT chart is approaching a pivotal moment with the monthly candle nearing its close. If the price closes below the critical $89,000 level—the previous low that led to the all-time high (ATH)—it could trigger a drop toward the next major support at $69,000. This level holds significant importance, not only for its historical role as a key pivot but also as an optimal entry point for long-term positions.
Historically, Bitcoin has shown a tendency to retrace back to the trendline, and the current structure suggests this pattern may repeat. A bounce from the $69,000 zone could present an attractive long-term buying opportunity. Traders may look for either an immediate reaction at this level or wait for confirmation by breaking the next swing high after the rebound.
Despite the short-term risks, the monthly EMA ribbon remains bullish, with the price holding above it, reinforcing the long-term uptrend. If the bullish scenario plays out, the next significant target is projected at $128,000, derived from the Fibonacci extension of the previous bullish cycle. This level aligns with the long-term upward trajectory and could be the next destination if Bitcoin regains momentum.
👨🏻💻💭 What’s your game plan? Will BTC hold above $89,000 and target $128,000, or are we heading for a retest of $69,000 before the next leg up? Share your thoughts below and let’s discuss!
__
The information and publications within the 3Commas TradingView account are not meant to be and do not constitute financial, investment, trading, or other types of advice or recommendations supplied or endorsed by 3Commas and any of the parties acting on behalf of 3Commas, including its employees, contractors, ambassadors, etc.

Is Bitcoin Preparing for a Bounce or a Breakdown?
The BITSTAMP:BTCUSD BINANCE:BTCUSDT chart presents a critical juncture where the price is currently trading below the EMA ribbon, which has started to tilt bearish, hinting at potential downside pressure. For the bulls to regain control on the daily timeframe, Bitcoin must hold above the key level of $95,500, which aligns with the volume point of control (POC) of the channel. A break above a recent swing high could revive the bullish scenario and push the price toward the upper range.
On the downside, the $90,000 level, which serves as the neckline of a well-formed double top pattern, is the next area to watch. If this support breaks with a weekly close below it, the probability of further downside increases, potentially dragging the price down to the $70,000 region. This zone is particularly significant due to several confluences: it aligns with the weekly POC, the 61.8%-67% Fibonacci retracement (golden pocket) of the previous bullish impulse, and the previous resistance turned support level. Additionally, projecting the double top’s measured move also points toward this $70,000 area, further solidifying it as a potential accumulation zone.
If Bitcoin does reach the $70,000 level, it could offer an attractive risk-to-reward opportunity. The EMA ribbon on the higher timeframe (weekly chart) remains bullish, suggesting that a bounce from this area could spark a reversal, potentially targeting a move back toward the $110,000 mark.
👨🏻💻💭 What’s your take? Will BTC hold above $95,500 and push for new highs, or are we headed for the $70,000 zone for a deeper correction and potential buy opportunity? Share your thoughts below and let’s analyze it together!
__
The information and publications within the 3Commas TradingView account are not meant to be and do not constitute financial, investment, trading, or other types of advice or recommendations supplied or endorsed by 3Commas and any of the parties acting on behalf of 3Commas, including its employees, contractors, ambassadors, etc.

Volume Zones Define LINKUSDT’s Next Move
The BINANCE:LINKUSDT chart shows the price still trading within the channel after a clear liquidity grab. The EMA ribbon remains bullish, indicating potential upward momentum, but critical levels need to be maintained for a sustained trend.
Currently, the 17.92 level serves as a key support within the channel. If the price holds above this level, we could see a potential retest of the upper resistance at 26.45. However, for a confirmed bullish trend, the price must sustain itself above 24.13, which represents the Point of Control (POC) of the channel — the level where the highest volume has been traded, making it a crucial area for validation.
On the downside, if the price breaks below 17.92, it opens the door to lower levels. The next significant volume zones are at 14.62 and 11.42, where price reactions would need to be reassessed for potential accumulation or further downside.
The immediate focus is on how the price reacts to the 17.92 support. A bounce and subsequent break of recent highs could present an attractive long opportunity, while a failure could lead to a shift in the market structure.
👨🏻💻💭 What’s your take on LINK’s next move? Will it hold the channel or dive to lower supports? Share your thoughts and let’s strategize!
__
The information and publications within the 3Commas TradingView account are not meant to be and do not constitute financial, investment, trading, or other types of advice or recommendations supplied or endorsed by 3Commas and any of the parties acting on behalf of 3Commas, including its employees, contractors, ambassadors, etc.

XRPUSD Tests Critical Support at 2.4690
The BITSTAMP:XRPUSD chart demonstrates a significant rejection and liquidity grab at the 1.9233 level, marking it as a critical point for future price action. This level appears to have acted as a strong support, fueling the subsequent bullish push. Currently, the EMA ribbon remains in a bullish structure, supporting the continuation of the upward trend.
The price has tested and bounced off the 2.4690 level, which is now serving as a critical support zone. As long as the price sustains itself above this level, the bullish outlook remains intact, with potential upside targets towards the next resistance levels. However, failure to hold above 2.4690 could lead to a revisit of the 1.9233 zone, where another liquidity event may occur.
The overall structure indicates bullish momentum, but traders should closely monitor the reaction at 2.4690 to confirm the trend's continuation or anticipate a deeper pullback.
👨🏻💻💭 What’s your take on XRP’s next move? Will it hold the bullish momentum or revisit the lower levels? Share your thoughts and let’s discuss!
__
The information and publications within the 3Commas TradingView account are not meant to be and do not constitute financial, investment, trading, or other types of advice or recommendations supplied or endorsed by 3Commas and any of the parties acting on behalf of 3Commas, including its employees, contractors, ambassadors, etc.
