BTC – Still looking heavy below key resistanceDespite a short-term relief bounce after Monday’s drop, BTC remains below the critical 1D MSS + S/R (red box). Structure is weak until this level is reclaimed. Bears remain in control as long as price can’t close above 115.7k.
Plan:
Maintain bearish bias while below the red box — expecting new lows, targeting the green demand/OB cluster around 108.3k.
Flip the red box (close above 115.7k) and the outlook shifts to neutral or bullish.
3d

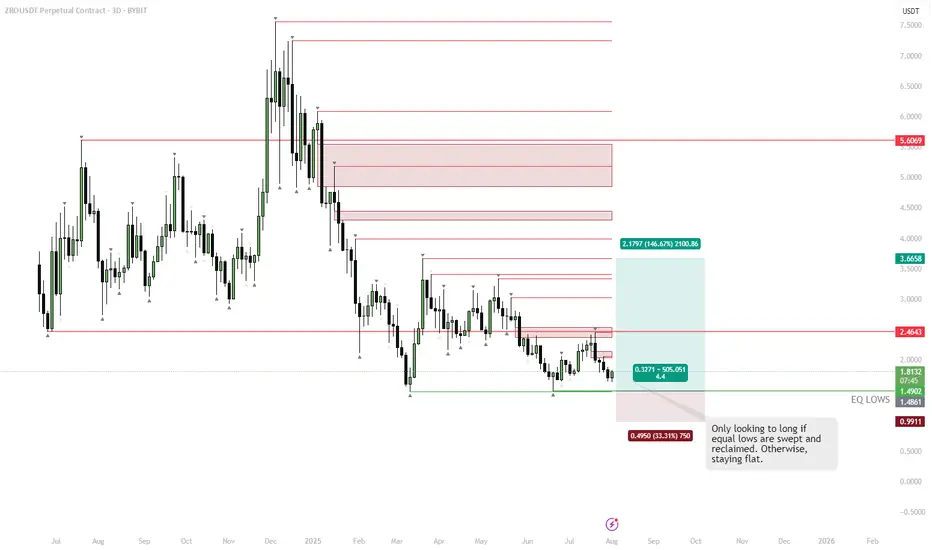
ZRO – Best SetupPrice is consolidating near key equal lows around $1.48–1.50. Liquidity likely sits below these lows, making a sweep into that zone attractive for larger players. Chasing longs here is risky without confirmation.
Plan:
• Wait for a clean sweep below the equal lows
• Look for a strong reclaim of the range back above $1.50 (failed breakdown)
• Entry trigger is confirmation of buyers stepping in after the sweep
If these conditions are met, targeting $2.46 and higher makes sense. No sweep/reclaim = no trade.
DOGE | 3D PlanPrice broke down instead of sweeping the range, leaving a new set of equal lows as liquidity targets. Structure now favors a patience play.
Triggers for action:
Monthly reclaim: Bullish trigger — reclaiming the M level signals strength, opens path for a trend reversal.
Sweep of equal lows: If price dips and runs the new set of equal lows (gray box), look for signs of absorption or reversal for a long setup.
No trade in the middle—waiting for either a proper liquidity sweep or a confirmed reclaim of the major level.

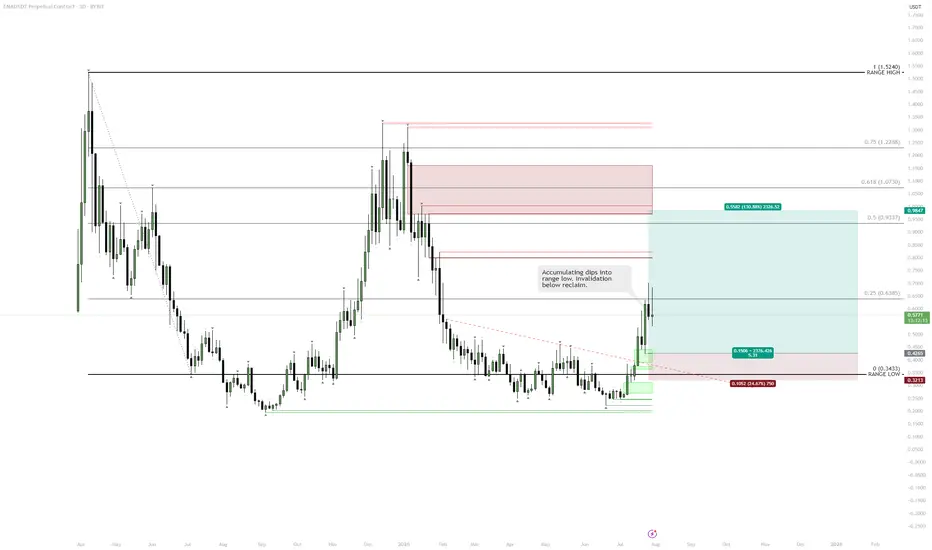
ENA | Range Low Reclaim — Targeting Midrange and AboveClear reclaim of the range low and a strong daily close confirm a bullish market structure shift.
Printing a higher high signals potential for continuation.
Dips toward the reclaimed range low are healthy, providing buy-the-dip opportunities.
Accumulation at the range low with invalidation below keeps risk tight.
Plan:
Accumulate pullbacks toward the range low.
Hold for midrange ($0.83) and upper range/major resistance.
BONK | Waiting for DemandNo position yet—alerts are set for the FVG and HTF demand zone below. DOGE/BONK still showing relative strength, so patience here is warranted.
Plan:
Wait for price to tag HTF area of interest (FVG/demand).
Look for LTF trigger for a long entry.
Prefer clean sweep/reclaim for confirmation.
Reasoning:
BONK has strong momentum, but entry here is late after an extended run.
Letting the setup come to me reduces risk of getting caught in a local top.
DOGE/BONK relative strength signals not to rush.

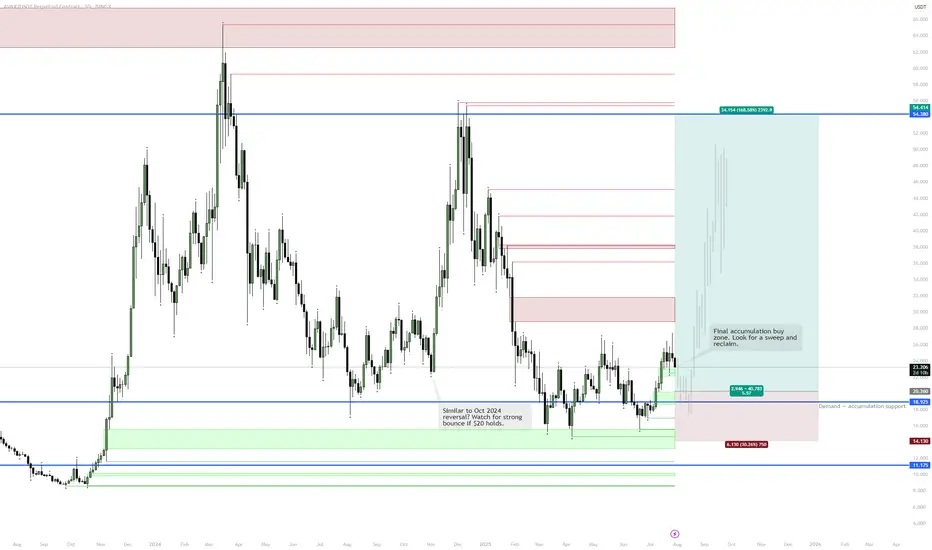
AVAX | Final Accumulation & Potential ReversalContext:
Price is in a major accumulation range, showing similarities to the October 2024 setup.
Green zones indicate strong demand/support; blue is key structural support.
Step-by-Step Scenario:
Accumulation Phase:
Price is consolidating above the $20 level, with repeated defenses of the support zone.
Spot Buys:
Orders set in the $19–$20 area to capture a potential “final shakeout.”
Spring/Reversal:
If price sweeps below $20 and quickly reclaims the level, this signals the final flush before reversal — mirroring the October 2024 bottom structure.
Upside Target:
First major resistance at $38, but the big objective is the $54–55 range, marking previous macro highs and supply.
Invalidation:
A sustained close below $14.1 would break the accumulation structure and invalidate the bullish scenario.
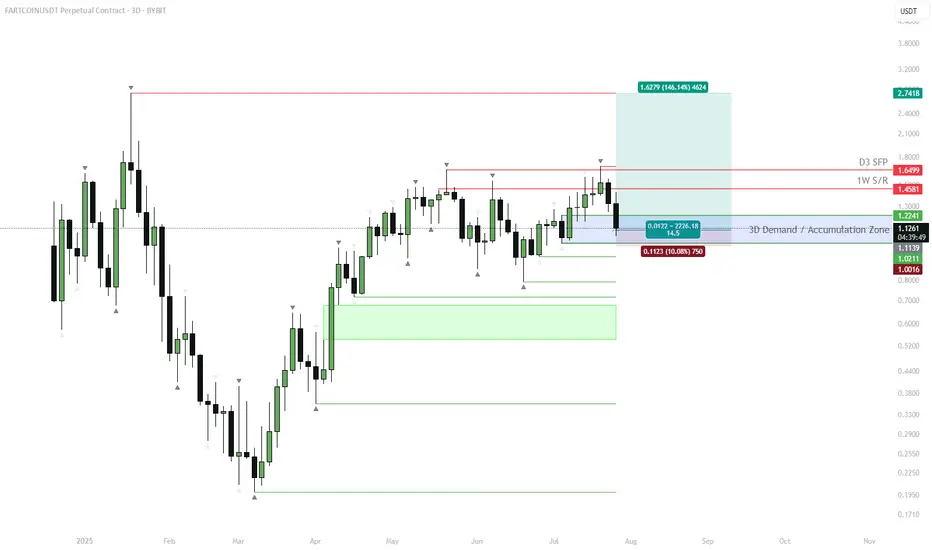
FARTCOIN | #3D — Swing Long from SupportFARTCOIN just tapped into a key 3D support zone after a sweep below prior range lows. The rejection from 1.65–1.45 weekly resistance has set up a fresh entry at demand, with risk well-defined.
Step-by-Step Price Scenario:
Support Confirmation: Price swept the range lows and rebounded from 1.12–1.22 demand. This area is now critical for bulls to hold.
Entry Logic: Accumulation within the blue box is favored for a swing long. Stop loss placed below $1.00 (invalidating the idea if broken).
First Objective: Look for price to reclaim 1.22, with a move toward the weekly S/R at 1.45 as first resistance.
Main Target: If momentum follows through, next key target is 1.65 (D3 SFP), with a possible extension to $2.74 (measured move).
Risk: Breakdown below $1.00 negates the idea and opens the door to much deeper downside (next demand block $0.60–0.80).
Why:
The setup offers a high R:R, with clear invalidation. Reclaiming 1.22 after a sweep typically triggers fast mean reversion, especially on volatile alts. Watch for signs of strength — strong candle closes above 1.22 or a quick retest.
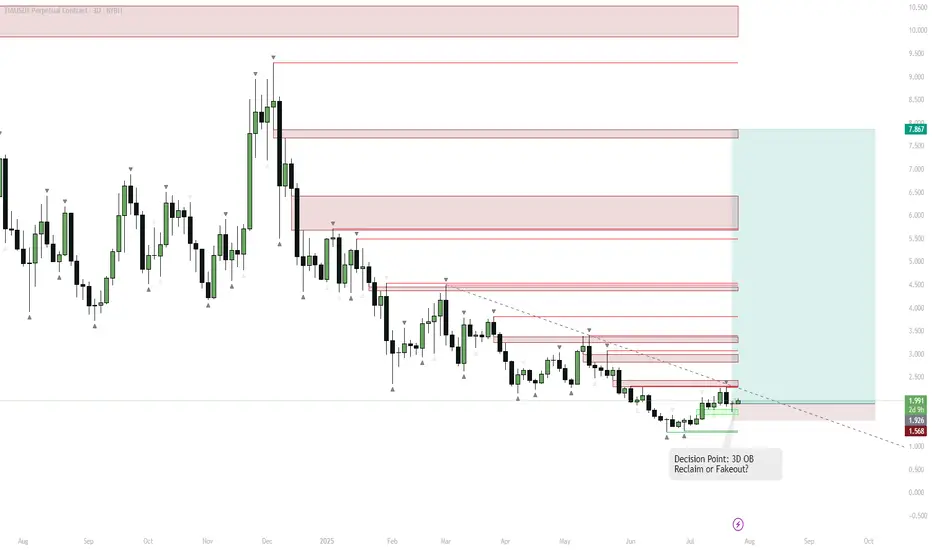
TIA — Pivot Point: 3D Order Block Reclaim or One More Breakdown?Key Observation
LSE:TIA has been in a prolonged downtrend, with a recent strong bounce from multi-month support (highlighted green).
Multiple supply zones (red) are stacked above, representing resistance.
Swing Short Context
Despite the bounce, the asset has a history of fakeouts and failed breakouts ("cursed asset").
A classic "10/10 top/bottom" pattern appears, suggesting a possible short-term top is forming.
However, a 3D bullish order block (OB) has been reclaimed on this candle.
Trigger Confirmation
If this 3D candle closes green and holds above the OB, momentum may flip bullish rapidly.
This reclaim would invalidate the bearish thesis and open up quick moves toward the next supply zones ($2.5–$3.5).
Bearish Alternative
If price fails to hold above the OB, or closes the candle red, the risk of a fakeout and move back to the lower support remains.
The downtrend line is a key resistance; rejection here can trigger another sweep of the lows ($1.56).
Swing Strategy
Short bias as long as price is below the OB and trendline, targeting a move back to $1.56–$1.92.
Flip to long/bullish bias only on a 3D close above the OB zone and trendline — this could trigger a rapid run to $2.5, $3.2, and higher.
Reasoning
The setup is a classic "pivot point" — either a breakdown from resistance for another leg down, or a confirmed breakout above the OB for a strong bullish reversal.
With stacked supply zones overhead, any breakout will likely see aggressive moves as shorts cover and new buyers chase.
Momentum traders should wait for the 3D close for confirmation.
VIRTUAL – Major Confluence ZoneEntry into 3D S/R and Demand Zone (Blue Box)
The current price action is testing a key 3D support/resistance level, which aligns with a historical demand zone.
Multiple diagonal supports converge here, making it a high-probability zone for a reaction.
Accumulation & Reversal Play
The setup suggests that this zone is ideal for building a position.
Expect potential wicks/spikes into the lower blue zone, hunting liquidity before a reversal.
If price holds above ~$1.40 (blue line), look for signs of strength (bullish candles, reclaim of lost support).
Upside Targets
If the zone holds, the first target is the prior local highs ($2.00–2.05).
Further targets are the overhead supply zones (highlighted in red), especially if the momentum persists.
Invalidation
A daily close below $1.40 or sustained trading below the lower blue box invalidates the setup and signals a risk-off environment.

MKR – Bull Pennant Breakout, Eyes on $3000Breakout Confirmation:
MKR has broken out of a daily bull pennant, signaling bullish momentum. The breakout candle reclaimed key HTF S/R (~$1987–$2000 zone) and flipped it to support.
Entry and Risk Zone:
Ideal long entries are on retests of this S/R flip ($1987–$2000). Invalidation below $1826 (recent low and support).
Upside Target:
First target at $2759, full target at $3000 zone, just below the marked supply.
Trade Management:
Trailing stops recommended as price approaches $2750–$2800 to lock in gains.
MKR just broke out of a clean daily bull pennant pattern, confirming a structural shift with a retest and reclaim of high timeframe S/R. This level, previously strong resistance, now acts as support. Combined with the breakout and the momentum from recent market dips, the setup favors continuation to the upside with $2750–$3000 as the likely destination. Failure to hold $1826 invalidates the bullish scenario.

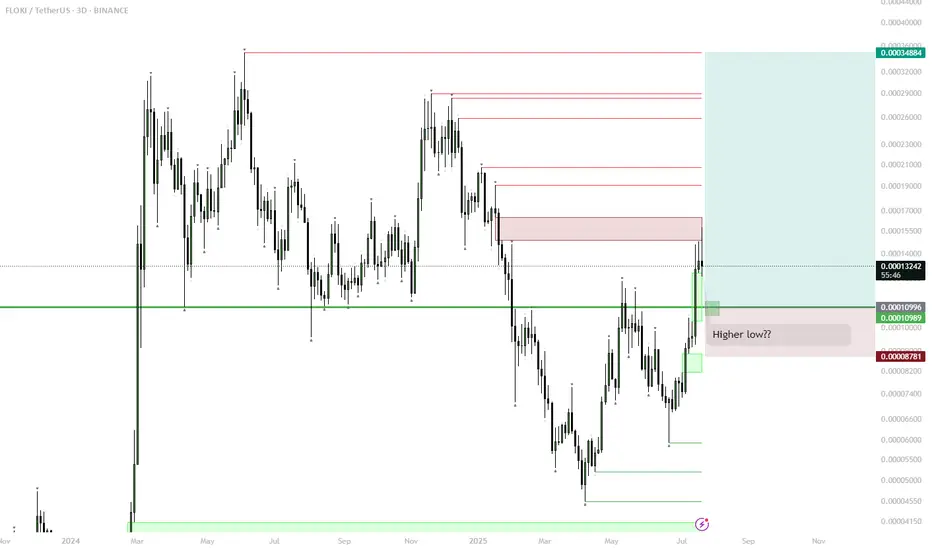
FLOKI – Range Low Setup for Next Big Move? (1D Plan)
FLOKI has reclaimed the key horizontal support, forming a possible higher low.
Currently watching the green box/range low for signs of accumulation (sideways price action) and support confirmation.
If FLOKI establishes a range or shows strength at this zone, look for a long entry with stop below the range.
Upside target is the range high and previous major resistance, offering a potential ~180% move.
Invalidation: clear breakdown and close below the green zone signals failed setup.
FLOKI is showing classic bottoming structure: reclaim of support and formation of a higher low after a prolonged downtrend. Range lows historically have provided major entries for explosive moves. If the green box zone acts as accumulation and price holds, it could set the stage for a rally back to the top of the range as seen before. This setup is favored in meme/altcoin cycles, especially when market sentiment improves. Risk is defined, reward is high.
BTC Dominance — Bounces, Chop, and Next Wave Setup
BTC.D reached strong support, confirming euphoria top for now.
Currently, BTC.D is at the first key support (green zone 59.8–61.1%). This is a logical bounce zone where dominance could chop or rebound short-term.
If BTC.D holds and bounces here, expect more range-bound action, potentially retesting 64–65% (red zone).
If this support breaks, the next area of interest is the 54–55% green box. This would open the door for more sustained altcoin strength (altseason continuation).
Ultimately, a decisive break below both green boxes signals the start of a major altcoin expansion phase, with BTC.D trending lower toward 48–50% support.
BTC Dominance (BTC.D) is at a critical inflection point after rejecting at strong resistance and reaching daily support. Bounces from this area are typical as traders rotate profits, but sustained breakdown below support would mark a shift in market regime, favoring alts. Watching for confirmation — the next parabolic move in alts begins if BTC.D loses these green boxes.

ETHFI Key Reclaim Watch — Only Long Above $1.09 Confirmation✅ Price currently below major 1D S/R — no bullish bias yet
✅ Only looking for a long entry after confirmed reclaim of $1.09
✅ Structure remains bearish until then
Primary Scenario (Bullish):
Enter long only after confirmed reclaim/close above $1.09
Targets: Move to upper range ($2.76) on strength
Bearish/Flat Scenario:
If price fails to reclaim $1.09, no position — stay sidelined
🔔 Triggers & Confirmations:
Only long above $1.09 with confirmation (candle close, volume spike, or strong reclaim)
No trade below $1.09
🚨 Risk Warning:
Structure remains bearish below $1.09 — avoid bottom picking or forced trades

ETH — 3D OB + FVG Swing Long | #3D | BULLISH1️⃣ Buy zone: 2,500–2,600
2️⃣ TP: 3,280–3,495
Stop: < 2,500
Alert: FVG fill

WIF — Accumulation Bounce & FVG Target1. Buy in accumulation range ($0.61–0.78)
2. Confirm entry after bounce/hold
3. Main target: $2.35 (Weekly FVG)
4. Stop: below $0.61 — scenario invalid

TOSHI — Watching for Bullish Breakout Above Daily Supply🎯 Trading Plan:
Wait for breakout and daily close above $0.48–0.50 supply zone
Spot long trigger only after confirmed flip
Stay sidelined below supply — no forced trades
🚨 Risk Warning:
No bullish confirmation unless above supply
Protect capital — no entries on hope

APU Spot Entry — Following Smart Money, Eyeing Meme Rotation✅ Entry based on smart money signal, positive meme sentiment
✅ Strong support at 0.0001548–0.0001553
✅ Upside targets: 0.00052, 0.00112, main at 0.00122
Active Plan:
Hold spot as long as 0.0001548 holds and meme rotation remains strong
Watch for reaction at support to add or manage risk
Monitor meme sector for continued momentum
Profit Targets:
Partial profit: 0.00052 / 0.00112
Main target: 0.00122
🚨 Risk Warning:
Close spot if support at 0.0001548 fails or meme trend weakens
Avoid averaging down below key support

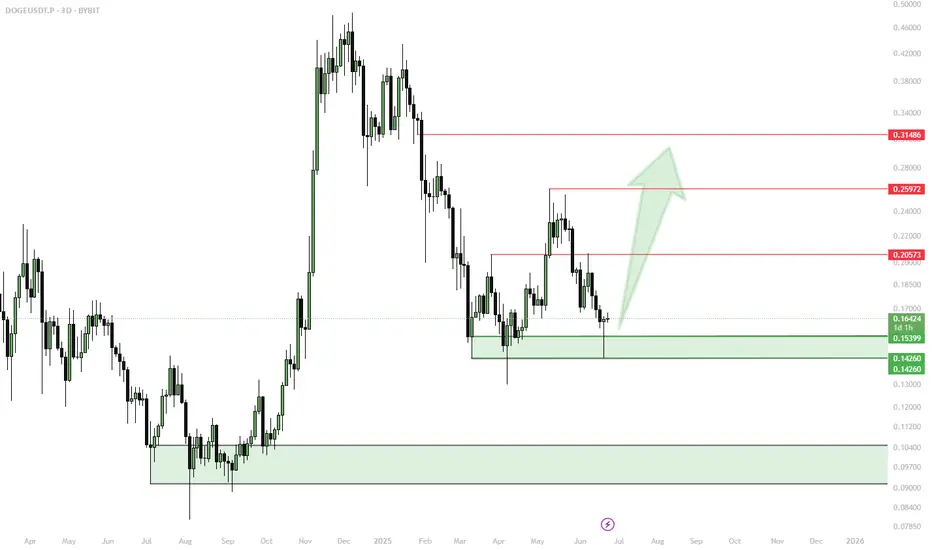
DOGE Forming a Bottom — Risk/Reward Favor Bulls✅ DOGE looks “forgotten” — minimal interest, low volume, no panic selling
✅ Bottoming structure forming; bounce from key support, retest of lows possible
✅ Accumulation only via spot limit orders in green zones; avoid market buys
⚠️ No expectations of breaking ATH, targets capped at $0.31–0.38
1. Bullish Scenario (~55%)
Retest of support zones ($0.143–0.16), spot accumulation
Trigger: Bounce on volume, reclaim of previous quarterly levels
Partial profit: $0.25; main targets: $0.31–0.38
2. Sideways Scenario (~35%)
Consolidation between $0.14–0.18, low volume, slow accumulation
Work the range: accumulate at lows, trim on spikes, patience
3. Bearish Scenario (~10%)
Break below $0.14 with no demand, deeper altcoin market correction
Stop loss on close under $0.14, wait for new supports — no averaging down without buy signals
📝 Order Management & Recommendations:
Place spot limit orders only in $0.143–0.16 and lower green zones
No market FOMO entries
First take-profit: $0.25; main TP: $0.31–0.38
Hard stop/loss under $0.14; no holding through breakdowns
BTC - $100k liquidity nextThis move looks like a classic liquidity grab, setting the stage for a deeper retrace unless reclaimed quickly.
• Watch the 0.5–0.618 retracement zone
• If price loses $99K, next downside target sits around $92K, the next major support level
don’t fight the structure, let the levels lead.

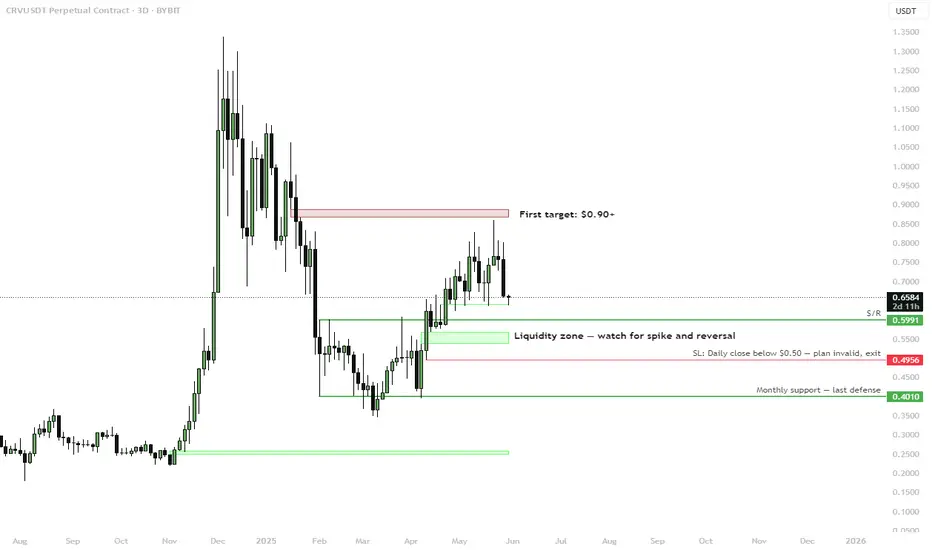
CRV (swing setup) — Watching Liquidity Zone ReactionBINANCE:CRVUSDT is pulling back into a key liquidity zone around $0.60–$0.55. This area acted as prior resistance and is now being retested as support. A spike into this zone with a bullish reaction could offer a strong swing entry.
Setup:
🟩 Liquidity Zone: $0.60–$0.55
Look for liquidity sweep and reversal signal within this zone. Key confluence with S/R flip and HTF demand.
🚫 Invalidation:
• Daily close below $0.50 = setup invalid
• Final defense at $0.4010 (monthly support)
🎯 First Target: $0.90+
Clear resistance above, likely to act as first take-profit zone if reversal plays out.
Plan:
• Monitor lower timeframes for entry trigger inside liquidity zone
• Favor patience and confirmation — this is a high-R setup if structure holds
📌 Classic SFP setup at support — risk defined, upside open.
Rose/USDTI was going through my old watchlist and came across one of my old favorites. I can see a potential opportunity, but it's not a good time to enter just yet. We might need to wait a little longer.
This is how I see the chart, it's in 3-day timeframes.

$INJ setup for 50% gain on next days, 3D timeframeCRYPTOCAP:INJ setup for 50% gain on next days, 3D timeframe:
We are on 3D timeframe here. Blue arrows number '1' and '2', were bottom pivots on Hodlfire Indicator (copyrighted) right over the Exponential Moving Average 200 (3D 200EMA) line (green), and we just got a 3rd, right over the 200EMA again (the last blue panel under late price movements)
So, as we are pivotting the bottom here, we expect next target on the last reset of VWAP line (orange line) at 38.60 usd, bringing over 50%
There was a first and second confirmation of trend, (1.) the support on all-time-high of the last cicle (pink line) and (2.) break of diagonal blue trendline; if you want to wait for another confirmation, the 3rd, just wait suport over the black VWAP quarter line around 27.00 usd

002. Price movements are multidimensional in natureHere you can have an idea of what I´m talking about:
That price movements are multidimensional in nature
Although this may be kind of obvious to some, if we could just unlock those movements that are coming from the screen, or are coming in the direction of the screen, maybe this hidden information could help in trading?
In this description of the DGB price movements, we can project the graph inside a 3D cube, but as a projection, we are plotted in 2D
