Post 10/26 Q3 FY21’ Earnings Analysis$MMM, $AMP, $GOOGL, $GE, $AMD, $COF, $HAS, $V, $TWTR, $UPS, $RTX, $NVS
$MMM - 3M - reported EPS of $2,45/share - beat estimates of $2.21/share - revenue of $8.94B +7.09% YoY
Organic local-currency sales up 6.3% YoY
Operating CF of $1.9B
Adjusted FCF of $1.5B (20%) YoY
Returned $1.4B to shareholders in dividends
Industrial FCF tops estimates
Narrows FY21 EPS outlook - trims full-year earnings view on supply chain challenges
Down (0.09%) after hours
$GOOGL - Google Alphabet Class A - reported EPS of $27.26/share - beat estimates of $19.89/share
Revenue of $53.62B
Top Line growth of 44%
Ad Revenue of $53.13B up 44%
Revenue from Cloud Division of $4.99B up 45%
Reported a $188M gain on investments up 623.1% YoY
Down (0.22%) after hours
$GE - General Electric - reported EPS of $0.57/share - beat estimates of $0.24/share - revenue of $18.43B down (0.5%) YoY
Improvements in FCF performance & growth in earnings - despite weakness in revenues
Bottom Line up 50% YoY
Sales suffered from weakness in Healthcare & Renewable Energy segments - partially offset by gains in Aviation
Organic & Industrial Revenues down (1%) YoY - Aviation Revenues up 10% YoY
Up +0.01% after hours
$AMD - Advanced Micro Devices - reported EPS of $0.73/share - beat estimates of $0.67/share - revenue of $4.31B up 54% YoY
Adjusted Gross Margin of 48% - in line with estimates - up 44% YoY
Capital Expenditures of $85M
Computer/Graphics segment revenue of $2.4B up 44% YoY
Q4 revenue estimates raised to $4.6B
Down (0.41%) after hours
$COF - Capital One - Reported EPS of $4686/share - beat estimates of $4.99/share - revenue of $7.83B +6.1% YoY
Earnings Surprise of 31.42%
Beat consensus EPS estimates past 4 quarters
Revenue rise reflects loan growth
Net credit card charge-offs improved in Sept
Down (4.01%) after hours
$HAS - Hasbro - reported EPS of $1.96/share - beat estimates of $1.70/share - revenue of $1.97B +10.88% YoY
Operating Profit of $367.9M up 9% YoY
Adjusted Operating Profit of $389.6M up 6% YoY
Net Earnings of $253.2M up 15% YoY
Adjusted Net Earnings of $271.2M up 5% YoY
Supply chain challenges weigh on top line
Further reduced debt & maintained a strong cash position - repaid $400M of debt & funded quarterly dividend
Up +1.46% after hours
$V - Visa - reported EPS of $1.62/share - beat estimates of $1.53/share - revenue of $6.56B up 27.45% YoY
Earnings Surprise of 5.88%
Surpassed consensus EPS estimates past 4 quarters
Announce boost in quarterly dividend
Down (2.60%) after hours
$TWTR - Twitter - reported EPS of ($0.54) - missing estimates of $0.02/share - revenue of $1.28B up 37% YoY
Reported a net loss of ($537M) vs. $29M in FY20' due to a legal settlement - does not expect to recoup the full revenue loss
Ad Revenue rose more than 41% YoY to $4.14B up 6% YoY
Number of Monetized users grew by 5M - user base up 13% YoY
Apple's privacy changes to iOS 14 has less of an impact than expected
$UPS - United Parcel Service - reported EPS of $2.71/share - beat estimates of $2.55/share - revenue of $23.18B
US Domestic Package Revenues of $14.2B up 7.4% YoY
Bottom Line up 18.9% YoY with strong performance across all segments
Top Line up 9.2% YoY drive by up beat demand for e-commerce related package deliveries
Operating Profit of $2.97B up 23.4% YoY
Up +0.52% after hours
$RTX - Raytheon Technologies - reported EPS of $1.26/share - beating estimates of $1.08/share - revenue of $16.2B up 7.7% YoY
Sales of $16.2B - missing estimates of $16.9B - up 9.9% YoY
Operating Profit of $1.3B - up 209.5% YoY
Bottom Line up 125% YoY - attributable to higher YoY revenues & operating profit
Newly disclosed quarterly dividend paid $0.51/share on 10/19/21 - represents a $2.04 dividend on an annualized basis
Down (0.46%) after hours
$NVS - Novartis - reported EPS of $1.71/share - beat estimates of $1.64/share - revenue of $13.03B up 6.2% YoY
Net Income of $2.76B up 43% YoY
Net Sales $13,03B up 6% YoY - volume contributed 9 percentage points to sales growth
Down (1.38%) after hours
3m

3M | Fundamental Analysis | Must Read...Industrial giant 3M will publish its Q3 earnings on Oct. 26. As always, quarterly earnings reports help shape investor thinking, whether it's near-term or long-term. Unfortunately, 3M management isn't likely to give investors much good news regarding near-term trends, but what about the long-term outlook? Here's what you should know before the earnings report comes out.
The case for buying 3M is based on the idea that the significant free cash flow (FCF) generated by the company will give management the time and strength to turn around some of the volatile performance of recent years. Furthermore, based on that very FCF, the stock looks very favorable. If the company reaches Wall Street's consensus FCF forecast of $5.7 billion in 2021, it will trade at 18.2 times its FCF (current market capitalization is $104 billion).
That's a pretty reasonable valuation for a mature industrial business proficient in increasing revenues at a rate not exceeding a single digit (in line with economic growth). If you add some margin expansion to this, and investors can expect a mix of stable earnings growth and dividend growth (current yield is 3.3%), then 3M is an excellent value investment option.
However, the question is, where is 3M's profit margin headed? Gross profit margin (profit after cost of goods) is one of the best ways to measure a company's pricing power in the marketplace. While earnings margin before interest, taxes, depreciation, and amortization (EBITDA) also includes operating expenses and is a great way to measure how well a company is managed.
3M's performance has been questionable in recent years, and this is not due to the COVID-19 pandemic.
In short, 3M needs to persuade investors that it can return the company to a long-term uptrend in margins. To that end, CEO Mike Roman restructured the business. The company is now managed from four operating segments rather than five, and business groups are now managed globally rather than by country. At the same time, management has undertaken restructuring expenses to streamline its operations.
Moreover, management has invested in digital capabilities. The poorly performing healthcare segment has been restructured through divestitures and acquisitions, such as the $6.7 billion purchase of Acelity, a trauma business, and M*Modal, a $1 billion health information systems business; both deals were completed in 2019.
So investors are right to sit back and say, "Show me margin expansion." But unfortunately, the COVID-19 pandemic has struck, and its distorting effects have made it much harder to see improvement, especially in terms of margin performance. Moreover, it is difficult to compare similar performance when the economy enters a period of downtime and resumption is impacted by soaring commodity prices and supply chain problems in key end markets.
Moreover, many of the problems associated with resumption have worsened in 2021. As a result, the critical data most investors will be watching relates to the ratio of 3M's price to its cost of production. This is a critical metric for investors because 3M management prides itself on investing in innovation to produce differentiated products - in other words, products with pricing power.
The dispute over whether 3M products are losing or gaining pricing power won't be resolved during the next earnings report, but we do know that pressure is building because of rising raw material costs and difficulties in the supply chain.
For instance, CFO Monish Patolawala projected a $0 to $0.10 decline in earnings per share at the beginning of the year due to rising raw material prices. He later raised that forecast to $0.20, then to $0.30-$0.50 in April, and then to $0.65-$0.80 in July. Moving on to the Morgan Stanley Laguna Conference in mid-September, and Patolawala guided investors to the high end of the range. And that's without taking into account the impact on the supply chain of plant shutdowns during Hurricane Ida.
Patolawala also said that inflation is outpacing 3M's ability to raise prices, and noted that auto production (a key end market for 3M) will be weaker than originally expected. In addition, the health care recovery has been uneven and the number of fee-for-service procedures is below management expectations, semiconductor shortages have impacted consumer electronics, and office resumption (3M sells office supplies) has been delayed.
All point to a troubled earnings report.
Still, much of the bad news should already be priced in, so don't be surprised if 3M stock rises if management's recommendations and comments turn out not to be so bad. Still, the earnings report is unlikely to do much good for long-term investors who are looking for convincing evidence that the turnaround attempts are working. Thus, 3M is likely to remain a good value stock, but with doubts surrounding it.
Purchase of 3M in the continuation of the 5th wave of growthThe company is 3M (MMM).
According to all estimates and proportions, now the price in 3M is in the 4th wave in the form of a triangle. The price is at the lower border of the triangle, there have already been false takeaways down.
I propose to consider buying it in the continuation of the 5th wave with the goal of expanding on the first wave of Fibonacci 2.618, or 0.618 from the third wave.
These Fibonacci levels coincide with the global maximum of January 2018, which also confirms their validity.
The potential yield from the current price is 32 percent with the prospect of growth for about a year.
Naturally , this is not an investment recommendation.

MMM Stock LongMMM stock confirmed the formation of an upward sloping trend line on th weekly timeframe showing to what extent the bulls are in control of the trades pushing the prices higher.
Price Targets: $201.35 - $206.55 - $216.35

3M MMM Long CallFilled @ $1.46 - Buy Jul-16-21 $220 Strike Call
Added to existing long call.
NYSE:MMM

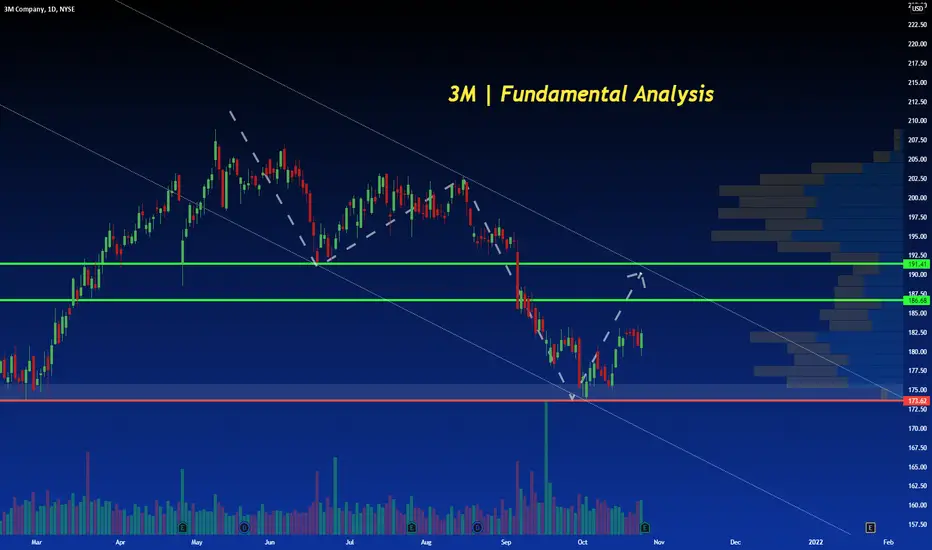
Understanding the Bullish Area on MMMUnderstanding the Bullish Area on MMM
- On MMM, the price has broken a key resistance zone (now working as support), and we want to find similarities to previous situations to project possible scenarios.
- We can see that every time the price either bounce on the zone or broke it from below, we had a bullish movement towards the next resistance zone.
- The % we expect from the beginning of the movement is 19%. The expected duration of the movement is between 100 and 250 days
- During the movement, we can expect corrections to provide good entry levels to catch some % of the 19% expected movement.
Thanks for reading!


3M India. Trend ResumptionLooks like stock is done with its correction of 2.5 years. Can provide great results in 2-3 years.

MMM on the way to new ATH? Why you want to be long - MMM came up in new trend in 2016. and made ATH 2 years later in 2018., after he fell on support line on 2020. due to the corona crisis
As we can see It was take 2 years from support to the resistance levels and again to support. We are coming in 1/4 of year and MOM is a halfway to ATH .
What we need to do now is looking will MMM get on ATH level a little bit faster than previous years, or maybe we will get some correction before reaching ATH .
But in short period PT maybe will be at Fibos. approx. $205. with "HH" and "HL" and creating new ascending triangle before next movements.
Thank you for reading my analysis, give some support to the new TA trader with press like button and leaving some comments :)
NYSE:MMM

MMM 3M Company Stock Technical Analysis of Price by Z4Zachary Speculation into the future.
TRADING IS NOT SUITABLE FOR EVERYONE.
If you don't know what you're doing... TRADING CAN CAUSE YOU TO COMPLETE LOSE ALL OF YOUR MONEY.
Comment if you feel like it and have a great day!
This is an example chart demonstrating how I may choose a strike price when purchasing stock option puts
If you don't know what that is then you should trade demo.


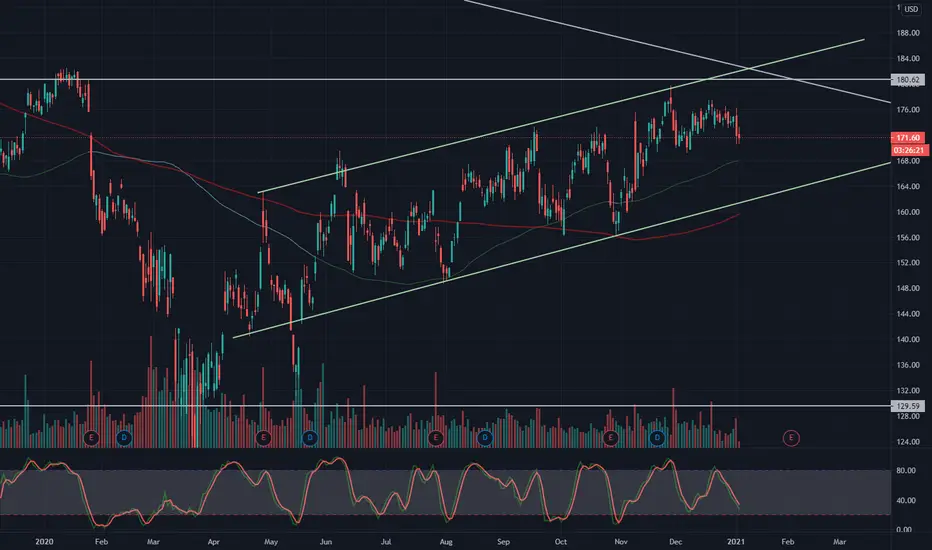

$MMM 3M Co. - Long Term Bull Flag, Bullish Options Activity$MMM 3M Co. - Long Term Bull Flag, Bullish Options Activity
3M slowly approaching a break out of a long term bull flag pattern on the weekly chart. Monitor for a close above $171.
Bullish Options Activity:
$5.3 M in $165.00 strike (ITM) Dec'20 calls traded today (18x OI)
$3.9M in $170.00 strike (OTM) Dec'20 calls traded today (8x OI)
Medium term target: $182.00 by year-end
Long term target: $220.00 by July'21
Note: This is NOT investment advice.


Our Stock of the Day / 3M CompanyToday we have a short setup to take; here, we will show a full explanation of it.
a) Before understanding this idea, we should take a look at the Daily chart
-The price reached a major reversal zone composed of a Daily descending trendline and a resistance zone
-Based on that, we can see substantial bearish potential towards the next support zone
-Having the big picture clear, we can develop our setup on the 30minutes chart
b) We have a corrective structure making a pullback on the resistance level and the broken ascending trendline
c) We have set our short orders below "C" at 158.8
d) The break-even is on the first fibo extension
e) We will close our position on the next support zone
f) The risk we are taking here is 1%.
Trade Safe, protect your capital, and always understand what you are doing!

3m - Dividend Star - Long TradeHey everyone,
3m is one of the most suggested stocks when it comes to dividends. But also for traders there are decent opportunities atm. The stock goes along the support area, the RSI is on the buy side but not overbought but the trend aims up. The dividend is 3.5% and the company raised their dividend since the past 62 years. One could say, you can buy it now no matter what kind of investment style you have <3
Buy: Now / 162$
( Stop: 159$ )
( Take Profit: 182$ )
Much fun with that trade / invest!
Leave a follow please, my goal is 200 :)

3M - MMM - Long IdeaI was asked about this chart and the technicals look great! Obviously this is a longer term play, but look at those areas of interest.


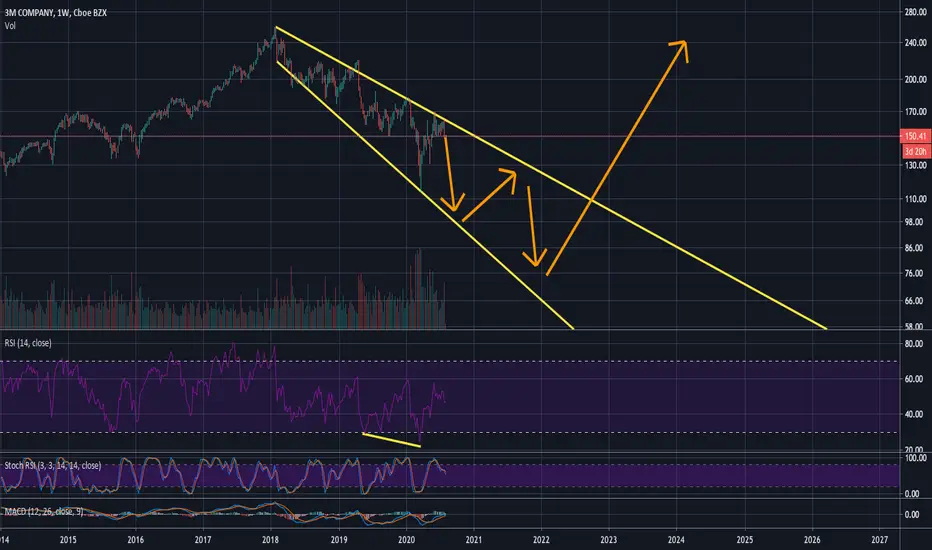
The Other Kind of Broadening FormationIn many of my posts, I highlight the rising broadening patterns that have emerged on many of today's popular tech stocks. These of course, once complete, are somewhat devastating to those patterns' underlyings. The price action tends to fall from those broadening patterns with some force.
However, significantly more rare in today's highly financialized bubble stock market is the converse pattern, the falling broadening pattern. And with 3M, that is what we see. A fundamental shift in the price action began in 2018, ending 3M's multi-decade bull market. This agrees with a general shift in tone that I see on many world indices that began in 2018.
And it was at this point that it began to form it's falling broadening pattern. As with many other stocks, this will of course deteriorate significantly, however, this ends with a terrific moonshot to the upside. That of course will not be happening any time too soon, as presently, the bearish convergence on the RSI indicates to us that we have more downside to come first.
But, perhaps it is in our eventual future that manufacturing in the United States will make some recovery, and perhaps this stock will reflect that when it is time.
Menarik ready untuk beli. BOD. trysetup 3M yang baik
ready untuk perfect entry
buy low sell high
#berlatih
