bulish on gold 3389currently no momentom downward.
breakout 3315 more potential riding on sell mode.
4-WAVE

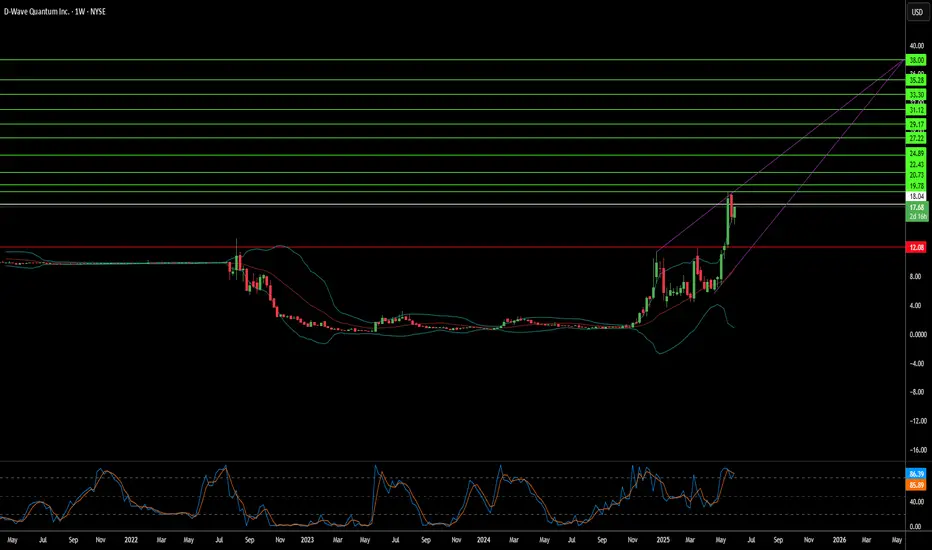
Beyond Bits: Is D-Wave Quantum the Unseen Power?D-Wave Quantum is rapidly solidifying its position as a transformative force in the burgeoning field of quantum computing. The company recently achieved a significant milestone with its Advantage2 system, demonstrating "beyond-classical computation." This breakthrough involved solving a complex simulation problem for magnetic materials in minutes, a task that would have required nearly a million years and the equivalent of the world's annual electricity consumption from the most powerful classical supercomputers. This distinct achievement, rooted in D-Wave's specialized quantum annealing approach, sets it apart from other industry players, including Google, which primarily focuses on gate-model quantum architectures.
D-Wave's unique technological focus translates into a formidable commercial advantage. It stands as the sole provider of commercially available quantum computers, which excel at solving intricate optimization problems—a substantial segment of the overall quantum computing market. While competitors grapple with the long-term development of universal gate-model systems, D-Wave's annealing technology delivers immediate, practical applications. This strategic differentiation allows D-Wave to capture and expand its market share within an industry poised for exponential growth.
Beyond its commercial prowess, D-Wave plays a critical role in national security. The company maintains deep ties with elite U.S. national security entities, notably through its backing by In-Q-Tel, the CIA's venture capital arm. Recent installations, such as the Advantage2 system at Davidson Technologies for defense applications, underscore D-Wave's strategic importance in addressing complex national security challenges. Despite its groundbreaking technology and strategic partnerships, D-Wave's stock experiences considerable volatility. This reflects both the speculative nature of a nascent, complex industry and potential market manipulations by investment houses with conflicting interests, highlighting the intricate dynamics surrounding disruptive technological advancements.
Hellena | GOLD (4H): LONG to resistance area of 3439.37.Colleagues, Last time, I suggested that the five-wave movement was not yet complete. It seems that this is indeed the case.
Wave "5" of the higher degree is unfolding, and I expect the price to reach the resistance area around 3439.37, which marks the top of wave "X".
Within the smaller five-wave structure, I believe wave "3" is currently in progress.
A correction toward the 3248.38 area is possible.
Manage your capital correctly and competently! Only enter trades based on reliable patterns!

IBM... Time to pull the plug ?For those who think the market in general and technology in particular are over valued, one sale candidate may be IBM.
Technically we have reached the first and second objectives of a Harmonic Cypher pattern began in early April.
Secondly a Bearish Wolfe Wave pattern appears to have formed.
RSI is overbought but there is no divergence yet,
If we close several times below $266 (the February triple top) then this may be a confirmation signal.
More confirmation would be a breach of the WW's 1-3 line marked in red.
If this occurs my target would be the $240 area.
Always assess the market and sector direction before entering a position
Do your own due diligence,,, not investment advice.
Good Luck
S.
(Note this is a shorter term chart)

SPOTIFY (SPOT) ... Time to cut the chord ??Technically Spotify is exhibiting weakness.
There is a clear Bearish Wolfe Wave pattern as well as an evolving Bearish Harmonic Cypher one.
Additionally RSI is exhibiting bearish divergence.
Certainly worth watching as WH Fake News tariff negotiations fail to materialize and consumers face increased costs and reduced incomes.
SPOT is definitely economically sensitive.
I would look to sell a break of the dotted line or a rally that is unsustainable.
Do your own due diligence. Not Investment advice.
This is a short time frame !
Good Luck
S.

CrowdStrike (CRWD)... Time to disperse ?On a technical basis one victim of a continued market tariff downturn maybe CrowdStrike (CRWD) providing a selling/short opportunity.
Particularly if DJT's tariffs start applying to services.
IMHO two bearish technical formations support this:
1. A Bearish Harmonic Shark formation
2. A Bearish Wolfe Wave
Additionally there is emerging RSI bearish divergence. (bottom panel)
Today the Fed speaks so perhaps this will provide this opportunity.
Optimally the $440 level may provide this selling opportunity.
Also let the overall direction and tone of the market should color your decision.
This is just my opinion. Do your own due diligence.
I will follow up with a short recommendation as warranted.
Good Luck

$CRWD double top off W into overbought, $400 pullbackNASDAQ:CRWD on watch for put swing. We have a possible double top off accelerated upswing momentum. Expecting a pullback into the 50 and 20 EMAs.
WSL

MARA...Poised to turn ??MARA Holdings, Inc. is a digital asset technology company, which engages in mining cryptocurrencies with a focus on the Bitcoin ecosystem.
They have a current P/E of 8.18 and a slightly positive seasonal rating.
Generally there is a fairly good correlation with BTC.
Technically I see several patterns at present:
1. A Bullish Wolfe Wave
2. A Complete ABCD pattern
3. A Longer term Harmonic Bullish Crab pattern.
4. Positive RSI divergence appears to be present,
I point this out being fully aware of the present chaos the market is in.
Specifically :
1. With a Tariff Policy probably formulated from a CHATGPT search by a DOGE junior staffer.
2. Where s 401(K)s risks becoming a 201(K)s.
3. Where the Waffle House appears not to care and but can shift and change policy at any point.
4. Analysts estimated are positive (insert)
That said and with a stronger BTC and a generally positive market shift, I believe MARA will participate.
Note: There is a longer term crab pattern in play which suggests we may bottom out around the $7 area.
We need clarification and a reversal of currently ill advised and destructive tariff policy.
I will entertain a long position if we close above the $11.60 area with volume, a stronger BTC a positive market outlook and tariff nullification.
My Targets are marked. Analysts targets ate an insert.
Q4 and Full year earnings are set for early May. Q3 exceeded expectations
This is not Investment advice. Do your own due diligence.
S.

COTI WAVE 3 is coming COTI has completed its initial phases, Wave 1, 2 of Elliot waves and is preparing for Wave 3📈.
Also COTI V2, released recently, aims to revolutionize web3 privacy.
COTI’s market capitalization is $96 million, suggesting substantial potential gains during the upcoming bull market🚀.
This information is not financial advice. Conduct thorough research before making investment decisions.

XAUUSD Potential rise There is an upward impulse wave and a correction pattern. Another upward impulse wave is expected.

Potential rise in the price of the euro/dollarHello traders
The upward momentum is strong and there is a correction. I expect the price to continue its trend and break the top.

Which of the Multiple Patterns Will Play Out?Hey friends, I’m back with another great coin analysis. Today we’re looking at #FORMUSDT.P. On this coin, we have multiple formations, including the BULLISH WOLF WAVE FORMATION, a potential breakdown of a falling wedge, and perhaps a flag formation as well.
If we take the Wolf Wave formation as our main guide, our first target would be the $2.40 level, which corresponds to the 4th movement in the pattern. The second target, depending on the time frame, would be around the blue line, which is approximately $2.63.
If the flag formation plays out, we could potentially see a price range between $2.80 and $3.10.
Let’s watch and see how it goes. My long position is active with some leverage.
Let’s fish and see what happens! 🎯
Manage your risk, stay in the game! 🎯🔥
#AlyAnaliz #TradeSmart #CryptoVision #FORMUSDT #Binanciega

#AVAX/USDT Short-term riseHello traders!
There is an upward wave and the price is declining in a correction . I expect a similar upward wave. We have an POI Zone and I expect the wave to start from there.

Apple.. Now becoming A-Peeling ??APPLE (APPL) has retraced about 50% of its range from April 2024
Currently I see a bullish Wolfe Wave emerging on a 4H timeframe.
Additionally points 2-3-4-5 have formed a nearly perfect ABCD pattern
We do need a broad market reversal and more business clarity from the Waffle House to engage.
I have indicated my targets.
A safer way to play this is to wait for a confirmation with an upwards break of the 1-3 line.
(~219/220 area)
Not about Investment advice. Do your own due diligence.
S.

Potential scenario for goldEntry only upon forming a Wolfe Wave, upon return from the sweet zone. Follow risk management.

Cosmos Atom BullishI am not a financial advisor. This is not meant to be and does not constitute financial, investment, trading, or any other types of advice or recommendation.

EURNZD Potential declineHello traders, we have a downward wave and a correction pattern. Another downward wave is expected.

Bitcoin Forecast by NEoWaveIn the previous analysis, I said that we seem to be in wave-(e) of D. We considered wave-D as a diametric, which seems to have ended with the drop in Bitcoin price and we should consider the diametric to be over and change the labeling a little. Currently, considering what happened, we have two scenarios:
Scenario 1
In this scenario, if the Bitcoin price is maintained above $70,000, there is a possibility of a double combination pattern, the second pattern will probably be a Diametric or Neutral Triangle or a Reverse Contracting Triangle, and wave-D (higher degree wave) will continue. In this case, the price could touch $150,000.
Scenario 2
In this scenario, if the price goes below the key level of $70,000, we should consider wave-D to be over and the price could decline to the range of $49,000-43.00 and wave-E will be completed.

$BTC/$USDT Small uptick then short before long up? ThoughtsI am not a pro trader so know that. I do trade and I make money. I also loose it to. But over all I am up.. still nothing to say I am better than anyone else other than I guess time spend researching myself most days and many days at length. Into finance and crypto laws tax and more.
This idea is purely speculation and I would love the speculation and or validation if you agree. I’m using a simple 1-2 level support and resistance signal/indicator. Thanks for looking! Hope it surveys you well! Stay trading! Book orders CHEAP and sell HIGH! Set the orders so you don’t miss bottoms and tops! You can do it just be PATIENT. They are who win. Trust in it! Study and be happy enjoy the ride! Good luck all.

Possible rise in the US30 indexHello traders
The current impulse wave is upward and the correction is over. Another impulse wave may start upward from here.

CrowdStrike (CRWD) ... Time to Clap ??Big earnings miss and softer forward looking statements from CrowdStrike today.
Sold off to the six month $343 support area and bounced with the general market.
A continuation of this tech rally should help CRWD.
A Wolfe Wave Pattern and a Bullish Harmonic Butterfly are present in the 1H timeframe.
I'd try to buy a retest of the 1-3 line breakout at $360 with a tight stop and with overall market strength.
A clearer Tariff stance from the Waffle House might also help.
A gap has to be filled at $370 and a $400 target is not unreasonable.
Stay nimble. Not investment advice and do your own due diligence.
S.

Potential rise for goldHello traders
there is an upward momentum and an expanding correction pattern, another upward wave is expected.

SPX..Sell a rallyI'd be looking to sell a rally in the coming week on any SPX strength
(Probably the best proxy is the SPY Index)
This is based on Wolfe Wave analysis.
You may get an oversold pop on NVDA's earnings (Wed.)
My target sell area is around 6060.
My cover is about 250 points lower.
If it happens then it happens.
Not financial advice.. do you own due diligence,
S.
